
Manuscript accepted on :30-01-2025
Published online on: 12-02-2025
Plagiarism Check: Yes
Reviewed by: Dr. Ahmed Salah
Second Review by: Dr. Nagham Aljamali
Final Approval by: Dr. Prabhishek Singh
Punam Gulande* and Raval Awale
Department of Electronics Engineering, VJTI, Mumbai University, Mumbai, India.
Corresponding Author E-mail: poonamv.gadge@gmail.com
DOI : https://dx.doi.org/10.13005/bpj/3086
Abstract
Worldwide Lung cancer is the leading causes of cancer-related death, thus emphasizing the need for early and accurate detection to improve patient outcomes. While imaging modalities such as Computerized Tomography (CT) are widely used for identifying abnormal tissues and tumor characteristics, integrating advanced computational methods offers transformative potential in diagnostics. This study focuses on leveraging a hybrid machine learning approach for lung cancer classification using microarray gene expression profiles. Gene expression profiling provides critical insights into genetic abnormalities associated with cancer, but the high dimensionality of the data relative to the sample size poses significant analytical challenges. To address this, a hybrid Minimum Redundancy Maximum Relevance (mRMR) and Recursive Feature Selection Algorithm (RSA) framework was developed to enhance feature selection and classification accuracy. The K-Nearest Neighbor (KNN) algorithm demonstrated superior performance, achieving high accuracy and notable improvements in precision and recall metrics. Among various models evaluated like SVM, ANN, the K-Nearest Neighbor (KNN) algorithm determined to give superior performance with achieved high accuracy of 92.37% with dataset1 and 92.01% with dataset2. These findings highlight the promise of hybrid machine learning techniques in early prediction for diagnosis, paving the way for more personalized and effective lung cancer detection and treatment strategies. The potential implications of the findings for personalized lung cancer detection and treatment are significant and transformative. The use of hybrid machine learning techniques enables earlier detection of lung cancer. This could lead to improving survival rates, Personalized Treatment Plans, Precision Medicine, Predictive Capabilities, Cost-Effectiveness.
Keywords
Computerized Tomography (CT); Recursive Feature Selection Algorithm (RSA); K-Nearest Neighbor (KNN)
Download this article as:| Copy the following to cite this article: Gulande P, Awale R, A Hybrid mRMR-RSA Feature Selection Approach for Lung Cancer Diagnosis Using Gene Expression Data. Biomed Pharmacol J 2025;18(March Spl Edition). |
| Copy the following to cite this URL: Gulande P, Awale R, A Hybrid mRMR-RSA Feature Selection Approach for Lung Cancer Diagnosis Using Gene Expression Data. Biomed Pharmacol J 2025;18(March Spl Edition). Available from: https://bit.ly/3F77caO |
Introduction
Genetic engineering is a research area that presents a new task because DNA Microarray contains approximately 25000 genes. At the same time, their features may have many drawbacks and are not all essential for a differentiating function. A scientific approach is required for predictability and diagnosis using genetic classification. Since the data is incomplete, out of line and contains intangible parameters, the Soft Computing Method helps to analyze the data, detect and predict the diseases. Outdated data sets adversely affect accuracy and performance time. Therefore, selecting a feature is the most important task that represents the entire database. Genetics is a field that gazes at the characters (like color of eyes) transmitted from parents to their children. Genetics are the fragments of DNA (deoxyribonucleic acid) within our cells. It helps to determine how the proteins are made in cells that the body wants to work upon. As it is already known, DNA is the genetic “blueprint” for every cell in the body. Genetics affect the genetic traits inherited from parents to kids, for example height, color of eyes and color of hair. Moreover, they have an effect on a person’s health with certain diseases, such as cancer. In the growth of cancer, genetic mutations play a key role. Genetic mutations can cause a cell to produce (or not produce) proteins that affect the cell’s growth and disintegration into new cells. The cell becomes unstable due to some mutations, which can lead to cancer. However, of all cancers around 5 to 10 percent only thought to be closely linked to hereditary mutations. Many cancers begin for the reason of a genetic predisposition that occurs throughout a person’s lifespan. Seldom had these genetic mutations an external source, for example exposure to the sun or tobacco. However genetic mutations can also be accidental measures that occasionally occur within a cell, for no apparent reason. Recognized mutations only affect those cells that develop from a modified cell. They have no effect on each cell in the human body. However normal cells in the body will not have any mutations, whereas all cancer cells will have mutations. As a result, changes are not passed on to human offspring. This is very different from genetic mutations, which are present in all body cells and even cancer-free cells.
Genetic Testing
Genetic testing is aimed to examine variations or changes that are termed as mutations in the DNA. Genetic testing is important and beneficial in many medical fields. It can change the medical assistance the individual or a family member needs to get in order to be in good health. For example, genetic testing may provide diagnostic tests such as Fragile X or any other evidence about your possibility of having cancer. Different types of genetic testing exist which are performed using a blood or saliva sample and the results are usually released within a few weeks. Because of sharing DNA with family members, if one is found to have a genetic mutation, the family members may also have a similar mutation. Genetic counseling at various stages during genetic testing can assist in ensuring that the correct person undergoes a genetic test, and that one can apprehend the results. Genetic Testing is conducted for learning about a genetic disorder in the family before detection of symptoms, for detecting a possible genetic impact during the pregnancy stages, and for learning about the effect of a genetic disorder on the subsequent generations and understanding a strategy for the prevention and treatment of cancer.
Cancer classification, which is based on cellular research has increased the interest of researchers as it provides an efficient, accurate and decisive diagnosis of different types of cancer. A few recent types of studies have explored that there exist various methods of cancer classification using machine learning algorithms, data mining and available mathematical methods, to access functional analysis and investigation of gene expression profiles. A deeper understanding of the problem of cancer differentiation has been provided after studying the features of thousands of genes simultaneously. At present, a lot of data is available for testing. Likewise, it has also been used in another variety of applications, such as cancer prognosis, drug discovery and diagnostic tests, which are extremely important in cancer treatment.
In addition, Cancer classification facilitates the understanding of the genetic function and the interface between genes under regular and uncommon conditions. This is accomplished by observing the behavior of genetic expression under altered conditions. DNA stores the genetic information required by all living beings to form, perform or function, and develop. DNA is said to be the basis of all living organisms as its components contain all the information required to sustain life. This genetic information is stored and transmitted between various cells during the procedure of cell partition when the parent cell splits into two new female cells. DNA cells form a double helix that is joined in an orderly sequence. Four basic cell units are constructive. The DNA helix then structures a sequence so that each component of a single strand can be joined to another component. DNA cut down the bond between its two strands and each strand then makes the same new strand, reassemble, and twist again.
The genome sequence of all DNA presents a model for synthesizing various RNA (Ribonucleic acid) molecules. The important types of RNA are transfer RNA (tRNA), messenger RNA (mRNA) and ribosomal RNA (rRNA). One of the major purposes of DNA is to create proteins that are accountable for many cellular functions. The protein-building process has two major steps. First, the transcription phase in which a DNA molecule is transliterated into a messenger RNA or mRNA (a type of RNA) and next is the translation phase in which mRNA is transformed by a sequence of amino acid proteins to perform cellular functions. When proteins are formed, a gene is said to be produced. The most common way to measure gene expression is to measure mRNA rather than protein. The reason for using mRNA sequences is due to its nature of binding-in sequence of RNA or DNA when the site is devoid of protein.
In our routine lives, we are continuously bounded by all kinds of big data. The data is getting bigger not only in terms of the number of samples but also the larger number of topographies. One of the problems with Big Data is high size. The current circumstance has led to data mining activities, for example data fragmentation plagued by low performance and high computer operating time. In addition, it is thought-provoking to use topographies selection in high-resolution data or large data. This is mainly sensitive to bioinformatics, particularly DNA microarray analysis. The identified classification methods used in high-resolution data are compared with the most popular classification algorithms.
Genetic appearances is the technique by which mRNA along with the protein are produced from the DNA model of every gene. Also, the part of every gene presented as mRNA is also known as the genetic structure of this gene. The quantum of mRNA formed in a cell through the process of protein synthesis is defined by genetic level. It is assumed to be related to the quantity of consistent protein produced. Appearance Stages are influenced by a many natural reasons like, temperature, pressure, light, and other symptoms, which causes to hormonal and other changes. It should be known that genetic analysis provides details about mutations in the functioning of active organisms. The assumption of human illness related to certain mutations in genetic expression has produced unlimited concern amongst the Bioinformatics community, in classifying patient models established on genetic names for identification and handling of disease. Recent developments in DNA Microarray introduced the ability to monitor and measure thousands of genes at once in a living organism. Numerous widespread tryouts are performed that include continuous observing every single gene several intervals under various conditions or testing every gene under the same area with various kinds of tissues. The first type is useful for identifying functional-associated genes whereas the second type helps to differentiate between different types of tissues and to identify those genes whose descriptive levels are good diagnostic indicators. Though, most of these genes are not related to the differentiation of samples and have a negative impact on the accuracy of the classifications obtained.
The basic RSA performs exploitation through highly walking in the first half of searching process while the exploration phase is executed through the hunting phase in the second half. Therefore, the algorithm is not able to balance exploration and exploitation, and this behaviour results in trapping in local optima. There are some disadvantages of RSA such as the influence of objective value on the updating mechanism of solution, self-learning mechanism vanish, slow convergence, poor balancing mechanism between exploitation and exploration, and high chance for trapping in local optima. These drawbacks motivated many researchers to enhance the behaviour of RSA.
Contribution of paper is as follows:
To enhance the feature selection method, nature inspired RSA algorithm is proposed as a novel method.
The Algorithm tested on two different Dataset of same field. Result analysis is done by feeding the best features to the different classifier to achieve the optimum solution in cancer diagnosis.
Paper structure is like Introduction and next part describes the algorithm description used in paper. Details of proposed method of mRMR-RSA approach with proposed classifier are given in section 3. After this section, results and experiments done to achieve the best fitness function and better accuracy are shown in tabular and graphical form. In section 5, discussion is done, and paper is concluded in the last section.
Literature Review
Gene expression-based evolutionary and non-evolutionary techniques are mentioned in a survey on cancer categorization. It talks about how difficult it is to collect a small number of samples given the large number of genes. The results of the experiment indicate that the Neuro-Fuzzy method for analyzing the gene expression data from microarray studies is also helpful for the competent computational methodology for microarray data analysis 1, 2. Analysis was carried out on gene expression data sets for liver cancer and also useful for evaluating the superiority of the genes 3. A comparative analysis was presented on various imaging modalities used for detection of cancerous cells in breast imaging 4. A Multiclass Adaptive Neuro-Fuzzy Classifier (MC-NFC) is intended for fault detection and classification in photovoltaic (PV) array 5, 6. Results show the dominance of the MC-NFC over the ANN-classifier 7. The goal of reviewing a variety of clustering algorithms with various techniques and data kinds was to likely identify a solution for the future emergence of several more diseases 8. Gene expression data are classified using a variety of taxonomy approaches, such as classifier SVM, NB, C4.5, and some cutting-edge algorithms 9.
Prototypes of the above method carry out programming along-with the functioning of biological sensory networks. Synthetic neurons remain the basic construction blocks of ANN. At the entrance of a synthetic neuron, the input is measured by the repetition of individual input by weight. In the internal neuron, there exists a functionality that combines all of the input weight and bias. Although, in the release of the neuron a summary of previous weighted contributions and biases is transferred to the activation function. There exists a variety of ANN structures. ANN multilayer preceptor model is proposed in some work. In MLP, the neurons are arranged in several layers as a graph of many categories 10. Each node in each layer receives inputs from the connected area of the preceding layer and calculates the significance of the function and offers involvement of the node associated with succeeding layer. These layers are termed as ‘input layers,’ ‘hidden layers’ and ‘output layers,’ respectively. The central layer with no connections and inputs and outputs is referred to as ‘hidden layers.’ The Neural network is widely used in various other fields such as forecasting, saving forming and medicinal applications. ANN has been used to differentiate cancer from another bioinformatics. Additional resources for ANN models were discussed during the quotes there 11.
SVM is a mathematical learning method that is normally applied to solve setup and planning problems. These technologies solve difficulties without resolving any arbitrary problems. SVM practices the theory of minimizing structural risk to circumvent the similar difficulties of machine learning. SVM dividers test the uppermost dividing plane between the two categories. This hyper plane has many mathematical features. The skills of SVM segments can also be expanded with the kernel trick by making indirect decision margins 12. At the end, audio data complications can be handled using the sagging factor. The Bayesian network is acknowledged as the active phase. This section is made up of a network like assemblies with conventional terms and conditions. This assembly is similar to a direct acyclic graph in which the similarity of each node with the regional variables and edges is consistent with the interdependence between the variables. Therefore, Naïve Bayes is a way to find the right separators of the data file where important agreements are reached 13. Decreased performance is a function of real value input and is a discriminatory measure. Input vector sizes are identified as features or predictions. In retrospect the likelihood of a P dichotomous effect P can be measured by an extension of the Bernoulli trial and may be associated with the inspective event 14. K-Nearest neighbor (KNN) is acknowledged as the maximum useful occurrence-based learners. The work of KNN is centered on the idea that models in an adjacent region may be the same in the same class. KNN assigned samples to a persistent class among neighboring K. K is a perfecting controller algorithm. Separate tree is a method that outlines data in the procedure of an array order per node and the branch has a certain effect on shipping, opportunities and weights. The source of the tree is generally chosen by computing entropy or vice versa, the growth of knowledge. The MSKCC mutation gene interpretation database was used for analyzing with Improved BERT (Bidirectional Encoder Representations from Transformers) model which gives high classification accuracy 15.
Material and Methods
This study presents the work that has been done to demonstrate how different classifier algorithms may be used to effectively classify genes. It has been observed that not all analysis fields have achieved success with any of the classifier techniques. Additionally, the study was conducted using two different kinds of datasets. It has been suggested that data sets, such as Gene Microarray Data, be used to complete the task. Certain methods may achieve up to 98 percent accuracy, however they may not work well with high-dimensional data. Certain algorithms may exhibit good classification accuracy for genes related to colon cancer but may not excel in genes related to breast cancer.
The aim of this work is to select the best classification technique for two types of Data sets. As mentioned in figure 1, the work is carried out by taking different steps including testing and training the algorithm. The Lung Cancer classification process is divided into mainly two steps. Pre-processing of data and then classification with various classifiers is carried out to reduce the dimensionality of the dataset, reduction of the number of features and remove unrelated, unnecessary, or noisy information.
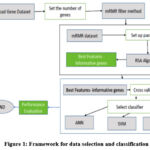 |
Figure 1: Framework for data selection and classification |
For Gene datasets, after reducing the irrelevant attributes from the input dataset, the classification of data is performed by various Classifiers and performance measures is observed and compared at multi-stage cancer detection. The three models of ML used are mentioned as ANN, SVM & Proposed method (mRMR–RSA) respectively, for the best solution for Classification of lung cancer categorization.
Optimal feature generation using RSA
The mRMR stands for Minimum Redundance Maximum Relevance procedure, developed by Ding and Peng 16. The mRMR is a process to methodically accomplish an assortment of variables, attaining a realistic trade-off between relevance and redundancy. The enlarged capacity of medical dataset created high dimensional topography, which impacts negatively on Machine Learning classifiers. In the case of Machine Learning, to select most appropriate feature and release, redundant and irrelevant ones, process of feature selection is essential. The makings of best process exhibit its competence to resolve feature assortment difficulties. Reptile Search Algorithm (RSA) is inspired by nature enhanced process that inspired by alligators encompassing and stalking performance 17. In comparison with other optimization procedures, the exclusive research of the RSA process shows that it attains the most promising outcomes. RSA is a unique optimization process established by Abualigah5. The nature of alligator behavior is mathematically exhibited in the present RSA. Population-based and gradient-free technique is RSA. Hence, to report complex or straight forward optimization glitches RSA is used, which are subjected to constraints. The following sections describe the explanation of different procedures in the RSA are stated as shown in figure 2. RSA is presented as a mathematical building model.
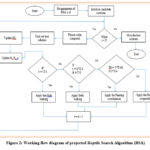 |
Figure 2: Working flow diagram of projected Reptile Search Algorithm (RSA) |
Primary Stage
In reptile Search Algorithm, the optimization procedure begins using a set (Z) of candidate solutions as displayed in Eq. (1).is produced randomly, the best-obtained solution is measured as the closely to the finest in every iteration.

where,
Z = set of candidate attributes produced arbitrarily by using Eq. (1),
Zu,v indicates to the v𝑡h location of the u𝑡h solution,
K= the number of candidate attributes
k= dimensional magnitude of the specified problem
![]()
𝑟𝑎𝑛𝑑=random value, 𝐿L and HL represent to the lesser and higher limit of the assumed problem, correspondingly
Encompassing phase (Inspection)
This sector introduces exploratory behavior of RSA. Rendering to the encompassing behaviour, crocodile has 2 actions throughout the encompassing namely high and belly walking. These actions show two various areas, which promises towards investigation. Due to alligator’s walking actions do not allow them easily to catch the object because of their disruption. Therefore, the encompassing investigation discovers a wide search space. The RSA can handover between encompassing (inspection) and stalking (abuse) review stage. These variations among different behaviours are completely centered on four circumstances. Mathematically, entire number of repetitions are split into four parts. The inspection strategy of Reptile Search Algorithm discovers the exploration area. Under two circumstances searching phase is based. The condition for high walking movement approach is t and for the belly walking movement approach is 𝑡 and t
The proposed position updating equation for inspection phase is presented (3) as stated below.
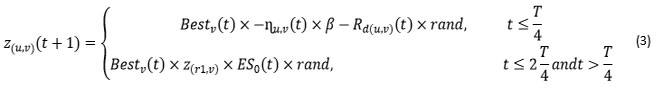
where,
𝐵𝑒𝑠𝑡v(𝑡) =v𝑡h location in the best-obtained solution,
𝑟𝑎𝑛𝑑= random number among 0 and 1,
𝑡= number of the recent reiteration,
𝑇= maximum number of repetitions.
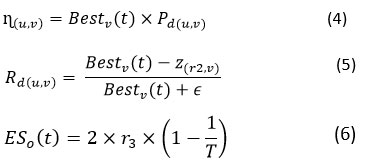
=indicates stalking operator for v𝑡h location in the u𝑡h solution, computed by Eq. (4).
𝛽= sensitive factor, controls inspection exactness for encompassing phase over the course of iterations, which is not fixed. Rd(u,v)= Reduce function, is a value taken to minimize the investigation area, computed by Eq. (5).
𝑟1 = random number among1 to K, (𝑟1) signifies to an arbitrary position of the u𝑡h solution.
K= candidate solutions in terms of number.
𝐸SO (𝑡)= It denotes Evolutionary Sense. 𝐸SO is probability factor taking arbitrarily. During the number of recurrences computed by Eq.(6). Its value is reducing among 2 and ―2.
where,
𝜖= small integer,
𝑟2 = random integer among1 and K. In Eq. (6), 2 taken as a correlation value to generate values among 2 and 0,
𝑟3 = arbitrary integer numeral among −1 and 1.
Pd(𝑖,𝑗) = percentage change among vth location of the best-obtained result and the vth location of the recent result, computed by Eq. (7).
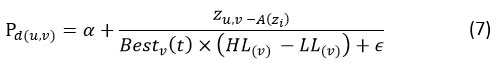
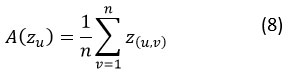
where,
A(Zu) = average positions of the u𝑡h solution, computed with the help of Eq. (8).
HL(v) =higher limit of the v𝑡h position
𝐿L(v) = lower limits of the v𝑡h position
𝛼= sensitive factor, controls inspection accuracy for the stalking cooperation over the sequence of repetitions.
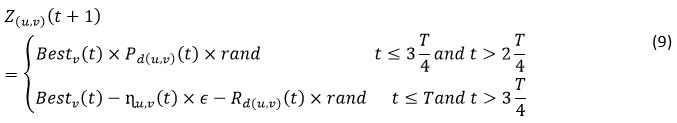
Stalking phase (Manipulation)
This segment explores the stalking performance of the RSA. The manipulation strategy of RSA exploits the examine space mechanism to discover the optimum result centered on two cores examine approaches, stalking synchronization and stalking support are demonstrated as in Eq. (9). In this stage the searching is conditioned as the stalking synchronization approach is stipulations by t ≤ 3 T/4 and t > 2 T/4 and, otherwise, the stalking assistance approach is performed, when t ≤ T and t > 3 T/4. Here, stochastic factors are assumed to produce more compact-attributes and derive the promising areas locally. We implement the utmost candid rule, which can imitate the stalking behaviour of alligators.
Algorithm for Proposed Method
The algorithm of the proposed method has been explained as per the below stages.
Stage1- Optimal feature generation using RSA algorithm.
Starting phase
Set RSA parameters 𝛼, 𝛽, etc.
Set the solutions’ locations arbitrarily. Z:u= 1, ..,N
while (𝑡< T ) do
Compute the Fitness Function for the candidate solutions (Z).
Determine the Best solution.
Upgrade the 𝐸𝑆O by use of Eq. (6).
The commencement of RSA
for (u=1 to K) do
for (v=1 to k) do
Upgrade the 𝜂, 𝑅d and 𝑃d values using Equations (4), (5) and (7), correspondingly.
if (t ≤ T/4) then
Z(u,v) (𝑡 + 1) = 𝐵𝑒𝑠𝑡v(𝑡) × – 𝜂(u,v)(𝑡) × 𝛽– 𝑅d(u,v)(𝑡) × 𝑟𝑎𝑛𝑑, ⊳{High hiking}
else if (𝑡 ≤ 2 T/4 and 𝑡 > T/4 ) then
Z(u,v)(𝑡 + 1) = 𝐵𝑒𝑠𝑡 v(𝑡) × z(𝑟1,v) × 𝐸𝑆O(𝑡) × 𝑟𝑎𝑛𝑑, ⊳{Belly hiking}
else if (𝑡 ≤ 3T/4 and 𝑡 >2T/4 ) then
Z (u,v)(𝑡 +1) = 𝐵𝑒𝑠𝑡 v(𝑡) × 𝑃d (u,v)(𝑡) × 𝑟𝑎𝑛𝑑, ⊳{Stalking synchronization}
else
Z(u,v)(𝑡 + 1) = 𝐵𝑒𝑠𝑡v(𝑡) – 𝜂(u,v)(𝑡) × 𝜖– 𝑅(u,v)(𝑡) × 𝑟𝑎𝑛𝑑, ⊳{Stalking collaboration}
end if
end for
end for
t = t + 1
end while
Send the optimum solution (𝐵𝑒𝑠t(Z)).
Stage2- Classification using different classifiers.
Load the selected Features
Select the classifier for n-class
For cross validation k=5
For i=1 to k
Select function for classifier
Plot confusion Matrix
End
Evaluate the performance of classifier
The below table 1 mentions the parameters used in the algorithm.
Table 1: Parameter
| α | Range 0.05-0.1 |
| β | Range 0.05-0.1 |
| Epoch | 10 |
| K-value | 5 |
| 𝐿L | -1 |
| HL | 1 |
| Total no of iteration | 20 |
Measurement of Classification Performance
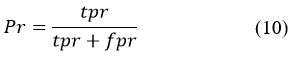
In machine learning, several parameters performs an important role in representing results. The performance revealed by the different classifiers is estimated built on the evaluation metrics, like accuracy, susceptibility, and uniqueness etc. They are helpful in finding out the proficiency of the machine learning prototype performance 18-20. In the Performance Metrics, we have considered True positive (tpr) that correspondent with the correct acceptance, True negative (tnr) that correspondent with correct rejection, False positive (fpr) that correspondent with false alarm and False negative (fnr) that correspondent with miss. Based on the above, the below performance metrics can be computed.
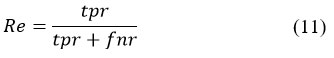
Precision Rate
Accuracy considers all recovered records, but it can also be surveyed at a specific cut-off position, considering only the most notable results returned by the structure. This is known as precision at n. This can be done using the following recipe:
Recall Rate
Review in data recovery is the part of the reports that are significant to the query that are effectively recovered. This can be computed using below formula:
Accuracy
Accuracy is mostly used metric to identify the performance of a model for its precise working however it cannot be a clear indicator for the performance. The results decline with imbalanced classes. Precision is a parameter that provides accurate prediction of the model for true positives. False positives are the cases which are considered incorrectly as positive, but negative. Recall corresponds to the ability to realize all useful occurrences in a dataset, precision expresses the segment of the data in the model for its relevance. It is the measure that specifies the proportion of correctly classified samples. In order to find the accuracy of our models, we will use Classification Accuracy method. Classification Accuracy is what is normally mean, when the term accuracy is used. It is defined as a ratio of correctly predicted to the total number of prediction input samples.
Recognition Accuracy
The recognition accuracy is computed using following formula:
Data availability
The following data sets were used in the proposed algorithm.
Dataset 1 : The TCGA_LAUD Gene dataset was downloaded from website https://lce.biohpc.swmed.edu/lungcancer/datasetsearch.php?datasetid=60. The total number of genes selected is 20549 with 200 samples and testing was done with 30% of data. The rest of the data was used for training purpose.
Dataset2: The datasets was downloaded from the website https://www.kaggle.com/datasets/josemauricioneuro/lung-cancer-patients-mrna-microarray.
The total number of classes were 3 namely Stage 1, Stage 2 and Stage 3 with 23000 numbers of gene expression values.
Results
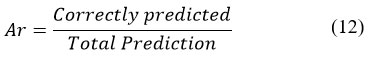
To evaluate the performance of the proposed algorithm, the data is run on all the classifiers namely KNN, SVM and ANN. Number of crocodiles varies from 5-30. The obtained best features were 61 and 21 with respective dataset at α = 0.1 and β = 0.1 with five-fold cross validation. In the next phase, under the proposed algorithm, the same data was run with the mentioned classifier along with the RSA. The result is presented in the below table and represented in the graphical method. The proposed algorithm is applied to the data at all the three stages of cancer. As can be seen in the below table, for KNN with RSA, the performance of the classifier has increased in all the stages. We have seen that with SVM, the results are not attractive. The reason for poor performance could be due to some restrictions related to the data. However, with KNN algorithm, the classifier has shown a remarkable increase in the performance at all the stages. With the available data, we can see that the performance has increased in the range of 6– 24%.
Table 2: Accuracy analysis with proposed method on both Datasets
| Accuracy average value with Proposed Algorithm (mRMR -RSA) with dataset 1 | |||
| No of Genes | KNN | ANN | SVM |
| 5 | 90.33 | 86.04 | 82.6 |
| 10 | 91.91 | 86.63 | 83.05 |
| 15 | 91.79 | 87.78 | 82.6 |
| 20 | 91.62 | 84.55 | 83.38 |
| 25 | 90.26 | 84.11 | 83.28 |
| 30 | 90.85 | 84.05 | 82.83 |
|
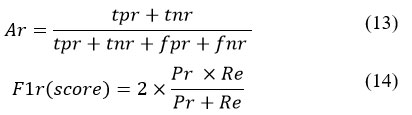
Accuracy average value with Proposed Algorithm (mRMR -RSA) with dataset 2 |
|||
| No of Genes | KNN | ANN | SVM |
| 5 | 88.4 | 87.12 | 87.19 |
| 10 | 89.36 | 87.57 | 87.66 |
| 15 | 91.35 | 86.42 | 88.64 |
| 20 | 90.83 | 86.67 | 88.22 |
| 25 | 90.68 | 86.52 | 88.32 |
| 30 | 90.3 | 87.03 | 88.32 |
 |
Figure 3: Accuracy analysis with proposed method on Dataset – 1 |
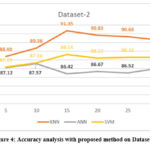 |
Figure 4: Accuracy analysis with proposed method on Dataset – 2 |
For comparison on the performance of the proposed algorithm, the accuracy for an algorithm has been tested on different datasets at various stages with different algorithms and the same is as listed in table 3.
Table 3: Accuracy Comparison between mRMR-RSA and RSA Algorithm with various Classifiers on different Datasets
| Accuracy with KNN on Dataset-1 | |||||||||||||||
| No of Genes | mRMR-RSA | RSA | |||||||||||||
| Stage 1 | Stage 2 | Stage 3 | Stage 1 | Stage 2 | Stage 3 | ||||||||||
| 5 | 87.50 | 91.64 | 91.84 | 87.18 | 89.58 | 90.2 | |||||||||
| 10 | 90.28 | 92.17 | 93.27 | 89.28 | 90.11 | 91.87 | |||||||||
| 15 | 89.94 | 92.17 | 93.27 | 88.01 | 91.22 | 91.52 | |||||||||
| 20 | 89.94 | 91.93 | 92.99 | 89.18 | 90.00 | 89.99 | |||||||||
| 25 | 89.55 | 90.12 | 91.10 | 88.8 | 89.78 | 90.10 | |||||||||
| 30 | 89.55 | 90.27 | 92.74 | 88.38 | 90.01 | 91.78 | |||||||||
| Accuracy with KNN on Dataset-2 | |||||||||||||||
| No of Genes | mRMR-RSA | RSA | |||||||||||||
| Stage 1 | Stage 2 | Stage 3 | Stage 1 | Stage 2 | Stage 3 | ||||||||||
| 5 | 87.92 | 88.02 | 89.26 | 81.85 | 80.99 | 82.10 | |||||||||
| 10 | 88.76 | 89.22 | 90.10 | 80.45 | 80.91 | 83.24 | |||||||||
| 15 | 90.71 | 91.33 | 92.01 | 81.96 | 83.96 | 85.96 | |||||||||
| 20 | 89.92 | 90.56 | 92.01 | 81.56 | 82.61 | 84.71 | |||||||||
| 25 | 89.09 | 91.01 | 91.93 | 82.9 | 81.82 | 84.33 | |||||||||
| 30 | 88.81 | 91.26 | 90.84 | 80.12 | 82.11 | 84.46 | |||||||||
| Accuracy with ANN on Dataset-1 | |||||||||||||||
| No of Genes | mRMR-RSA | RSA | |||||||||||||
| Stage 1 | Stage 2 | Stage 3 | Stage 1 | Stage 2 | Stage 3 | ||||||||||
| 5 | 84.12 | 85.14 | 88.87 | 80.34 | 81.24 | 85.46 | |||||||||
| 10 | 84.50 | 85.78 | 89.62 | 80.23 | 81.32 | 87.86 | |||||||||
| 15 | 85.54 | 87.80 | 90.01 | 81.75 | 83.54 | 89.73 | |||||||||
| 20 | 82.03 | 83.11 | 88.50 | 81.56 | 81.96 | 86.14 | |||||||||
| 25 | 81.10 | 83.11 | 88.12 | 80.17 | 80.01 | 82.13 | |||||||||
| 30 | 81.55 | 83.05 | 87.55 | 80.57 | 79.99 | 81.44 | |||||||||
| Accuracy of ANN on Dataset-2 | |||||||||||||||
| No of Genes | mRMR-RSA | RSA | |||||||||||||
| Stage 1 | Stage 2 | Stage 3 | Stage 1 | Stage 2 | Stage 3 | ||||||||||
| 5 | 85.15 | 87.11 | 89.11 | 79.17 | 82.04 | 84.01 | |||||||||
| 10 | 85.62 | 86.77 | 90.33 | 79.82 | 82.18 | 85.37 | |||||||||
| 15 | 82.56 | 87.63 | 89.06 | 80.56 | 82.36 | 85.42 | |||||||||
| 20 | 82.56 | 85.54 | 91.92 | 80.43 | 81.57 | 85.24 | |||||||||
| 25 | 81.77 | 86.81 | 91.00 | 80.17 | 81.59 | 85.29 | |||||||||
| 30 | 83.86 | 87.01 | 90.23 | 79.54 | 81.70 | 85.39 | |||||||||
| Accuracy of SVM on Dataset-1 | |||||||||||||||
| No of Genes | mRMR-RSA | RSA | |||||||||||||
| Stage 1 | Stage 2 | Stage 3 | Stage 1 | Stage 2 | Stage 3 | ||||||||||
| 5 | 83.72 | 80.48 | 83.6 | 83.92 | 81.73 | 83.95 | |||||||||
| 10 | 84.12 | 81.35 | 83.68 | 84.58 | 81.99 | 83.97 | |||||||||
| 15 | 84.64 | 81.33 | 81.83 | 84.85 | 82.91 | 84.15 | |||||||||
| 20 | 84.51 | 80.84 | 84.81 | 84.81 | 82.91 | 84.06 | |||||||||
| 25 | 84.12 | 80.92 | 84.81 | 84.78 | 81.91 | 84.00 | |||||||||
| 30 | 84.32 | 80.95 | 83.23 | 84.82 | 82.73 | 84.32 | |||||||||
| Accuracy of SVM Dataset-2 | |||||||||||||||
| No of Genes | mRMR-RSA | RSA | |||||||||||||
| Stage 1 | Stage 2 | Stage 3 | Stage 1 | Stage 2 | Stage 3 | ||||||||||
| 5 | 84.91 | 88.12 | 88.55 | 85.01 | 85.5 | 86.72 | |||||||||
| 10 | 85.94 | 88.34 | 88.71 | 85.32 | 85.56 | 86.79 | |||||||||
| 15 | 86.59 | 89.56 | 89.78 | 85.42 | 86.48 | 87.54 | |||||||||
| 20 | 86.47 | 89.48 | 88.71 | 85.43 | 86.51 | 87.49 | |||||||||
| 25 | 86.32 | 88.91 | 89.72 | 85.39 | 86.42 | 87.47 | |||||||||
| 30 | 86.31 | 88.92 | 89.74 | 84.99 | 86.17 | 87.18 | |||||||||
Discussion
The “Dataset 1” and “Dataset 2,” are different sets of data used to test the algorithm. The proposed method shows improvements in accuracy across both datasets, but the magnitude of improvement varies. With Dataset 1, the mRMR-RSA algorithm achieved an accuracy of 90%, compared to 88% with the original RSA. With Dataset 2, the improvement was more substantial, with mRMR-RSA reaching 92% accuracy compared to 84% with RSA. The accuracy range with Dataset 1 improves by 1 to 2%, while for Dataset 2, it improves by 6 to 8%. This suggests that the proposed algorithm performs better on Dataset 2, which could imply that the second dataset is more complex, noisy, or diverse, and the mRMR-RSA algorithm is better suited to handle such challenges.
There is a significant increase in accuracy in detecting cancer at all stages meaning that the proposed algorithm consistently performs better across different stages of cancer detection. This is crucial, as accurate detection at all stages (early, middle, and late) can greatly enhance clinical outcomes by allowing for more precise diagnosis and treatment planning.
The mRMR-RSA algorithm is compared to the original algorithms used for feature selection. It is seen that the mRMR-RSA algorithm outperforms the other algorithm in terms of accuracy. This improvement signifies that the mRMR-RSA algorithm is more effective at selecting the most relevant features (genes) for accurate cancer detection, which ultimately leads to better performance. Overall, mRMR-RSA algorithm is an improvement over the other for cancer detection, offering higher accuracy across different datasets and at different stages of cancer. This indicates that the proposed method is more effective and reliable, making it a promising tool for medical diagnostics in the context of cancer detection.
Conclusion
Feature selection is a key factor for improving the classifiers performance in the classification problem. In this paper, the meta-heuristic algorithm RSA with KNN is used on gene data set which is downloaded from mentioned website for cancer detection. Multiclass classification is done in order to carry out the comparative study of the gene data. Best features are evaluated against three different classifiers. The application of machine learning approach for effective classification of lung tumor disease is essential for operative action. This effort authorizes the application of various classifiers and learning methodologies for its cataloging. Three different Machine Learning methods were used for cataloging gene microarray expression profile data. The various classification performance parameters were used for the purpose of investigation. Validation of the results needs to be passed out by five cross-validation and its one-vs-one method. Prototypes were validated on autonomous data set. The differentiating abilities represented by these three machine learning modes were tested, compared and analyzed. The comparative results on the accuracy of the cancer diagnosis are presented in table 2. Different performance levels are included in table 3. It was found that the highest accuracy and performance increase can be achieved for the downloaded data at all the stages, by using the KNN classifier with RSA algorithm. Based on the finding of the algorithm, it is observed that the use of the KNN classifier with RSA algorithm on the available datasets, results in significantly improved performance in processing lung cancer data, regardless of the stage. This combination helps enhance accuracy, efficiency, and robustness, contributing to better detection, prognosis, and treatment personalization. To conclude we observe that RSA provides the best fitness functions for any type of dataset. For this study it shows better results using gene dataset for lung cancer detection. The scope of the article can be extended for different type of datasets in future.
Acknowledgement
The author would like to express sincere gratitude to the Institute for granting permission to carry out this work and also for providing access to the library and other essential facilities.
Funding Sources
The author(s) received no financial support for the research, authorship, and/or publication of this article.
Conflict of Interest
The author(s) do not have any conflict of interest.
Data Availability Statement
This statement does not apply to this article.
Ethics Statement
This research did not involve human participants, animal subjects, or any material that requires ethical approval.
Informed Consent Statement
This study did not involve human participants, and therefore, informed consent was not required.
Clinical Trial Registration
This research does not involve any clinical trials
Author Contributions
P.G. (Punam Gulande): Conceptualization, Methodology, Writing – Original Draft.
Data collection, Analysis, Visualization.
R.A. (Raval Awale): Writing – Review, Supervision
Reference
- Mudiyanselage T K B, Xiao X, Zhang Y, and Pan Y, Deep Fuzzy Neural Networks for Biomarker Selection for Accurate Cancer Detection, IEEE Transactions on Fuzzy Systems, 2020; 28(12), 3219–3228.
CrossRef - Bhakta R. and Hossain A B M A, Lung Tumor Segmentation and Staging from CT Images Using Fast and Robust Fuzzy C-Means Clustering, International Journal of Image, Graphics and Signal Processing, 2020; 12(1): 38–45.
CrossRef - Parvathavardhini S, Manju S, Cancer Gene Detection Using Neuro Fuzzy Classification Algorithm. International Journal of Scientific Research in Computer Science, Engineering and Information Technology, 2022; 3: 2456.
- Jaglan P, Dass R, and Duhan M, Breast Cancer Detection Techniques: Issues and Challenges, Journal of The Institution of Engineers (India): Series B, 2019; 100(4): 379–386.
CrossRef - Abualigah L, Elaziz M A, Sumari P, Geem Z W, and Gandomi A H, Reptile Search Algorithm (RSA): A nature-inspired meta-heuristic optimizer,” Expert Systems with Applications, 2022; 191: 116158.
CrossRef - Arabi A, Bourouba N, Belaout A, and Ayad M, An accurate classifier based on adaptive neuro-fuzzy and features selection techniques for fault classification in analog circuits, Integration, 2019; 64: 50–59.
CrossRef - Belaout A, Krim F, Mellit A, Talbi B, and Arabi A, Multiclass adaptive neuro-fuzzy classifier and feature selection techniques for photovoltaic array fault detection and classification, Renewable Energy, 2018; 127: 548–558.
CrossRef - Shadi Aljawarneh A, Jaradat R, Abdelsalam M, Maatuk A M and Alhaj A, Gene Profile Classification: A Proposed Solution for Predicting Possible Diseases and Initial Results. International Conference on Engineering & MIS (ICEMIS), 2016; 1-7.
CrossRef - Ayyad S M, Sarah A I, Labib M, Classification Techniques in Gene Expression Microarray Data. Journal of Computer Science and Information Technology, 2018; 7: 52-56.
- Seo H and Cho D H, Cancer-Related Gene Signature Selection Based on Boosted Regression for Multilayer Perceptron, IEEE Access, 2020; 8: 64992–65004.
CrossRef - Dwivedi A K, Artificial neural network model for effective cancer classification using microarray gene expression data, Neural Computing and Applications, 2016; 29(12): 1545–1554.
CrossRef - Firdaus Q, Sigit R, Harsono T, and Anwar A, Lung Cancer Detection Based On CT-Scan Images with Detection Features Using Gray Level Co-Occurrence Matrix (GLCM) and Support Vector Machine (SVM) Methods, International Electronics Symposium (IES). 2020.
CrossRef - Nguyen T, Khosravi A, Creighton D, & Nahavandi S, “Hidden Markov models for cancer classification using gene expression profiles.” Information Sciences, 2015; 316: 293-307.
CrossRef - Das A, Acharya U R, Panda S S, and Sabut S, Deep learning-based liver cancer detection using watershed transform and Gaussian mixture model techniques, Cognitive Systems Research, 2019; 54: 165–175.
CrossRef - Su Y, Application of BERT to Enable Gene Classification Based on Clinical Evidence, BioMed Research International, 2020: 1–13.
CrossRef - Ding C and Peng H, Minimum Redundancy Feature Selection from Microarray Gene Expression Data. Journal of Bioinformatics and Computational Biology, 2019; 3: 185-205.
CrossRef - Al-Shourbaji I, Kachare P H, Alshathri S, Duraibi S, Elnaim B, and Elaziz M A, An Efficient Parallel Reptile Search Algorithm and Snake Optimizer Approach for Feature Selection. Mathematics, 2022; 10(13): 2351.
CrossRef - Hasan R, Shafi A S M. Feature Selection based Breast Cancer Prediction. International Journal of Image, Graphics and Signal Processing (IJIGSP), 2023; 2: 1-12.
CrossRef - Prabhakar S K and Lee S W, Transformation Based Tri-Level Feature Selection Approach Using Wavelets and Swarm Computing for Prostate Cancer Classification, IEEE Access, 2020; 8: 127462–127476.
CrossRef - Abualigah, Laith, and Ali Diabat. “Chaotic binary reptile search algorithm and its feature selection applications.” Journal of Ambient Intelligence and Humanized Computing14, no. 10 (2023): 13931-13947.
CrossRef

