Umamaheswari Duraisamy* and Priya Dharshini Muthukumar
Department of Pharmaceutical Analysis, Vinayaka Mission’s College of Pharmacy, VMRF (DU), Salem, India.
Corresponding Author E-mail: Umapharm1@gmail.com
DOI : https://dx.doi.org/10.13005/bpj/3047
Abstract
This work focuses on the use of high-performance liquid chromatography (HPLC) for the quantitative analysis and validation of propylthiouracil tablets through reverse phase chromatography (HPLC- RP). The analysis was optimised using a C18 column with a mobile phase that includes acetonitrile and buffer in a ratio of 20:80 (v/v). The buffer is made from monobasic potassium phosphate with a pH of 4.6 ± 0.05. The detection of propylthiouracil was performed at λ = 272 nm. Samples were extracted using methanol and water. The newly developed method exhibited good linearity between 24.916 and 74.748 µg/mL, with an R2 > 0.999. Precision expressed in terms of % relative standard deviation (RSD) was within the acceptable range, whereas accuracy in terms of % recovery varied between 98-102%. Therefore, the proposed and validated HPLC-RP method is reliable for the quantitative analysis of propylthiouracil in pharmaceutical formulations, ensuring accurate dosage determination and quality control. The technique shows promising potential for pharmacokinetic studies and routine quality assurance in the pharmaceutical industry.
Keywords
High- performance liquid chromatography; Pharmaceutical formulation; Propylthiouracil tablets; Quantitative analysis; validation RP-HPLC
Download this article as:| Copy the following to cite this article: Duraisamy U, Muthukumar P. D. Innovative RP-HPLC Technique for Method Development and Validation of Propylthiouracil Tablets. Biomed Pharmacol J 2024;17(4). |
| Copy the following to cite this URL: Duraisamy U, Muthukumar P. D. Innovative RP-HPLC Technique for Method Development and Validation of Propylthiouracil Tablets. Biomed Pharmacol J 2024;17(4). Available from: https://bit.ly/3NQAcF7 |
Introduction
The pharmaceutical industry represents companies that manufacture morale and medication over the counter. Pharmaceutical research focuses on the discovery and development of pharmaceutical agents for administration⎯ whether self-administered by patients or provided by healthcare professionals⎯ for treatment, protection, or prevention. As the field advances, innovative and skilled formulations are being introduced to the market. Although some dosage forms may be susceptible to contamination, many are highly effective. Such developments require precise, easy-to-use, and flexible chemical analysis techniques due to the significance of quality control in pharmaceuticals. Unlike other consumer goods, medicines must adhere to strict standards because they directly affect human health. Ensuring quality requires a dedicated department for quality control and assurance [1]. The medication does not reduce the efficiency of oral or injectable thyroid Propylthiouracil is useful in treating hyperthyroidism because it prevents the production of thyroid hormone treatments, nor does it neutralize the thyroxine or triiodothyronine present in the bloodstream. Propylthiouracil works by inhibiting the conversion of thyroxine to triiodothyronine in peripheral tissues, making it a possible option for managing thyroid storm. The drug is rapidly absorbed and extensively metabolized. Within 24 hours, approximately 35% of the medication is excreted in the urine, both in its intact and conjugated forms [2]. The primary goal of analytical chromatography is to obtain target analytes with a sufficient resolution in the shortest possible time. The solutes diffuse slowly in and out of the tiny pores in the nonporous particles, which eliminates the stagnant mobile phase in the intra-particle void volume [3]. Validation refers to assessing validity and efficiency. The validation group consists of individuals from various regulations. Validation is the process of providing written proof that ensures the product meets the standards for analysis applications [4].
This article presents the systematic approach taken in the quantitative analysis for the validation of propylthiouracil tablets by using reverse phase HPLC. The study elaborates on the criteria applied for selecting methods, optimization performed for chromatographic conditions, parameters checked during the validation process, and analysis of real-world samples. This research will furnish detailed information at each step involved in development and validation to act as a comprehensive guide for analysts and researchers working in the pharmaceutical field.
Materials and Methods
Chemicals and Reagents Used
All chemicals used in the analysis should be either AR grade or an equivalent grade; solvents should be HPLC grade or equivalent. Monobasic potassium phosphate, sodium hydroxide, orthophosphoric acid, acetonitrile, methanol, and HPLC-grade milliQ water.
Working Standard and Sample Used
Propylthiouracil standard, Propylthiouracil 50 mg tablets, and Placebo for propylthiouracil 50 mg tablets were given by Bio Plus Life Science Pvt Ltd., Hosur, Tamil Nadu, India.
Instruments Used
Analytical and precision balance from Denver Instrument, HPLC with openlab software from Agilent 1200 and Agilent 1260 Infinity II, ultrasonicator from PCI Analytics, and pH meter from Weibfr.
Preparation of Solution 5, 6:
Preparation of Buffer
In a 1000 mL beaker, 3.4 g of monobasic potassium phosphate was added with 500 mL of water and then sonicated to dissolve. After adjusting to a pH of 4.6± 0.05. A 0.1 N of sodium hydroxide or diluted phosphoric acid was added with 500 mL of water. A pH of 4.6± 0.05 was achieved by adding 0.1 N of sodium hydroxide or diluted phosphoric acid to the resultant solution. A 0.45µ membrane filter was used to filter this mixture, then degassed.
Mobile Phase Preparation
In a ratio of 20:80 (v/v), a suitable amount of degassed acetonitrile and buffer were prepared.
Preparation of Diluent
Use 1% methanol in water as diluent.
Standard Preparation
About 50 mg of the working standard for propylthiouracil was accurately weighed and transferred into a 50 mLdry volumetric flask. Then, 10 mL of methanol was added, sonicated to dissolve it, and water was added to fill the flask to the recommended volume. A 5 mL of this solution was diluted to 100 mL with water and mixed.
Sample Preparation
A minimum of 20 tablets was weighed to determine the averageweight. The tablets should be crushed into a fine powder. The powder weight was taken and added to a 100 mL clean, dry flask. Next, 20 mL of methanol was added and sonicated for 5 minutes. After that, 50 mL of water was added and sonicated for 15 minutes with intermittent shaking. The mixture was cooled and made up the volume with water. Using a 4.5µ membrane filter (PVDF), the mixture was filtered. The first 4 mL of the filtrate was discarded. Further, 5 mL of the solution was diluted to 1000 mL with water and mixed.
Preparation of Placebo
A 100 mg equivalent of propylthiouracil placebo powder was accurately weighted and transferred into a 100 mL clean, dry volumetric flask, methanol (20 mL) was added and sonicated for 5 minutes, and then 50 mL of water was added, sonicated for 15 minutes, cooled, and made up to the flask water and mixed. Using a 0.45µ membrane filter (PVDF)for filtration. Further, 5 mL of the solution was diluted to 100 mL with water and mixed.
Calculation for % Assay
Calculation of the percentage assay for propylthiouracil by using the following formula.
|
% Assay |
= |
AT |
X |
Ws |
X |
5 |
X |
100 |
X |
100 |
X |
P |
X |
Aw |
X |
100 |
|
As |
50 |
100 |
WT |
5 |
100 |
L |
Where,
AT = Average area of propylthiouracil peak in the chromatogram of sample solution
As = Average area of propylthiouracil peak in the chromatogram of standard solution, as obtain under system suitability.
Ws = Weight of working standard taken in mg
P = Percent potency of working standard used (as is basis)
WT = Weight of sample in mg
AW = Average weight in mg
L = Label claim in mg
Results and Discussion
Method Validation 7-13
Specificity
Blank, placebo, standard, control test solution, spiked test solution, and individual impurity solution related to propylthiouracil were prepared and analysed as per the method. The chromatograms show there is no interference from the blank, placebo and the known impurity with a retention time of peak due to propylthiouracil. Results are shown in Tables 1-4.
Table 1: results obtained from standard, control and spiked test solution
|
Sample ID |
Retention Time of Propylthiouracil peak ( in minutes) |
|
Standard solution |
2.760 |
|
Test solution (Control) |
2.753 |
|
Spiked test solution |
2.753 |
Table 2: Results obtained from individual impurities solution
|
Impurity Name |
Retention time (minutes) |
|
Thiourea Impurity |
Not Detected in 272 nm |
|
Thiourea Impurity |
238 nm RT-1.18 |
Table 3: Results obtained from control and spiked test solution
|
Sample |
(% Assay) |
Absolute difference in % Assay values |
|
Test solution (Control) |
98.2 |
0.2 |
|
Spiked test solution |
98.4 |
Table 4: Results obtained for peak purity of Propylthiouracil
|
Sample ID |
Purity factor |
Result |
|
Blank solution |
within the threshold limit |
Pass |
|
Placebo solution |
within the threshold limit |
Pass |
|
Standard solution |
within the threshold limit |
Pass |
|
Test solution (Control) |
within the threshold limit |
Pass |
|
Spiked test solution |
within the threshold limit |
Pass |
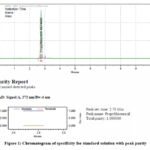 |
Figure 1: Chromatogram of specificity for standard solution with peak purity |
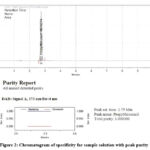 |
Figure 2: Chromatogram of specificity for sample solution with peak purity |
Forced degradation study
Forced degradation study in propylthiouracil 50 mg tablets and its placebo. No peak was detected at the retention time of propylthiouracil in the chromatogram of diluent and placebo. Forced degradation studies are shown in Table 5.
Table 5: Forced degradation of Propylthiouracil 50mg tablets results below
|
Mode of degradation |
Condition |
% Assay |
% Degradation |
|
Control sample |
Not applicable |
100.6 |
NA |
|
Acid degradation |
5mL of 5N HCl, at 80°C for 60 minutes |
97.7 |
2.9 |
|
Base degradation |
5mL of 5N NaOH, at 80°C for 60 minutes |
91.6 |
9.0 |
|
Photolytic degradation |
1.2million lux hours/200watt hours square meter |
98.4 |
2.2 |
|
Thermal degradation |
3 days at 105 °C |
100.9 |
No degradation |
|
Control sample |
Not applicable |
100.2 |
NA |
|
Oxidation degradation |
5 mL of 5% v/v H2O2,bench top for 30 minutes |
93.1 |
7.1 |
Filter Study
Using the analysis method as an outline, standard and sample solutions are prepared. 0.45µm Nylon and 0.45µm PVDF filters were used to filter the standard solution as well as the sample solution. By discarding 2 mL, 4 mL, and 6 mL of the solution after it has passed through the previous filter, three sub-fractions will be gathered. Unfiltered standard solution is used as the standard. Results obtained by using different syringe filters and unfiltered standard solutions are summarised in Tables 6 and 7.
Table 6: Results obtained from filter saturation study for standard solution
|
S.No |
Filter size and type |
Quantity Discarded in ml |
Average Area |
Absolute % difference |
|
1 |
Unfiltered standard solution |
NA |
5733363 |
NA |
|
2 |
0.45 µm Nylon |
2 ml |
5723530 |
0.2 |
|
4 ml |
5719118 |
0.2 |
||
|
6 ml |
5720648 |
0.2 |
||
|
3 |
0.45 µm PVDF |
2 ml |
5729777 |
0.1 |
|
4 ml |
5734088 |
0.0 |
||
|
6 ml |
5731705 |
0.0 |
Table 7: Results obtained from filter saturation study for sample solution
|
S.No |
Filter size and type |
Quantity Discarded in ml |
Average Area |
Assay % |
Absolute % difference |
|
1 |
Unfiltered sample solution |
NA |
5651723 |
99.0 |
NA |
|
2 |
0.45 µm Nylon |
2 ml |
5658626 |
99.1 |
0.1 |
|
4 ml |
5652407 |
99.0 |
0.0 |
||
|
6 ml |
5682430 |
99.6 |
0.6 |
||
|
3 |
0.45 µm PVDF |
2 ml |
5660532 |
99.2 |
0.2 |
|
4 ml |
5667759 |
99.3 |
0.3 |
||
|
6 ml |
5661367 |
99.2 |
0.2 |
Solution Stability
Standard Solution Stability
According to the test protocol, a standard solution was prepared and stored at room temperature (23°C- 27°C). The study of the stability of the solution on various days when compared to freshly made standard solution is necessary. The results are shown in Table 8.
Table 8: Results of standard solution stability at 23°C-27°C
|
Interval |
Standard solution stability at 23°C-27°C |
|
|
Average Area |
Similarity factor |
|
|
Initial |
5728333 |
0.99 |
|
24 hours |
5719319 |
0.98 |
|
48 hours |
5714535 |
0.99 |
Sample solution stability
According to the test method, the sample solution was prepared and stored at room temperature (23°C- 27°C). The study of the stability of the solution at various days when compared to a freshly made standard solution is necessary. The results are shown in Table 9.
Table 9: Results of sample solution stability at (23- 27) °C
|
Interval |
Sample solution stability at 23°C-27°C |
||
|
Average Area |
% Assay |
Absolute % difference |
|
|
Initial |
5703944 |
99.9 |
Not Applicable |
|
24 hours |
5648200 |
98.4 |
1.5 |
|
48 hours |
5648391 |
98.2 |
1.7 |
Linearity
A serious number of solutions containing propylthiouracil at concentrations listed below were analysed to determine the linearity of the method. The response of linearity for propylthiouracil is determined from the range of 24.916 µg/ml to 74.748 µg/ml. Results are illustrated in Table 10 and the corresponding Figure 3- 8.
Table 10: Results obtained for linearity
|
Linearity Solution No |
Level |
Concentration (µg/mL) |
Average Area of Propylthiouracil |
|
1 |
50% |
24.916 |
2765964 |
|
2 |
75% |
37.374 |
4110765 |
|
3 |
100% |
49.832 |
5441493 |
|
4 |
125% |
62.290 |
6828044 |
|
5 |
150% |
74.748 |
8171130 |
|
Slope |
108585.7361 |
||
|
Intercept |
52434.80000 |
||
|
Correlation coefficient (r) |
0.99998 |
||
|
% Deviation of Y-Intercept |
0.96 |
||
|
Regression co-efficient (r2) |
0.99996 |
||
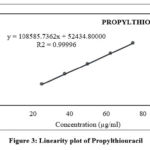 |
Figure 3: Linearity plot of Propylthiouracil |
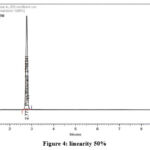 |
Figure 4: linearity 50% |
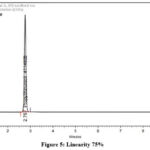 |
Figure 5: Linearity 75% |
 |
Figure 6: Linearity 100% |
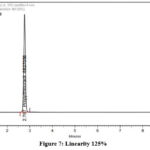 |
Figure 7: Linearity 125% |
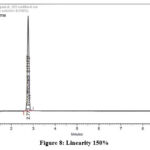 |
Figure 8: Linearity 150% |
Accuracy
The accuracy is determined by examining the solutions of placebo spiked with propylthiouracil active pharmaceutical ingredient (API) at three different levels of concentrations in triplicate. The solutions were prepared and analysed as per the method. % recovery results are shown on Table 11 and corresponding Figure 9-11.
Table 11: Results obtained for Propylthiouracil 50mg tablets (% Recovery)
|
Accuracy Level |
Trails |
Amount of Propylthiouracil added (mg) |
Amount of Propylthiouracil found (mg) |
% Recovery |
% Mean Recovery |
% RSD |
|
50 % |
1 |
50.86 |
50.813 |
99.9 |
100.2 |
0.3 |
|
2 |
50.09 |
50.353 |
100.5 |
|||
|
3 |
50.24 |
50.356 |
100.2 |
|||
|
100% |
1 |
100.55 |
100.558 |
100.0 |
100.1 |
0.2 |
|
2 |
100.75 |
100.617 |
99.9 |
|||
|
3 |
100.49 |
100.811 |
100.3 |
|||
|
150% |
1 |
150.30 |
149.693 |
99.6 |
99.6 |
0.2 |
|
2 |
150.12 |
149.242 |
99.4 |
|||
|
3 |
150.49 |
150.216 |
99.8 |
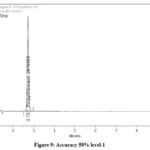 |
Figure 9: Accuracy 50% level-1 |
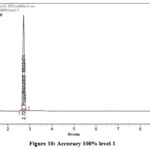 |
Figure 10: Accuracy 100% level-1 |
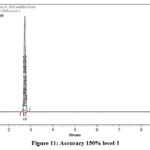 |
Figure 11: Accuracy 150% level-1 |
Precision
Repeatability of standard solution- System precision
Repeatability solution -1 was injected into the chromatographic system five times in replicates. Results are summarised in Table 12.
Table 12: Results obtained for five replicate injections of standard solution
|
System Precision |
Area of Propylthiouracil |
|
1 |
5762988 |
|
2 |
5763640 |
|
3 |
5761356 |
|
4 |
5764861 |
|
5 |
5781881 |
|
Mean |
5766945 |
|
%RSD |
0.1 |
Reproducibility of sample solution- Method precision
Six test solutions of a single batch were analysed as per the proposed methodology and the results as given in Table 13.
Table 13: Results obtained from six sample preparation from Method precision -Assay: Analyst 1
|
Method Precision |
Propylthiouracil % assay |
|
1 |
99.8 |
|
2 |
99.9 |
|
3 |
100.0 |
|
4 |
99.1 |
|
5 |
99.0 |
|
6 |
98.6 |
|
Mean |
99.4 |
|
%RSD |
0.6 |
Intermediate precision – Ruggedness
By comparing the analysis of the propylthiouracil 50 mg tablet samples conducted on different days by different analysts using different instruments and columns, the robustness of the method was verified. The outcomes of Analyst 2’s examination of the sample solution are displayed in Table 14. Table 15 shows the mean, standard deviation, and percentage RSD for the two sets of data.
Table 14: Results obtained from six sample preparation of intermediate precision -Assay: Analyst 2
|
Intermediate Precision |
% Assay |
|
1 |
98.8 |
|
2 |
99.1 |
|
3 |
98.3 |
|
4 |
98.7 |
|
5 |
99.0 |
|
6 |
100.2 |
|
Mean |
99.0 |
|
%RSD |
0.6 |
Table 15: Overall compilations of method precision and intermediate precision: Assay
|
Sample Number |
% Assay |
|
|
Method Precision |
Intermediate precision |
|
|
1 |
99.8 |
98.8 |
|
2 |
99.9 |
99.1 |
|
3 |
100.0 |
98.3 |
|
4 |
99.1 |
98.7 |
|
5 |
99.0 |
99.0 |
|
6 |
98.6 |
100.1 |
|
Mean |
99.4 |
99.0 |
|
(%)RSD |
0.6 |
0.6 |
|
Overall mean |
99.2 |
|
|
Overall RSD (%) |
0.6 |
|
Robustness
By verifying that the system suitability parameters were met and deliberately changing variables such as flow rate, organic content of the mobile phase composition, pH variation and detection wavelength, the procedure’s robustness was tested. Every condition was examined for a sample solution. Propylthiouracil assay percentage and system suitability were determined. Altered parameters from an optimised method for the robustness of the assay and results are tabulated from Tables 16 and 18.
Table 16: Altered parameters from optimized method for robustness of assay
|
S. No. |
Parameter |
Actual Method |
Lower |
Higher |
|
1 |
Flow rate ± 0.1 mL/min |
1.0 mL/min |
0.9 mL/min |
1.1 mL/min |
|
2 |
Wavelength ± 2 nm |
272 nm |
270 nm |
274 nm |
|
3 |
Buffer pH ± 0.1 |
4.6 |
4.5 |
4.7 |
|
4 |
Mobile phase organic ± 2% |
ACN: buffer (200:800) |
ACN: buffer (196:804) |
ACN: buffer (204:796) |
Effect of variation in flow rate, organic variation and wavelength variation:
Table 17: System suitability for flow rate variation, organic variation and wavelength variation
|
Flow Variations |
%RSD |
Column Efficiency |
Tailing factor |
% Recovery |
% Assay |
Absolute % Difference |
|
Unchanged (1.0 mL/min) |
0.2 |
73186 |
1.0 |
100.2 |
98.8 |
NA |
|
High Flow rate 1.1 mL/min |
0.2 |
63286 |
1.0 |
100.3 |
98.2 |
0.6 |
|
Low Flow rate 0.9 mL/min |
0.1 |
74076 |
1.0 |
100.2 |
98.3 |
0.5 |
|
High M.P organic (+2%) |
0.0 |
71688 |
1.0 |
100.5 |
98.4 |
0.4 |
|
Low M.P organic (- 2%) |
0.1 |
70992 |
1.0 |
100.4 |
98.2 |
0.6 |
|
High Wavelength (274nm) |
0.1 |
73350 |
1.0 |
100.2 |
98.3 |
0.5 |
|
Low Wavelength (270nm) |
0.2 |
73029 |
1.0 |
100.2 |
98.2 |
0.6 |
Effect of variation in buffer pH
Table 18: System suitability from variation in buffer pH
|
Variations |
%RSD |
Column Efficiency |
Tailing factor |
% Recovery |
% Assay |
Absolute % Difference |
|
Unchanged (pH 4.6) |
0.1 |
67533 |
1.0 |
100.6 |
98.4 |
NA |
|
High pH (pH 4.7) |
0.1 |
73033 |
1.0 |
100.5 |
98.4 |
0.0 |
|
Low pH (pH 4.5) |
0.1 |
66959 |
1.0 |
100.5 |
98.3 |
0.1 |
System Suitability
During the validation investigation, a standard solution was injected on various days. The propylthiouracil peak was calculated from a standard solution using system suitability software. Using standard solution-1, the percentage RSD of the area ratio of the five replicate injections for the propylthiouracil peak was determined. % similarity factor calculated from standard solution-2 against standard solution-1. Data is shown in Table 18. A typical set of system suitability chromatograms is shown in the appendix.
Table 19: System suitability observed on different days
|
Parameters |
%RSD |
Asymmetry factor |
Plate count |
% Recovery |
|
Specificity |
0.1 |
1.0 |
68693 |
100.3 |
|
Forced degradation |
0.1 |
1.0 |
69139 |
101.1 |
|
Method precision and Filter study |
0.1 |
1.1 |
65511 |
98.1 |
|
Linearity |
0.2 |
1.0 |
67151 |
99.4 |
|
Accuracy |
0.2 |
1.0 |
65918 |
101.2 |
|
Intermediate Precision |
0.1 |
1.1 |
61400 |
100.5 |
|
Robustness |
0.2 |
1.0 |
73186 |
100.2 |
Discussion
The absolute difference between the % assay of spiked and un-spiked samples meets the acceptance criteria, and the peak purity plot of propylthiouracil peak from standard, control and spiked test solutions shows that the peak is homogenous and no co-eluting peaks are seen in specificity. The peak purity plot of the propylthiouracil peak from degradation sample solutions indicates that the results are within the threshold limits. Based on the above data, a 0.45µm PVDF filter is suitable for standard and sample preparation, and discard the 4 ml of filtrate. The standard and sample solutions are stable up to 48 hours at ambient temperature (23°C-27°C). The data response in linear throughout the working range. The method’s acceptable recovery level is between 50% and 150% of the sample concentration. The method’s precision is of acceptance level. Robustness indicates that the method is robust. All validation parameters were met in terms of system suitability, meeting the predetermined acceptance criteria.
Conclusion
A novel simple and sensitive reversed-phase HPLC isocratic method has been developed and validated for the assay of propylthiouracil tablets. The method was found to be linear (R2) is 0.999 within the analytical range of 24.916 µg/mL to 4.748 µg/mL. The results demonstrated that the method was both accurate and reproducible. Therefore, the developed chromatographic method can be used for estimation of propylthiouracil tablets.
Acknowledgment
The analytical R&D department of BioPlus Life Sciences Pvt Ltd, Hosur, Tamil Nadu, India, provided support for the conducted experiment. The author expresses gratitude to Vinayaka Mission’s College of Pharmacy Principal, Prof. Dr. Kumar M., at VMRF(DU), Salem. Furthermore, I would like to express my gratitude to everyone who assisted and encouraged the research, particularly for the authorship.
Funding Sources
The author(s) received no financial support for the research, authorship, and/or publication of this article
Conflict of Interest
The author(s) do not have any conflict of interest
Data Availability Statement
This statement does not apply to this article
Ethics Statement
This research did not involve human participants, animal subjects, or any material that requires ethical approval.
Informed Consent Statement
This study did not involve human participants, and therefore, informed consent was not required.
Clinical Trial Registration
This research does not involve any clinical trials
Author’s Contribution
The study was designed by Umamaheshwari D, who also headed the study’s analyses and literature searches, wrote the protocol, carried out the statistical analysis, and wrote the first draft of the manuscript. The final manuscript was read and approved by all authors.
References
- Sabhyatha T. S, Narayana babu. Analytical method validation of gliclazide related substances by high performance liquid chromatography method. Int J Curr Pharm Res., 2022;14(4): 36-41
CrossRef - https://www.accessdata.fda.gov/drugsatfda_docs/label/2016/006188s025lbl.pdf
- Ali A.H. High-Performance Liquid Chromatography (HPLC): A review. Ann Adv Chem., 2022; 6: 010-020.
CrossRef - Suyash Gupta. A review on novel analytical method development and validation by RP-HPLC method. Indian journal of forensic medicine & toxicology., 2021;15(4).
CrossRef - Özge Göktuğ Temiz et.,al High Performance Liquid Chromatography Method Development and Validation for Separation of Liothyronine Sodium Related Substances Using a Quality by Design Approach, 10.36347/sajp.2023.v12i02.002.
- Bhati C., Minocha N., Purohit D., Kumar S., Makhija M., Saini S., Kaushik D., Pandey P. High Performance Liquid Chromatography: Recent Patents and Advancement. Biomed Pharmacol J., 2022; 15(2).
CrossRef - Mahgoub SM, Mahmoud MR, Binsaleh AY, Almalki MA, Mohamed MA, Nassar HF. Analytical assessment of a novel RP-HPLC method for the concurrent quantification of selected pharmaceutical drugs levodopa and carbidopa using eight greenness metrics comparing to the lean six sigma approach. Sustainable Chemistry and Pharmacy., 2023; 36: 101291.
CrossRef - Li M, He Q, Yao L, Wang X, Tang Z, Zhu X, Lin HS, Xiang X. Simultaneous quantification of propylthiouracil and its N-β-d glucuronide by HPLC-MS/MS: Application to a metabolic study. Pharmaceuticals., 2021;14(11):1194.
CrossRef - Finšgar M, Perva-Uzunalić A, Behr H, Ledinek N, Knez Z, Novak Z. An improved reversed-phase high-performance liquid chromatography method for the analysis of related substances of prednisolone in active ingredient. ACS omega., 2020; 5(14): 7987-8000.
CrossRef - Sharma M, Koty A. Determination of antithyroid drug propylthiouracil with ru (iii) in pharmaceutical formulations and its characterization. Current pharmaceutical analysis., 2023; 19(5): 413-22.
CrossRef - Bansode MR, Hingane LD, Rathi GM. Development and validation of RP-HPLC method for estimation of anti-hypothyroidism drug in capsule dosage form. World Journal of Biology Pharmacy and Health Sciences., 2023; 15(1): 185-98.
CrossRef - Mangla B, Beg S, Alam O, Ahsan W, Haque A, Patel KS, Almalki WH, Alrobaian M, Kohli K. Systematic development and validation of RP-HPLC method for simultaneous estimation of tamoxifen and sulphoraphane with specific application for nanolipidic formulations. Arabian Journal of Chemistry., 2020 ;13(11):7909-20.
CrossRef - Chauhan V, Grover P, Bhardwaj M, Kumar S, Nagarajan K. Development and Validation of Fast and Sensitive RP-HPLC Stability-Indicating Method for Quantification of Piroxicam in Bulk Drug. Journal of Chromatographic Science., 2024: bmae021.
CrossRef


