Asaad Babker1* , Anass Abbas2
 , Manar Shalabi 2
 , Khalid Abdelsamea Mohamedahmed3
  and Vyacheslav Lyashenko4
1Department of Medical Laboratory Sciences, College of Health Sciences, Gulf Medical University, Ajman, UAE.
2Department of Clinical Laboratory Sciences, College of Applied Medical Sciences, Jouf University, Saudi Arabia.
3Department of Hematology and Immunohematology, Faculty of Medical Laboratory Sciences, University of Gezira, Wad Medani, Sudan.
4Department of Media Systems and Technology, Kharkiv National University of Radio Electronics, Kharkiv, Ukraine.
Corresponding Author E-mail:azad.88@hotmail.com
DOI : https://dx.doi.org/10.13005/bpj/3023
Abstract
Medical imaging and digital image analysis are essential tools in diagnosing and detecting various diseases. One key application is the examination of blood smears, where specific cell types, such as those indicative of megaloblastic anemia, can be identified. A critical component of this process involves analyzing and studying relevant images, as well as conducting experiments to evaluate the effectiveness of different methods and approaches in addressing this diagnostic challenge. As a result of the comparative analysis, it was found that the most effective method for the purpose of isolating the edge with megaloblastic anemia cells is the approach based on the wavelet ideology. This approach has the best indicators of assessing the quality of the resulting images in comparison with other edge detection methods. In some cases, the value of such indicators exceeds similar values for other methods by more than 2 times. In some cases, the indicators for images after contrasting are higher than without contrasting. This is also typical for other approaches to edge detection in images with megaloblastic anemia cells. First, this is typical for images with a uniform background and the absence of multiple peaks in the histogram of the input image brightness distribution. In general, the issue of contrasting the original image for subsequent processing in order to detect edge remains open. At the same time, this study provides an answer to the most effective method for edge detection for images with megaloblastic anemia cells, using the original images contrasting procedure.
Keywords
Blood Smear; Comparative Analysis; Health Risks; Image Processing; Medical Image; Megaloblastic Anemia
Download this article as:| Copy the following to cite this article: Babker A, Abbas A, Shalabi M, Mohamedahmed K. A, Lyashenko V. Edge Detection and Contrast Enhancement in the Examination of Megaloblastic Anemia Cells in Medical Images with Comparative Analysis of Different Approaches. Biomed Pharmacol J 2024;17(4). |
| Copy the following to cite this URL: Babker A, Abbas A, Shalabi M, Mohamedahmed K. A, Lyashenko V. Edge Detection and Contrast Enhancement in the Examination of Megaloblastic Anemia Cells in Medical Images with Comparative Analysis of Different Approaches. Biomed Pharmacol J 2024;17(4). Available from: https://bit.ly/4eY7wWo |
Introduction
Megaloblastic anemia is one of the diseases types that are largely identified through a comprehensive blood test 1, 2. The disease is characterized by a low level of hemoglobin in the blood, which is associated with a deficiency of vitamin B12 and/or folic acid in the body. This disease is also characterized by the presence of enlarged red blood cells and hyper segmented neutrophils, which is important for the analysis and diagnosis of the corresponding disease using separate laboratory methods.
Symptoms of megaloblastic anemia include: fatigue, shortness of breath, weakness, dizziness, chest pain 3, 4. As a consequence, megaloblastic anemia contributes to the development of fatigue and hair loss 5, 6. Its more serious manifestation is the development of heart failure, the possibility of oncological diseases,7, 8. Also Folate and vitamin B12 deficiencies have been linked to recurrent pregnancy loss (RPL), affecting a woman’s ability to carry a pregnancy to term9. This disease is quite common and, according to WHO estimates, at least 25% of the population is susceptible to it 10. The greatest manifestation of the disease is typical for preschool-age children10. Therefore, diagnosis and early detection of anemia is an important step in the process of its subsequent treatment.
Diagnosis and in particular the diagnosis of megaloblastic anemia are an important element in determining the disease phase and its treatment. Here you can use various analysis and diagnostic tools. Among these tools, due to several factors, it is necessary to highlight the analysis of a blood smear to detect enlarged red blood cells or abnormal neutrophils. For these purposes, digital image analysis methods are used, which is reflected in various types of research 11-15. Also, similar studies are used considering the megaloblastic anemia analysis and its study.
The complexity of the corresponding analysis lies in the presence of a transitions set inside the megaloblastic anemia cell, determining its structural features 16, 17. Therefore, one of the stages of such analysis is the original image preliminary processing methods. For example, H. M. Chen, Y. T. Tsao and S. C. Tsai emphasize the labor intensity of solving such a problem and talk about the need to use methods for removing background and noise 18. However, this is difficult to do without losing the quality of the processed image visualization. At the same time, as noted by Abdulhay, E. W., Allow, A. G., & Al-Jalouly, M. E., the problem solving requires the presence of related samples with high visualization resolution 19. In real conditions, it is necessary to work with existing source images. Therefore, an important aspect of such a research procedure application is to consider various aspects of the corresponding analysis. In the work of T. K. Yıldız, N. Yurtay and B. Öneç, it is directly stated that correct diagnosis is important from the point of view of patient treatment 20. This implies, first, the use of simple but effective procedures for various images types. In particular, various methods of contour detection can be considered here, which are based on such operators as: Prewitt, Roberts, Sobel, LoG, Canny and others. This is based on the fact that even special methods do not provide 100% accuracy in detecting and identifying megaloblastic anemia cells 20. An important point here is to improve the quality of the processed image visualization to make appropriate decisions. For these purposes, it is desirable to consider both the original images and the images with modified contrast. To generalize the processing results, various metrics for assessing the quality of the resulting images should be taken into account.
Therefore, considering the above, this study main objective is to consider some procedure for analyzing images with megaloblastic anemia cells. The purpose of such a procedure is to improve the processed images visualization quality by highlighting potential areas of interest where various objects may be present. Therefore, an important aspect is to conduct a comparative analysis of various approaches to edge detection on medical images in the study of megaloblastic anemia cells.
Materials and Methods
Medical image of megaloblastic anemia cells as a research object
One of the research objects in the diseases diagnosis and increasing medical visualization efficiency are images of megaloblastic anemia cells, which are made under a microscope. These studies allow to increase the diagnostic analysis accuracy, and to improve the visualization of areas of interest. It is important to consider in detail not only megaloblastic anemia cells, but also accompanying elements, objects of potential interest.
On Fig. 1 – Fig. 3 show typical digital images with megaloblastic anemia cells. Here it will be simply Example 1, Example 2 and Example 3. Despite the apparent identity of such images, a number of the corresponding images features should be noted.
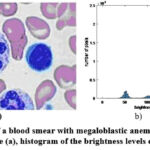 |
Figure 1: Image of a blood smear with megaloblastic anemia cells. Example 1. Original image (a), histogram of the brightness levels distribution (b) |
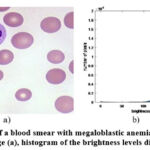 |
Figure 2: Image of a blood smear with megaloblastic anemia cells. Example 2. Original image (a), histogram of the brightness levels distribution (b) |
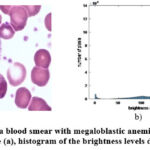 |
Figure 3: Image of a blood smear with megaloblastic anemia cells. Example 3. Original image (a), histogram of the brightness levels distribution (b). |
First of all, we see that the cells of megaloblastic anemia have a pronounced color difference against the background of the general background apparent homogeneity. In particular, the question of the background homogeneity can be investigated based on contrasting methods, which will emphasize the existing differences in brightness that are invisible to the naked eye.
However, the background heterogeneity can be seen from the analysis of the brightness distribution histogram for each image (see Fig. 1b, Fig. 2b, Fig. 3b). Moreover, the brightness distribution histogram data have several local maxima (this is typical for the image Example 1 and Example 3). In general, this complicates the detection of megaloblastic anemia cells using simple methods and thus requires an appropriate comparative analysis. It should also be emphasized that the entropy parameter (more details on this parameter will be given below) for the considered types of examples is equal to: Example 1 – 6.6240; Example 2 – 6.4684; Example 3 – 6.6933. Thus, the greatest number of brightness level differences is typical for Example 3, and not for Example 1, as could be seen from the data of the corresponding brightness distribution histograms.
All of the above highlights the complexity and ambiguity of the solutions to the stated goal of this study.
Edge Detection Methods
To conduct a corresponding comparative study, we will consider classical approaches, and a method based on wavelet ideology as edge detection methods. The choice of such an analysis is based on the fact that classical approaches form the basis for most edge detection developments. At the same time, wavelet ideology has recently become widespread in the study of digital images.
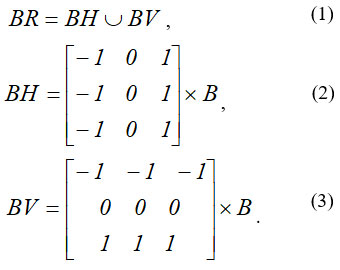
The Prewitt method or Prewitt operator is based on calculating the maximum response on a set of convolution kernels to find the local orientation of boundary 21. The following operators are used for these purposes. If we have some input image B, then the following convolutions are calculated ( BH – horizontal, BV – vertical), which are then combined into a single resulting image (BR) 21 :
The Roberts operator for edge detection computes the sum of the squared differences between diagonally adjacent pixels of the input image B 22. This can then also be written as a convolution of the image using the following kernels ( G1, G2)22 :

Then the resulting image is defined as:

The Sobel operator is based on convolution of the image with small separable integer filters in the vertical (GY) and horizontal (Gx) directions 21. Mathematically, this is written as follows 23 :

The LoG operator is based on the Laplacian of Gauss. The original image is convolved using a Gaussian kernel 24. The main problem with applying this operator at a single scale is that the response of the operator strongly depends on the ratio between the size of the spot structures in the image region and the size of the Gaussian kernel used for pre-smoothing 24.
The Canny operator uses a multi-stage algorithm to detect a wide range of edges in images based on the first derivative of a Gaussian 25.
Ideologically based edge extraction also involves performing convolution in the horizontal and vertical directions (GWH , GWV) of the original image with the mother wavelet (MWH, MWV)26 :

Next, the individual convolution results are combined into the resulting image 23 :

Each edge detection approach has its own advantages and disadvantages, which are the most typically manifested on certain types of input images 27-29, which also emphasizes the feasibility and necessity of conducting the corresponding study.
Contrast as a Tool for Changing Image Quality
For more accurate and effective edge detection, many researchers first perform contrasting of the original image. This allows one to highlight subtle differences in brightness in the image being examined 21, 23. However, at the same time, this approach can lead to false detection of edge points. It is also important to choose the right contrast change method for a particular type of image.
However, this paper primarily examines various edge detection approaches. Therefore, contrasting the original image is an additional factor in the corresponding study. Moreover, the contrasting basis is the methods of changing the brightness distribution histogram for the original image.
A common approach to contrasting an input image is to transform the corresponding histogram so that it is close to a uniform distribution 27, 30, 31. This is the approach that is used later to analyze and compare different edge detection approaches.
Quality Ratings of Processed Images
To conduct the corresponding study, an important point is the choice of the processed images quality assessments 32, 33. When choosing such assessments, one should take into account the task being solved and the possibility of calculating the selected assessments.
In this case, the problem of comparing different edge detection methods is solved. Therefore, it is inappropriate to use reference quality indicators. This is due to the impossibility and complexity of constructing a reference edge detection model. At the same time, in a specific case of edge detection, there may be a discrepancy in individual edge formation coordinates. Then, a priori, comparing different edge detection methods using such assessments is impossible.
It is also important to consider the fact that visualization plays an important role in medical diagnostics. Therefore, the quality of visualization can be considered the basis for choosing the appropriate assessments. Among such assessments, attention should be paid to no-reference quality metrics. These are assessments such as:
niqe is a measure of an image naturalness 34. The lower the niqe value, the better the perceptual quality.
brisque is a spatial quality score 35. The lower the brisque value, the better the perceptual quality.
piqe is an overall perceptual quality score without a reference image quality score 36. A lower score indicates better perceptual quality.
The entropy parameter should also be considered as a measure that shows the change in uncertainty 37. In this aspect, a higher value of the entropy indicator indicates the presence of more details in the image, which can be considered as one aspect of edge detection. This also allows for some evaluation of the contour detection quality.
Results
First of all, we note that the corresponding comparative analysis general scheme consists of considering various quality indicators of images processed by different edge detection operators under conditions of input image contrasting and without contrasting. Here, such quality indicators are also considered for input images different types (Fig. 1, Fig. 2 and Fig. 3). Then, the obtained indicators are compared with each other, and certain conclusions are made.
The results of the quality indicators calculations are summarized in Table 1 – Table 6 for each type of presented images without their preliminary contrasting and with contrasting.
Table 1: Quality ratings of the processed image for Example 1 (without contrast)
|
Edge detection method |
Quality ratings |
|||
|
niqe |
brisque |
entropy |
piqe |
|
|
Prewitt |
14.7793 |
49.5523 |
1.0244 |
15.6029 |
|
Roberts |
16.8688 |
49.7236 |
1,666 |
26.6450 |
|
Sobel |
14.7367 |
49.5620 |
1.0266 |
15.6070 |
|
LoG |
16.1030 |
51.2647 |
1,7284 |
27.7567 |
|
Canny |
17.3403 |
45.7670 |
1,878 |
34.3264 |
|
Wavelet |
8,8495 |
47.9526 |
1,3317 |
11.0569 |
Table 2: Quality ratings of the processed image for Example 1 (with contrast)
|
Edge detection method |
Quality ratings |
|||
|
niqe |
brisque |
entropy |
piqe |
|
|
Prewitt |
16.4635 |
50.8991 |
1,6554 |
26.6523 |
|
Roberts |
16.8688 |
49.7236 |
1,666 |
26.6450 |
|
Sobel |
16.5339 |
50.4923 |
1,672 |
27.1415 |
|
LoG |
16.3438 |
50.4617 |
2,2138 |
40.6998 |
|
Canny |
17.6094 |
51.0705 |
2,1949 |
42.9896 |
|
Wavelet |
8,7037 |
49.1124 |
2,1839 |
13.0392 |
The data analysis of Table 1 and Table 2 allows us to identify the method based on the wavelet ideology (Wavelet method) as the most effective for edge detection in images with megaloblastic anemia cells among all those considered (based on the selected group of indicators). For a number of individual indicators, contrasting the original image (Fig. 1) allows us to improve individual indicators. This concerns the niqe and entropy indicators. For most other edge detection methods, the quality indicators deteriorate after contrasting. This is explained by the complexity of the general background, many small details in the area of the megaloblastic anemia cell itself, which is displayed in the brightness distribution histogram for this image (Fig. 1b). However, the presented quality metrics generally allow one to evaluate and compare the original image and the image after contrasting (here and further in the tables the best indicators are highlighted in bold and underlined).
As an example, Fig. 4 shows individual edge detection results for the original image Example 1 (Fig. 1a).
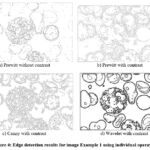 |
Figure 4: Edge detection results for image Example 1 using individual operators |
From the data in Fig. 4 it is evident that contrasting the original image as a result of its subsequent processing for the edge detection increases the visible brightness differences number. This affects the processed image corresponding evaluation indicators. In this case, many false edge points appear. The exception is the Wavelet edge detection method. This method allows you to emphasize the true edges on the original image objects.
The data analysis of Table 3 and Table 4 for the image Example 2 also confirms the prevalence of the Wavelet edge detection method compared to other approaches. In this case, overall, an improvement in the evaluation indicators of the processed image after contrasting the input image is visible. This is based on a more uniform distribution of the background point brightness and a smaller number of their peak values for the entire image.
Table 3: Quality ratings of the processed image for Example 2 (without contrast)
|
Edge detection method |
Quality ratings |
|||
|
niqe |
brisque |
entropy |
piqe |
|
|
Prewitt |
21.4605 |
53.3878 |
1,4206 |
22.5627 |
|
Roberts |
21.5650 |
52.6917 |
1,4817 |
25.3519 |
|
Sobel |
21.6411 |
53.4302 |
1,4129 |
22.6225 |
|
LoG |
23.7022 |
53.7618 |
1,569 |
25.5712 |
|
Canny |
20.6207 |
51.7153 |
1,7573 |
32.2018 |
|
Wavelet |
8,5086 |
28.9681 |
3,8376 |
18.6117 |
Table 4: Quality ratings of the processed image for Example 2 (with contrast)
|
Edge detection method |
Quality ratings |
|||
|
niqe |
brisque |
entropy |
piqe |
|
|
Prewitt |
21.1925 |
50.1839 |
1,6308 |
23.4704 |
|
Roberts |
17.5236 |
52.4189 |
1,4227 |
18.5347 |
|
Sobel |
20.5683 |
49.9179 |
1,6589 |
24.0004 |
|
LoG |
24.8985 |
43.8370 |
2,8014 |
53.5161 |
|
Canny |
20.3263 |
43.1628 |
3,2421 |
78.3213 |
|
Wavelet |
8,4886 |
32.9681 |
4,4376 |
20.1403 |
On Fig. 5 shows some results of processing the image Example 2 using different edge detection operators.
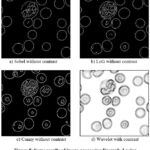 |
Figure 5: Some results of image processing Example 2 using different edge detection operators |
The data in Fig. 5 indicate approximately the same results of processing the image Example 2 using different edge detection operators. Therefore, here we pay attention to the entropy index, which allows better structure of the megaloblastic anemia cell identification, which can be assessed without contrast (Table 3).
The data analysis of Table 5 and Table 6 (for image – Example 3) also indicates a more efficient use of the Wavelet method for edge detection in an image.
Table 5: Quality ratings of the processed image for Example 3 (without contrast)
|
Edge detection method |
Quality ratings |
|||
|
niqe |
brisque |
entropy |
piqe |
|
|
Prewitt |
17.6717 |
49.8982 |
1,0646 |
15.3035 |
|
Roberts |
17.8587 |
49.5139 |
1,0118 |
15.2313 |
|
Sobel |
17.7230 |
49.8893 |
1,063 |
15.3059 |
|
LoG |
18.6288 |
53.2788 |
1,5778 |
25.6888 |
|
Canny |
17.2408 |
45.6353 |
1,9843 |
37.1334 |
|
Wavelet |
5.0643 |
35.0228 |
4,4625 |
16.4014 |
Table 6: Quality ratings of the processed image for Example 3 (with contrast)
|
Edge detection method |
Quality ratings |
|||
|
niqe |
brisque |
entropy |
piqe |
|
|
Prewitt |
18.0005 |
52.9498 |
1,6164 |
25.5550 |
|
Roberts |
16.7611 |
53.3776 |
1,5161 |
22.3826 |
|
Sobel |
17.9964 |
52.7035 |
1,6441 |
26.0477 |
|
LoG |
18.2448 |
51.0766 |
2,3855 |
44.5935 |
|
Canny |
17.4163 |
40.7631 |
2,7122 |
57.4449 |
|
Wavelet |
5.0943 |
35.4228 |
4,7625 |
17.4693 |
On Fig. 6 shows some examples of image processing Example 3 for edge detection.
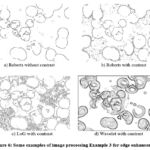 |
Figure 6: Some examples of image processing Example 3 for edge enhancement |
Thus, the obtained results allow us to evaluate various edge detection methods for images with megaloblastic anemia cells, taking into account the original image processing without preliminary changes in its contrast and contrasting.
Discussion
Digital image analysis has become an essential tool in modern hematology, enhancing the precision and efficiency of laboratory diagnostics38. Numerous studies focus on analyzing blood components, such as red blood cells (RBCs) and white blood cells (WBCs), using medical digital imaging techniques. Among these studies, images with megaloblastic anemia cells occupy a special place.
The work by K. T. Navya, K. Prasad and B. M. K. Singh provides an overview of blood smear image analysis for detecting anemia 39. First of all, the authors emphasize the importance of conducting relevant studies and in particular the anemia diagnosis using peripheral blood smear analysis. At the same time, attention is drawn to this process automation, which involves the use of simple and adequate approaches. For these purposes, the authors consider various methods and the possibility of their use for a certain type of digital images. In this aspect, this correlates with the ideas that are considered in our work. At the same time, an important point of such analysis is the input data segmentation, which is also emphasized in our study.
In the work of K. T. Navya, K. Prasad and B. M. K. Singh it is emphasized that such edge detection operators as Canny, LOG and Sobel allow to achieve up to 85% accuracy in identifying blood components 39. These figures cannot be unambiguously compared with our results, since we operate with quality metrics. At the same time, the data analysis of Table 1 – Table 6 also allows to distinguish the Canny, LOG and Sobel operators in comparison with the Wavelet operator for edge detection. In this regard, our study correlates with the conclusions of the work 39, where edge detection using wavelets was not considered.
B. Ballarò, A. M. Florena, V. Franco, D. Tegolo, C. Tripodo and C. Valenti consider some issues of images with megakaryocyte cells automated analysis40. For these purposes, first of all, the input image is segmented. The authors note that this can be done based on various approaches, including edge detection methods, wavelet transform of data. This emphasizes the feasibility of the studies conducted in our study. The authors also pay attention to the megakaryocyte cells geometric characteristics. However, this approach is controversial, since the geometric characteristics will correlate with the input image size, such an image presentation type and features. Nevertheless, study 40 offers useful assistance in supporting a specialist in the classification of megakaryocyte disorders.
The paper 40 also notes that edge detection methods can increase the accuracy of blood component classification to 97%. Thus, the choice of edge detection operator and the change in the original image contrast are key factors in identifying and classifying megaloblastic anemia cells. Then the data in Table 1 – Table 6 are a tool for selecting a specific edge detection operator when solving the tasks set, taking into account the image type under consideration.
H. A. Elsalamony considers red blood cells in human blood smears based on the analysis of digital images using neural networks 41. The author notes that one of such an analysis methods is based on microscopic examination of blood smears. Based on this, the paper presents a general algorithm for detecting and counting three types of anemia-infected red blood cells. This algorithm allows achieving maximum detection of approximately 97.8% of all cells in the examined images. For these purposes, the Hough transform, and a number of morphological tools are used 41. Further, a neural network is used to classify the cells. However, the author does not note the type of input images and its main characteristics, which is important in this kind of research. At the same time, considering perception metrics to evaluate the preliminary image analysis results before classifying subsequent results is an important step. This is what is summarized in the data in Table 1 – Table 6.
P. Dhar, K. Suganya Devi, S. K. Satti and P. Srinivasan investigate the possibility of red blood cell classification from digital images using wavelet ideology 42. The authors propose a hybrid approach using color quantized segmented K-mean convolutional neural network with deep attention and extreme gradient boosting algorithm for poikilocytosis classification to detect and classify abnormal cells 42. In this case, the features of the segmented red blood cells are extracted using Gabor wavelets. The proposed approach gives good results, which justifies the use of wavelet ideology for this purpose. The model proposed by the authors allows obtaining estimates at the level of 95.38% and 93.43% in further classification of abnormal cells 42. In this process, an important role is given to the original image segmentation using wavelets. This fact is also confirmed and correlated with the results of our study, where the Wavelet operator gives the best results in edge detection (Table 1 – Table 6).
S. Mitra, N. Das, S. Dey, S. Chakraborty, M. Nasipuri and M. K. Naskar conduct a systematic review of digital cytological image analysis methods, paying attention to the possibility of automating this process 43. The authors clearly distinguish the types of cytological objects. However, insufficient attention is paid to the corresponding digital images types. At the same time, it is the digital image type and its characteristics that determine the certain methods application sequence in order to solve the problem. Nevertheless, the authors pay attention to the importance of using the wavelet ideology in studying the texture and structural features of megaloblastic anemia cells. This also correlates with the results of our study and confirms their validity and significance.
The researchers also highlight the complexity and ambiguity in using edge operators to isolate megaloblastic anemia cells.
For example, C. C. Hortinela, J. R. Balbin, J. C. Fausto, P. D. C. Divina, and J. P. T. Felices emphasize the need for a balanced approach in the use of image processing methods in the study of abnormal red blood cells and the anemia certain types diagnosis 44. Various procedures for such analysis can also be used here, where it is appropriate to use edge enhancement operators. However, such analysis should be performed taking into account the input image type and the parameters for edge enhancement definition by different operators. This is especially important when different types of red blood cells can be in the field of view. Thus, the authors confirm the need for appropriate studies to examine the feasibility of using edge enhancement methods in certain conditions. The work notes a high degree of abnormal red blood cells various types identification from 95% to 98.33% 44, where it is important to take into account the type of input image. Our work also shows the high efficiency of using the Wavelet operator to highlight the edge on various types of images with megaloblastic anemia cells (Table 1 – Table 6).
V. Yadav, P. Ganesh, and G. Thippeswamy also highlight the need for consistency in the selection of edge operators in the study of red blood cells using a computer-aided framework for the blood disorders diagnosis 45. This analysis technique is based on granulometric assessment, which involves the relevant image preliminary segmentation, for example, using edge detection methods. This is also consistent with the approaches considered in our study and confirms the significance of such an analysis. However, it is not possible to compare the corresponding results, since V. Yadav, P. Ganesh and G. Thippeswamy operate with the concept of diagnostic accuracy in blood disorders, in our case, quality metrics act as an evaluation parameter.
V. Acharya and P. Kumar also use edge detection methods in their study on red blood cell identification. In particular, the authors pay attention to such an edge detection method as the use of the Sobel operator 46. This method is used in combination with granulometric analysis to separate red blood cells from white blood cells. However, the work does not consider preliminary methods for processing the input image. Also, the work does not describe the original image parameters. However, the results presented in Table 1–Table 6 confirm the validity of using the Sobel operator for edge detection for erythrocyte identification.
As for the obtained results evaluating methods, here researchers, first of all, take into account the problem they are solving.
Study 47 uses evaluation measures that allow us to evaluate the quality of the segmentation performed. Reference quality metrics are used here. However, it is not entirely clear what (with what base result) the corresponding comparison is made. This somewhat complicates the work results understanding. Our study describes in detail the rationale for choosing the evaluations of the results such evaluations types comparison.
The work by R. Garg, A. K. Sandhu, B. Kaur, B. Goyal, and A. Dogra uses standard image description statistical parameters, which allows understanding the meaning of the corresponding scores 48. However, this work also does not provide a rationale for using the corresponding scores. Moreover, statistical estimates depend on the data type presented and their sample, which complicates comparative analysis. Our study provides specific measures of the results perception quality, which allows for comparison for the individual types of images we study.
K. A. Noman and A. S. Yaseen describe in detail in their study the selection of appropriate estimators for the analysis of medical microscopic image processing 49. This helps to better understand the obtained results and evaluate them. In particular, the concepts of entropy and image quality assessment based on its perception were used as such assessments. Similar assessments were used in our study. However, it is inappropriate to compare such assessments values, since we use completely different medical images.
Thus, in general, the presented study corresponds to the main directions of analysis in the field of megaloblastic anemia cell images. This confirms the appropriateness and significance of the analysis, and the possibility of its use in further work on medical image research.
Conclusion
The paper presents a comparative analysis of edge detection methods in order to analyze digital medical images with megaloblastic anemia cells. Attention is paid to simple classical edge detection operators in comparison with an approach based on wavelet ideology. Cases of edge detection without changing the original image contrast and taking into account its contrasting are also considered. A number of no-reference quality metrics are used to evaluate the results obtained.
The strong points of the issues considered are justification of the obtained results estimates using; determination of the edge detection most effective method in a comparative aspect; characteristics description for the images types used in the study. Among the problematic aspects of the material considered, it is necessary to indicate the justification of the need for contrasting the original image and the choice of the method for changing the contrast procedure.
A series of experiments were conducted on real images. The results obtained are acceptable and can be used for blood smear analysis.
As further research directions, it is advisable to highlight the creation of a basic set of images with megaloblastic anemia cells in order to use reference quality metrics and comparing them with no-reference quality metrics. No less important is the expansion of such research: the study of various wavelets using for edge detection, conducting the corresponding analysis in various color spaces.
Acknowledgement
The authors are thankful to the Department of Media Systems and Technology, Kharkiv National University of Radio Electronics, Kharkiv, Ukraine, and the Department of Medical Laboratory Sciences, College of Health Sciences, Gulf Medical University, Ajman, United Arab Emirates, for providing support and facilities.
Funding Source
The author(s) received no financial support for the research, authorship, and/or publication of this article
Conflict of Interest
The author(s) do not have any conflict of interest.
Data Availability Statement
This statement does not apply to this article.
Ethics approval
This research did not involve human participants, animal subjects, or any material that requires ethical approval.
Informed Consent Statement
This study did not involve human participants, and therefore, informed consent was not required
Clinical Trial Registration
This research does not involve any clinical trials
Author Contributions
Vyacheslav Lyashenko and Asaad Babker: Conceptualization, Methodology, Writing and Original Draft.
Vyacheslav Lyashenko and Asaad Babker: Data Collection, Analysis, Writing Review and Editing.
Vyacheslav Lyashenko : Visualization, Supervision, Project Administration.
Asaad Babker, Anass Abbas, Manar Shalabi and Khalid Abdelsamea Mohamedahmed Funding Acquisition: Resources, Supervision.
The final manuscript was read and approved by all authors.
References
- Obeagu EI, Babar Q, Obeagu GU. Megaloblastic anaemia-a review. Int J Curr Res Med Sci. 2021;7(5):17-24.
- Dutta TK. Megaloblastic Anemia. Ann Clin Med Case Rep. 2023;10(15):1-5.
- Khajuria A, Sehrawat R. Megaloblastic anemia: An updated review. DY Patil J Health Sci. 2022;10(2):63-66.
CrossRef - Ghafoor MB, Sarwar F, Khan S, Majeed S, Yasmeen F, Ashraf M, Abbasi S, Sami A, Riyaz N. Study of clinico-pathological profile in patients with megaloblastic anemia. Prof Med J. 2023;30(10):1270-1274.
CrossRef - Trüeb RM, Trüeb RM. Nutritional disorders of the hair and their management. In: Nutrition for Healthy Hair: Guide to Understanding and Proper Practice. 2020:111-223.
CrossRef - Brittenham GM, Moir-Meyer G, Abuga KM, Datta-Mitra A, Cerami C, Green R, Pasricha S-R, Atkinson SH. Biology of anemia: a public health perspective. J Nutr. 2023; 153:S7-S28.
CrossRef - Anand I, Gupta P. How I treat anemia in heart failure. Blood. 2020;136(7):790-800.
CrossRef - Tałasiewicz K, Kapała A. Anemia in cancer patients: addressing a neglected issue–diagnostics and therapeutic algorithm. Nowotwory J Oncol. 2023;73(5):309-316.
CrossRef - Babker AMAA, Gameel FEMH. Molecular Characterization of Prothrombin G20210A gene Mutations in pregnant Sudanese women with spontaneous recurrent abortions. Rawal Med J. 2015;40(2):207-209.
- Safiri S, Kolahi AA, Noori M, Nejadghaderi SA, Karamzad N, Bragazzi NL, Sullman MJ, Abdollahi M, Collins GS, Kaufman JS, Grieger JA. Burden of anemia and its underlying causes in 204 countries and territories, 1990–2019: results from the Global Burden of Disease Study 2019. J Hematol Oncol. 2021;14(1):1-16.
CrossRef - Rabotiahov A, Kobylin O, Dudar Z, Lyashenko V. Bionic image segmentation of cytology samples method. In: 2018 14th International Conference on Advanced Trends in Radioelectronics, Telecommunications and Computer Engineering (TCSET). IEEE; 2018:665-670
CrossRef - Mousavi SMH, Victorovich LV, Ilanloo A, Mirinezhad SY. Fatty Liver Level Recognition Using Particle Swarm optimization (PSO) Image Segmentation and Analysis. In: 2022 12th International Conference on Computer and Knowledge Engineering (ICCKE). IEEE; 2022:237-245.
CrossRef - Orobinskyi P, Petrenko D, Lyashenko V. Novel Approach to Computer-Aided Detection of Lung Nodules of Difficult Location with Use of Multifactorial Models and Deep Neural Networks. In: 2019 IEEE 15th International Conference on the Experience of Designing and Application of CAD Systems (CADSM). IEEE; 2019:1-5.
CrossRef - Çalışkan A. Diagnosis of malaria disease by integrating chi-square feature selection algorithm with convolutional neural networks and autoencoder network. Transactions of the Institute of Measurement and Control. 2023;45(5):975-985.
CrossRef - Çalışkan A. Finding complement of inefficient feature clusters obtained by metaheuristic optimization algorithms to detect rock mineral types. Transactions of the Institute of Measurement and Control. 2023;45(10):1815-1828.
CrossRef - Hoffbrand AV. Megaloblastic anaemia. In: Postgraduate Haematology. 2015:53-71.
CrossRef - Wu Q, Liu J, Xu X, Huang B, Zheng D, Li J. Mechanism of megaloblastic anemia combined with hemolysis. Bioengineered. 2021;12(1):6703-6712.
CrossRef - Chen HM, Tsao YT, Tsai SC. Automatic image segmentation scheme for counting the blood cell nuclei with megaloblastic anemia. J Med Imaging Health Inform. 2016;6(1):102-107.
CrossRef - Abdulhay EW, Allow AG, Al-Jalouly ME. Detection of Sickle Cell, Megaloblastic Anemia, Thalassemia, and Malaria through Convolutional Neural Network. In: 2021 Global Congress on Electrical Engineering (GC-ElecEng). IEEE; 2021:21-25.
CrossRef - Yıldız TK, Yurtay N, Öneç B. Classifying anemia types using artificial learning methods. Eng Sci Technol Int J. 2021;24(1):50-70.
CrossRef - Balochian S, Baloochian H. Edge detection on noisy images using Prewitt operator and fractional order differentiation. Multimed Tools Appl. 2022;81(7):9759-9770.
CrossRef - Vajpayee P, Panigrahy C, Kumar A. Medical image fusion by adaptive Gaussian PCNN and improved Roberts operator. Signal Image Video Process. 2023;17(7):3565-3573.
CrossRef - Trung NT, Ngan TT, Tuan TM, Nguyen TH. Combining Entropy Optimization and Sobel Operator for Medical Image Fusion. Comput Syst Sci Eng. 2023;44(1):535-544
CrossRef - Anand A, Tripathy SS, Kumar RS. An improved edge detection using morphological Laplacian of Gaussian operator. In: 2015 2nd International Conference on Signal Processing and Integrated Networks (SPIN). IEEE; 2015:532-536.
CrossRef - Xu Z, Ji X, Wang M, Sun X. Edge detection algorithm of medical image based on Canny operator. In: Journal of Physics: Conference Series. Vol 1955. IOP Publishing; 2021:012080.
CrossRef - Lyashenko VV, Babker AMAA, Kobylin OA. The methodology of wavelet analysis as a tool for cytology preparations image processing. Cukurova Med J. 2016;41(3):453-463.
CrossRef - Abu-Jassar AT, Al-Sharo YM, Lyashenko V, Sotnik S. Some Features of Classifiers Implementation for Object Recognition in Specialized Computer Systems. TEM J Technol Educ Manag Inform. 2021;10(4):1645-1654.
CrossRef - Al-Sharo YM, Abu-Jassar AT, Sotnik S, Lyashenko V. Neural networks as a tool for pattern recognition of fasteners. Int J Eng Trends Technol. 2021;69(10):151-160.
CrossRef - Ahmad MA, Baker JH, Tvoroshenko I, Lyashenko V. Modeling the structure of intellectual means of decision-making using a system-oriented NFO approach. Int J Emerg Trends Eng Res. 2019;7(11):460-465.
CrossRef - Jenkin R. Contrast signal to noise ratio. Electron Imaging. 2021;33:1-6.
CrossRef - Ortiz-Jaramillo B, Kumcu A, Platisa L, Philips W. Content-aware contrast ratio measure for images. Signal Process Image Commun. 2018;62:51-63.
CrossRef - Khlamov S, Tabakova I, Trunova T, Deineko Z. Machine Vision for Astronomical Images Using the Canny Edge Detector. In: IX International Scientific Conference “Information Technology and Implementation” (IT&I-2022). Ceur-Ws; 2022:1-10.
CrossRef - Khlamov S, Tabakova I, Trunova T. Recognition of the astronomical images using the Sobel filter. In: 2022 29th International Conference on Systems, Signals and Image Processing (IWSSIP). IEEE; 2022:1-4.
CrossRef - Mittal A, Soundararajan R, Bovik AC. Making a “completely blind” image quality analyzer. IEEE Signal Process Lett. 2012;20(3):209-212
CrossRef - Mittal A, Moorthy AK, Bovik AC. No-reference image quality assessment in the spatial domain. IEEE Trans Image Process. 2012;21(12):4695-4708
CrossRef - Venkatanath, Narasimhan, D. Praneeth, Maruthi Chandrasekhar Bh, Sumohana S. Channappayya, and Swarup S. Medasani. Blind image quality evaluation using perception based features. In: 2015 Twenty First National Conference on Communications (NCC). IEEE; 2015:1-6.
CrossRef - Gonzalez RC, Woods RE, Eddins SL. Digital Image Processing Using MATLAB. New Jersey: Prentice Hall; 2003.
- Babker AM, Suliman RS, Elshaikh RH, Boboyorov S, Lyashenko V. Sequence of Simple Digital Technologies for Detection of Platelets in Medical Images. Biomed Pharmacol J. 2024;17(1):141-152.
CrossRef - Navya KT, Prasad K, Singh BMK. Analysis of red blood cells from peripheral blood smear images for anemia detection: a methodological review. Med Biol Eng Comput. 2022;60(9):2445-2462.
CrossRef - Ballarò B, Florena AM, Franco V, Tegolo D, Tripodo C, Valenti C. An automated image analysis methodology for classifying megakaryocytes in chronic myeloproliferative disorders. Med Image Anal. 2008;12(6):703-712.
CrossRef - Elsalamony HA. Healthy and unhealthy red blood cell detection in human blood smears using neural networks. Micron. 2016;83:32-41.
CrossRef - Dhar P, Suganya Devi K, Satti SK, Srinivasan P. A hybrid soft attention based XGBoost model for classification of poikilocytosis blood cells. Evolving Syst. 2024;15(2):523-539.
CrossRef - Mitra S, Das N, Dey S, Chakraborty S, Nasipuri M, Naskar MK. Cytology image analysis techniques toward automation: systematically revisited. ACM Comput Surv. 2021;54(3):1-41.
CrossRef - Hortinela CC, Balbin JR, Fausto JC, Divina PD C, Felices JPT. Identification of abnormal red blood cells and diagnosing specific types of anemia using image processing and support vector machine. In 2019 IEEE 11th International Conference on Humanoid, Nanotechnology, Information Technology, Communication and Control, Environment, and Management (HNICEM). IEEE; 2019:1-6.
CrossRef - Yadav V, Ganesh P, Thippeswamy G. Determination and categorization of Red Blood Cells by Computerized framework for diagnosing disorders in the blood. J Intell Fuzzy Syst. 2023;Preprint:1-13.
CrossRef - Acharya V, Kumar P. Identification and red blood cell classification using computer aided system to diagnose blood disorders. In: 2017 International Conference on Advances in Computing, Communications and Informatics (ICACCI). IEEE; 2017:2098-2104.
CrossRef - Swaroopa HN, Jagadale BN, Farhan OAM, Alnaggar VH, Abhisheka TE. Human Epithelial Cell Image Analysis and Segmentation using Threshold Based Fusion Technique. Biomed Pharmacology J. 2024;17(1):443-452.
CrossRef - Garg R, Sandhu AK, Kaur B, Goyal B, Dogra A. Design of Filtration Approach for Image Quality Improvement in Mango Leaf Disease Detection and Pharmaceutical Treatment. Biomed Pharmacology J. 2024;17(1):341-358.
CrossRef - Noman KA, Yaseen AS. Microscopic Images Improvement Depending on Dark Channel Prior and Adaptive Histogram Equalization Based on the Lab Colour Model. Adv Sci Technol Res J. 2024;18(4):128-136.
CrossRef


