MM Institute of Computer Technology & Business Management (MCA), Maharishi Markandeshwar (Deemed to be University), Mullana-Ambala, Haryana, India.
Corresponding Author E-mail:skpanwar2277@gmail.com
DOI : https://dx.doi.org/10.13005/bpj/3016
Abstract
Liver disease is a very critical disease in today's world. There are various types of liver disorders, including some that are brought on by viruses. Detecting liver infections in their early stages is crucial for more effective treatment. An AI-based automated diagnostic model can play a very significant role in detecting liver illness. The main goal of this research is to create an AI based hybrid model utilizing feature selection and classification algorithms to detect liver disease. Three feature selection techniques - Pearson Correlation, Feature Importance using Extra Tree, and Mutual Information Gain are used on the ILPD dataset to identify the relevant features. The Decision Tree (DT), K-Nearest Neighbour (KNN), Random Forest (RF), Adaptive Boosting (Adaboost), and Extreme Gradient Boosting (XGboost) classifiers have been used with the selected features of the dataset. The performance of models has been evaluated with various performance parameters, namely accuracy, precision, sensitivity, and F-Measure. The combination of the Pearson Correlation algorithm with the Random Forest classifier has shown superior performance compared to other classifiers like DT, KNN, RF, Adaboost, and XGBoost. The finding also depicts that Pearson Correlation algorithm have effectively eliminated irrelevant features from the data set, and the feature selection ratio of Pearson Correlation Algorithm is 80%. This proposed PC-RF model has provided 80% accuracy in identifying liver illness, which is 3% to 8% better accuracy than the other classifiers such as DT, KNN, Adaboost, and XGboost. Additionally, the proposed PC-RF model has achieved 4% to 25% better accuracy over latest state-of-the-art models.
Keywords
Feature Selection; Feature Importance using Extra Tree; Liver Disease; Mutual Information Gain; Pearson Correlation
Download this article as:| Copy the following to cite this article: Kumar S, Rani P. An AI-based Liver Disease Prediction Model based on Pearson Correlation Feature Selection Method. Biomed Pharmacol J 2024;17(4). |
| Copy the following to cite this URL: Kumar S, Rani P. An AI-based Liver Disease Prediction Model based on Pearson Correlation Feature Selection Method. Biomed Pharmacol J 2024;17(4). Available from: https://bit.ly/3B9USoJ |
Introduction
Liver disease (LD) ranks as the 11th most prevalent chronic disease globally. It leads to approximately one million deaths annually due to cirrhosis, another million from viral hepatitis, and an additional million from hepatocellular carcinoma, all of which are consequences of liver disease1. Liver disease is not easily identified in the early period as it functions normally even if it is damaged. It occurs when the human liver fails to function properly, and it can be caused by a number of factors2. Liver Disease may be identified by evaluating the degree of the blood enzyme. The early diagnosis of liver issues can improve the patient’s survival rate. Through the manual analysis of liver disease, the following are faced: time-consuming, inefficient specialists, wrong detection, less equipment, and insusceptibility to predict the disease and it becomes a failed process. It is considered one of the most devastating diseases affecting humans3. Machine Learning can be employed to diagnose Liver Disease, thereby mitigating the human error often linked to liver disease diagnosis.
Timely diagnosis of liver disease can lead to effective treatment and potentially save human lives4. Nowadays, a wide number of areas use machine learning extensively. It provides methodologies to solve real-life problems by developing models because huge quantities of data are easily available. The risk of liver illness can be identified by various ML algorithms using clinical data5. The initial step in developing any ML model is to use feature selection techniques to mine the data with the goals of enhancing model performance, cutting costs, and avoiding overfitting for quick and accurate results. The outcome of the model can be improved by the selection of the significant features and may also decrease the complexity of the model. The motivation behind this research is to construct an accurate model with special utilization of feature selection methods for enhancing the forecast of liver illness along using machine learning approaches that can assist medical experts.
The major contribution made by this research study is to evaluate the three feature selection techniques namely Pearson Correlation, Feature Importance using Extra Tree, and Mutual Information Gain for choosing the best features which is most relevant for the model. To classify liver disease accurately, authors have also applied five classification algorithms, namely DT, KNN, RF, Adaboost, and XGboost, on the ILPD dataset along with feature selection methods. These classification algorithms, with the utilization of Pearson Correlation algorithms, have provided better results for the identification of a liver illness. This research work is focused on exploring the following:
Three feature selection methods, namely Pearson Correlation algorithms, Feature Importance using Extra Tree algorithms, and Mutual Information Gain algorithms, have been compared to select the key features.
Relevant features have been identified for the identification of liver illness.
A hybrid PC-RF model has been developed for the prediction of liver illness.
The other part of the research study is separated into the following sections: Section 2 has depicted the Literature Review. The dataset, methodology, classification algorithms, feature selection, and performance parameters have been employed in Section 3 with regard to the classification of liver disease. Section 4 presents the results and discussion of this study, while Section 5 outlines the conclusions and potential future directions for this research.
Literature Review
Thirunavukkarasu presented the research paper with the objective of the identification of liver disease using different classifiers Logistic Regression (LR), K-Nearest Neighbour (KNN) and Support Vector Machine (SVM) on the ILPD dataset. The accuracy of the model was evaluated by confusion matrix. By utilization of the feature selection methods, the best features were identified for improving the accuracy and reducing execution time. The classification algorithms of LR and KNN have an equal accuracy of 73.97% whereas LR has the highest sensitivity. LR has been found fit for the identification of liver disease6. L. Alice Auxilia presented research work on liver disorder prediction by using the Pearson Correlation Classification feature selection on the ILPD data set. Five classification techniques were applied: Decision Tree (DT), Naive Bayes (NB), SVM, Random Forest (RF), and Artificial Neural Network (ANN). The Pearson Correlation Coefficient was implemented for choosing the most significant features as well as oversampling, feature scaling were also used. It has been observed that decision trees have provided better performance in identifying liver disease7. Muthuselvan proposed classifying the liver patient dataset using several classifiers such as Naive Bayes (NB), K-Star, J-48, and Random Tree on the ILPD dataset. It was observed that the Random Tree classifier achieved the highest accuracy of 74.2% in classifying and identifying patients with liver illness8.
Singh implemented a Correlation based Feature Selection Technique with classification algorithms for predicting liver disease. During the execution phase, 10-cross validation method with five classifiers, namely LR, Support Vector Machine (SMO), K-Nearest Neighbour (IBK), Decision Tree (J-48) and RF, were employed. With the use of selected features, LR has achieved the higher accuracy of 74.36%9. Joloudari has applied a feature extraction approach for choosing the relevant features. Five classification algorithms, namely Bayesian networks, SVM, Particle Swarm Optimization (PSO), Multi-Layer Perception (MLP) and RF, were employed for the identification of liver disease. The combination of less number of features with the hybrid PSO-SVM model has provided enhancement in accuracy10. Abdalrada presented a predictive model with the use of LR abilities to identify liver disease. With the use of the ILPD dataset, the dataset was separated into 90% for training and 10% of sets were used for testing. The model was assessed by the Performance metrics, namely accuracy, sensitivity, specificity, Type I error, and Type II error. The model has obtained an accuracy of 72.4% and can be helpful for prediction of liver illness11.
Naseem presented the model for the identification of liver disease by using the ten classifiers NB, MLP, KNN, Credal Decision Tree (CDT), Forest by Penalizing Attributes (Forest-PA), Decision Tree (J-48), RF, Average One Dependency Estimator (AIDE), Composite Hypercube on Iterated Random Projection (CHIRP) and SVM on the both dataset, one is obtained from the UCI repository. The other one is taken from the GitHub repository. By using various performance metrics, Random Forest has achieved the most précised accuracy of 72% on the UCI dataset, while SVM has achieved an accuracy of 71% on the GitHub dataset12. Azam implemented the feature selection methods on the liver patient datasets with the help of the five classifiers, namely RF, MLP, DT, KNN, and SVM. The authors depicted the outcome of the classifiers by applying with and without feature selection approaches. By utilization of feature selection, the KNN algorithm performed well in comparison to other techniques. It provided an accuracy of 74%13.
Aryanpresented a study for the identification of liver disorders by using various classifiers such as Gradient Boosting Machine (GBM), Artificial Neural Network (ANN), KNN, DT, LR, RF, Naive Bayes, and SVM. The dataset was taken from the Mayo Clinic Trial USA. The Logistic Regression has provided the best performance in the prediction of liver disorder with an accuracy of 55%14. Ghosh performed the comparative analysis by implementing seven classifiers: LR, RF, SVM, Adaboost, KNN, XGBoost, and DT, for the identification of liver illness on the ILPD data set. These models were evaluated by using several performance parameters i.e., accuracy, F1 Score, precision, and AUC. On the comparative analysis of existing models RF has been found as the best algorithms for early identification of liver disease15. Geetha have evaluated approaches for liver disorder detection by the implementation of classification algorithms of SVM and LR with respect to the Data Mining Techniques. In this analysis, the dataset of 583 patients was taken from ILPD with ten different parameters. SVM provide best accuracy of 75.04% with 79% sensitivity16. Choudhary designed a well-structured model for the identification of liver illness using various classifiers. Five classifiers, namely LR, SVM, Naive Bayes, Random Forests, and Gradient Boosting, were implemented on the ILPD dataset. Outcome of the Model was assessed by utilizing several parameters: F-Score, Precision, Recall and Accuracy. The LR has obtained the best accuracy of 71% in the identification of liver illness17.
Mohammad presented the soft voting classifiers model for prediction of liver illness. Ensemble soft voting classifiers with binary classification was developed using the three ML classifiers DT, SVM, and Naïve Bayes for the prediction of liver illness. The outcome of the model has been enhanced by using the soft voting classifiers18. Gupta presented a model for the detection of liver disorders by applying the Random Forest feature selection method. The classifiers such as LR, RF, KNN, DT, Gradient Boosting, Extreme Gradient Boosting and LightGB were used. Models performance were measured by utilizing the several parameters, namely Accuracy, Recall, Specificity, Precision, F1 Score, Reliability, ROC, and AUC. Both Random Forest Tree and Light GB have obtained an equal accuracy of 63% for the identification of liver illness19. Jamila proposed a model with the use of a dataset from the Federal Medical Centre, Yola. Three classifiers, namely Naive Bayes, Classification and Regression Tree, and SVM, were employed by applying the 10-fold cross-validation for the identification of liver cirrhosis. By utilizing an SVM classifier, this model has obtained 71% accuracy for the identification of liver disorders. The result indicates that this model can be useful to make better clinical decisions20.
Choubey presented an automated diagnostic model for the detection of liver illness by applying seven classifiers, i.e., Decision Tree, LR, Gaussian, Stochastic Gradient Descent, KNN, RF, SVM and Naïve Bayes. Decision Tree has obtained the highest accuracy of 75.1% in comparison to other classifiers. The result concludes that this model can be helpful in reducing the time of diagnosis and disease prediction at an earlier stage. The model accuracy has been improved by using the feature selection techniques21. Jiajun developed a liver disease prediction model, which was created with the aid of the five classifier as LR, SVM, RF, KNN, and Gradient Boosting. The authors separated the ILPD dataset into training and testing sets. Several performance parameters like Accuracy, Precision, Recall, and F1-Score assessed these models. RF has obtained the best accuracy of 74% for the prediction of liver illness. The findings of this research work depict that data pre-processing, feature engineering, and model selection can enhance the models accuracy22. Yasmin presented a model on the basis of Mutual Information and Kernel Principal Component Analysis feature selection methods. The classification algorithms, namely KNN, SVM, RF, Multiple Layer Perception (MLP), and Ensemble classifier, were implemented on the ILPD dataset. The evaluation of the performance of the model has been carried out by using various parameters. KNN has obtained a higher accuracy of 76.03% for the forecast of liver illness23.
Vardhan presented a model for forecast of liver illness using LR and SVM classifiers on the ILPD. In the preprocessing stage, the dataset was cleaned from missing values for easy analysis. LR has achieved the highest accuracy of 72%, while SVM has achieved only 70%24. Kumar developed an efficient model for the identification of liver illness by employing various classifiers, namely LR, SVM, DT, KNN, and RF on the ILPD dataset. The LR has obtained accuracy of 75% for the identification of liver disorder. This study can be helpful in assisting healthcare experts25.
Materials and Methods
Dataset
Indian Liver Patient Dataset is taken from the University of California, Irvine ML repository, and it accommodates 11 columns with which ten features and one target variable are used for this research are provided in Table 1 (ILPD (Indian Liver Patient Dataset) – UCI Machine Learning Repository).
Table 1: Features of ILPD Dataset
|
Variable name |
Feature Type |
Domain |
|
Patient Age |
Real number |
(4-90) |
|
Gender – Patient |
Categorical |
(Male-Female) |
|
Total Bilirubin (TB) |
Real number |
(0.4-75) |
|
Direct Bilirubin (DB) |
Real number |
(0.1-19.7) |
|
Alkaline Phosphatase (Alkphos) |
Integer |
(63-2110) |
|
Alanine Aminotransferase (SGPT) |
Integer |
(10-2000) |
|
Asparatate Aminotransferase (SGOT) |
Integer |
(10-4929) |
|
Total Proteins (TP) |
Real number |
(2.7-9.6) |
|
Albumin(ALB) |
Real number |
(0.9-5.5) |
|
Albumin and Globulin Ratio (A/G) |
Real number |
(0.3-2.8) |
|
Classes used for the dataset |
Categorical |
(1,2) |
The ILPD dataset encompasses data points pertaining to liver function tests, including metrics like Total Bilirubin (TB), Direct Bilirubin (DB), Total Proteins (TP), Albumin (ALB), A/G ratio, as well as SGPT, SGOT, and Alkphos. The dataset consist of 583 patient records and this dataset includes records of 416 patients with liver issues and 167 patients without liver complications. These attributes represent basic blood tests utilized for gauging enzyme, protein, and bilirubin levels in the bloodstream, aiding in the identification of liver impairment. Proteins, essential for overall well-being, are large molecules, while enzymes act as crucial protein cells that facilitate vital chemical reactions within the body. Bilirubin assists in the breakdown and digestion of fats. The liver synthesizes crucial enzymes, namely ALT (SGPT), AST (SGOT) and ALP. ALT, AST, and ALP are specific liver enzyme tests employed to measure the levels of corresponding substances in the blood. Elevated ALT and AST levels may indicate potential liver damage, while heightened ALP levels might signal liver or bile duct harm.
Methodology
The methodology for liver disease prediction is described in this section. First of all, preprocessing is done. Records with missing data have been removed, and class balancing is done using SMOTE (Synthetic Minority Oversampling Techniques). SMOTE is an oversampling method that generates synthetic samples for the minority class, helping to mitigate the risk of bias in model training and improving performance metrics. Aim of using SMOTE is to reduce the negative effects of class imbalance and enhance the model’s ability to identify minority class instances accurately. Feature selection techniques have been utilized on the dataset to identify the relevant features, which help the classifier to reduce the execution time. After that hybrid model is developed using five classifiers DT, RF, AdaBoost, KNN and XGBoost. The model is trained using a training set to classify liver illness. Using performance parameters, the trained model is evaluated after being put to the test on the test set. The validation has been done by applying the 10-fold cross-validation. Figure 1 depicts the diagrammatic workflow of the proposed hybrid model.
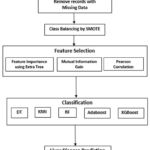 |
Figure 1: Proposed PC- RF Hybrid Model
|
Preprocessing Methods
The Accurate prediction of Liver Disease and Non-Liver Disease cases can certainly be affected by their unequal distribution in the dataset. First of all, missing values were removed then the dataset was balanced by SMOTE. SMOTE is an important preprocessing way in Machine Learning for dealing with class imbalance. This problem happens when one class in a classification problem has much fewer members than the other classes, resulting in a biased model that may underperform on the minority. Smote works by producing a synthetic sample for the minority class, thereby oversampling it to balance the distribution of the class26.
Feature Selection (FS)
It plays a significant role in classification problems and removes unnecessary & insignificant features from the dataset. This method chooses a part of all accessible features that are most significant and strongly impact the dependent variable for use in model construction27, 28. To increase efficiency and lower the cost of computing, the input features are reduced. Feature selection algorithms used in this research are described below:
Pearson Correlation Algorithms
Pearson correlation can be utilized to identify the strength and direction of the linear relationship between each feature and the target variable. Features that exhibit high absolute correlation coefficients with the target variable are typically regarded as more important. It serves as a valuable tool in feature selection, helping to identify predictive features, detect multicollinearity, rank features, and reduce dimensionality, which ultimately enhances the performance and interpretability of predictive models. This approach relies on the feature selection filter technique. Correlation serves as an indicator of the association between two features, with a numerical value ranging from -1 to 1. A stronger correlation implies a higher covariance between the variables, suggesting that alterations in one variable can more reliably predict changes in the other. This method identifies characteristics that exhibit a significant correlation with the target class29.
Feature Importance using Extra Tree classifier algorithms
Extra Trees-based feature importance analysis helps identify which features are most discriminative for predicting the target variable. It considers both the intrinsic importance of the feature and its contribution to the model’s identification performance. It is a method used in feature selection for machine learning tasks and constructs multiple decision trees & aggregates their predictions. Features are chosen using several decision trees. This algorithm takes as a parameter the number of trees used. The importance of various features is estimated using an ensemble of decision trees, and less significant features are discarded30.
Mutual Information Gain algorithms
Mutual information gain is commonly used in feature selection tasks, especially when dealing with both continuous and discrete features. It measures the dependency between each feature and the target variable, irrespective of the type of relationship (linear or nonlinear). It is a valuable metric used in feature selection to quantify the relationship between features and the target variable in a dataset. The efficiency of attributes in the categorization process is measured by information gain. The information gain value of each characteristic is computed, demonstrating the anticipated feature’s dependency on the specified characteristic. The values of information gain range from 0 to 1. It is a powerful tool for feature selection, especially in scenarios where non-linear relationships exist between features and the target variable and where feature redundancy needs to be addressed effectively31.
Pearson correlation coefficient measures linear relationships between variables, while mutual information gain captures any type of dependency between variables. Pearson correlation is typically used for continuous variables, while mutual information gain can handle both continuous and discrete variables. Feature Importance Using Extra Trees is specific to ensemble learning methods like Extra Trees. It considers the importance of features in the context of the entire model’s performance rather than just their individual relationships with the target variable.
Classification Algorithms
To predict liver disease, training data has been utilized to train the five ML models (DT, KNN, RF, AdaBoost, and XGboost), which are then used to predict outcomes from test data. The above algorithms are then put to the test against a few parameters, namely accuracy, precision, specificity, sensitivity, and F-Measure.
Decision Tree
The decision tree models are generally utilized for classification problems and belong to supervised learning. Decision Tree, first of all, measures the entropy for every feature of the data. Then dataset is divided with high information and less entropy on the variable. This technique is non-parametric and can be used with huge and complex data effectively in the absence of adopting a sophisticated framework. When the sample size is sufficient, the data from the research may be divided into training and validation. With the help of the training data set, a decision tree model can be developed, and a validation set of data can be used to determine an ideal tree size for the final model32.
K-Nearest Neighbour
This algorithm employs the supervised learning methodology. Based on the class of related data in the training data, the class of the input data is predicted. The neighbouring class of the input data is used to classify it. To identify the neighbour, we employ many techniques. The class of the test data is determined by the classes of the K-nearest neighbours of the input data. When determining neighbours, the Euclidean distance can be utilized if the dataset contains continuous variables. If dataset contains both continuous and categorical variables, hamming distance is used. Following the discovery of K-nearest neighbours, the majority class is used to forecast the class of data33.
Random Forest
It is a supervised classification method that builds multiple decision trees from subsets of the data. Each decision tree provides a prediction, and the final classification is determined by majority voting across all trees. RF divides the dataset into numerous subsets, which are used to create individual decision trees. These trees collectively create a model that resembles a forest, where each tree represents patterns and relationships in the data. It relies on decision boundaries created by individual decision trees to provide a robust and accurate classification34.
Adaptive Boosting
It is an ensemble learning strategy that merge a number of “weak” learners to increase the forecast accuracy of any given model. It works by giving examples that were erroneously classified more weight so that the future weak learners concentrate more on the challenging cases. Adaptive boosting is referred to as AdaBoost. Fundamentally, it is a first boosting prediction that is made for a double order that is actually effective. It is the best place to start while trying to increase intelligence. It is utilized when the DT is brief. Furthermore, the tree display from each preparatory event is used to create the main tree35.
Extreme Gradient Boosting
It is a scalable, networked ML technique for tree boosting. It is much faster in comparison to GBM. It is a mixer of hardware and software optimization techniques for giving the best performance utilize less computation resources in less execution time. It uses regularization ideas to escape overfitting problems. Before learning about the XGBoost, we must first grasp decision trees and ensemble learning36.
Performance Parameters
Multiple performance metrics can be assessed when evaluating a system. These metrics can be examined by determining the number of True Positives (TP), False Positives (FP), True Negatives (TN), and False Negatives (FN). When the model accurately forecast a person with a disease, it is considered a true positive. Conversely, if the system fails to predict the disease in someone who actually has it, it is a false negative. When the model correctly classifies an individual without the disease, it is a true negative. However, if the model incorrectly identifies a person without the disease as having it, it is a false positive37. Below are some commonly utilized performance parameters:
Accuracy
This parameter provides the percentage of correct prediction values out of the calculated total prediction values performed.

Sensitivity
Sensitivity can be represented as the True Positive Rate, and it can be defined as the ratio of true positive collection to the ratio of summation of true positive and false negative.

Specificity
Specificity is a parameter that helps evaluate the accuracy of negative identification. It evaluate the proficiency of a system to properly determine the negative instances.

Precision
Precision finds the system’s capability to obtain only pertinent results.

F–Measure
The F-Measure value is obtained by combining sensitivity and precision using a specific formula.

Results and Discussion
The results that were achieved by applying the feature selection techniques, namely Pearson Correlation, Feature Importance using Extra Trees classifier, and Mutual Information Gain with five classification algorithms DT, KNN, RF, AdaBoost, and XGboost on the ILPD dataset is depicted in Table 2.
Feature Selected by the Feature Importance using Extra Trees classifier Algorithms
Extra Trees for feature importance is a powerful method for identifying and selecting the most informative features in the dataset, which can enhance model performance and reduce overfitting. This Feature Selection method has chosen seven features Age, Alkphos, SGOT, TB, DB, SGPT, AG Ratio. This feature selection method has achieved accuracy by using the classifiers DT (77.67%), KNN (72.71%), RF (77.20%), Adaboost (73.69%), and XGBoost (76.47%).
Feature Selected by the Mutual Information Gain Algorithms
Feature selection using Mutual Information Gain involves calculating the MI between each feature and the target variable and selecting features with the highest MI scores. This process helps in identifying features that provide the most significant amount of information about the target variable. Feature selection method Mutual Information Gain has chosen only seven features Total Bilirubin, Direct Bilirubin, Alkphos, SGOT, Total Protein, ALB, AG Ratio. This feature selection method has achieved accuracy by using the classifiers DT (73.32%), KNN (71.62%), RF (77.07%), Adaboost (72.13%), and XGBoost (75.51%).
Feature Selected by the Pearson Correlation Algorithms
Pearson Correlation algorithms can be used to identify features that have strong correlations with the target variable. This feature selection method has selected only eight features Age, Total Bilirubin, Direct Bilirubin, Alkphos, SGPT, SGOT, ALB, AG Ratio which is most relevant for the model. This feature selection method has achieved accuracy by using the classifiers DT (77.80%), KNN (72.71%), Random Forest (80.34%), Adaboost (73.33%), and XGBoost (77.44%).
The performance of the models has been assessed through various metrics, namely Accuracy, Specificity, Precision, Sensitivity, and F-Measure. The results of DT, KNN, RF, Adaboost, and XGboost Algorithms with and without feature selection methods as described in Table 2. Random Forest model with the Pearson Correlation Feature Selection method turned out to be the most successful model.
Additionally, comparison of the outcome of the several models for based on accuracy after choosing the features is depicted in Figures 2, 3, 4, 5, and 6 which is one of the study’s most important aspects. Enhancement in accuracy of decision tree with feature selection methods is shown in Figure 2. Accuracy of this model is 77.80% with Pearson Correlation method and 75.51% without using feature selection method. KNN model’s accuracy enhancement is shown in Figure 3, where feature selection has led to better results by reducing the dimensionality of the data, thereby improving the model’s ability to identify nearest neighbours more effectively. Random Forest model’s accuracy is analysed in Figure 4.
Adaboost model’s accuracy is depicted in Figure 5, showing that feature Importance with extra tree has achieved the highest accuracy of 73.69% while without feature selection has achieved the accuracy of 72.97%. Typically, feature selection can improve the model’s accuracy by removing irrelevant or redundant features, resulting in a more streamlined and efficient learning process. XGBoost model’s accuracy has been compared in Figure 6, highlighting the differences when feature selection is applied. This model shows the highest accuracy of 77.44% with Pearson Correlation and 76.36% without feature selection for prediction of liver disease.
The results depict that the RF classifier, with the help of the Pearson Correlation feature selection method, has achieved the highest accuracy of 80% for the forecast of liver disease, and this proposed PC-RF model has achieved better accuracy in comparison to other classifiers. Additionally, it has been noted that the models’ accuracy has significantly risen when feature selection procedures are utilized.
Table 2: Comparison of Classification Algorithms with and without feature selection method
|
Classifier |
Feature Selection Method |
Accuracy |
Sensitivity |
Specificity |
Precision |
F-Measure |
|
Decision Tree |
Without Feature Selection |
75.51 |
70.77 |
80.19 |
70.77 |
74.27 |
|
Feature Importance using Extra Tree Algorithms |
77.67 |
79.95 |
75.36 |
79.95 |
78.15 |
|
|
Mutual Information Gain algorithms |
73.32 |
74.15 |
72.46 |
74.15 |
73.53 |
|
|
Pearson Correlation algorithms |
77.80 |
82.36 |
73.18 |
82.36 |
78.75 |
|
|
KNN |
Without Feature Selection |
71.87 |
53.62 |
90.09 |
84.41 |
65.58 |
|
Feature Importance using Extra Tree Algorithms |
72.71 |
82.36 |
63.04 |
69.02 |
75.11 |
|
|
Mutual Information Gain algorithms |
71.62 |
77.53 |
65.70 |
69.33 |
73.20 |
|
|
Pearson Correlation algorithms |
72.71 |
82.36 |
63.04 |
69.02 |
75.11 |
|
|
Random Forest |
Without Feature Selection |
77.32 |
68.84 |
85.74 |
82.84 |
75.19 |
|
Feature Importance using Extra Tree Algorithms |
77.20 |
78.01 |
76.32 |
76.72 |
77.36 |
|
|
Mutual Information Gain algorithms |
77.07 |
78.01 |
76.08 |
76.54 |
77.27 |
|
|
Pearson Correlation algorithms |
80.34 |
82.36 |
78.26 |
79.11 |
80.71 |
|
|
Adaboost |
Without Feature Selection |
72.97 |
65.21 |
80.67 |
77.14 |
70.68 |
|
Feature Importance using Extra Tree Algorithms |
73.69 |
83.33 |
64.00 |
69.83 |
75.99 |
|
|
Mutual Information Gain algorithms |
72.13 |
81.88 |
62.31 |
68.48 |
74.58 |
|
|
Pearson Correlation algorithms |
73.33 |
81.64 |
64.97 |
69.97 |
75.36 |
|
|
XGBoost
|
Without Feature Selection |
76.36 |
71.49 |
81.15 |
79.14 |
75.12 |
|
Feature Importance using extra Tree algorithms |
76.47 |
80.43 |
72.46 |
74.49 |
77.35 |
|
|
Mutual Information Gain algorithms |
75.51 |
77.05 |
73.91 |
74.70 |
75.86 |
|
|
Pearson Correlation algorithms |
77.44 |
78.74 |
76.08 |
76.70 |
77.71 |
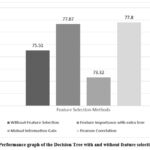 |
Figure 2: Performance graph of the Decision Tree with and without feature selection method
|
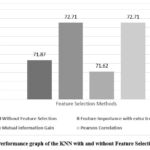 |
Figure 3: Performance graph of the KNN with and without Feature Selection method.
|
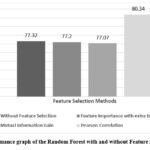 |
Figure 4: Performance graph of the Random Forest with and without Feature Selection method
|
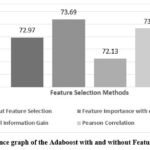 |
Figure 5: Performance graph of the Adaboost with and without Feature Selection Method. |
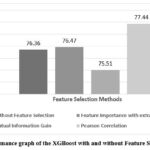 |
Figure 6: Performance graph of the XGBoost with and without Feature Selection Method.
|
Figures 2 to 6 indicate that the Pearson Correlation algorithm is the best feature selection method.
Figure 7 compares the accuracy-based performance of the classifiers using the Pearson Correlation technique that was identified as the best feature selection method. It depicts that RF has achieved more accuracy for identification of liver illness.
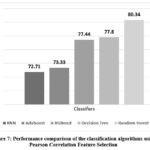 |
Figure 7: Performance comparison of the classification algorithms using Pearson Correlation Feature Selection
|
Table 3 provides a summary of research studies on machine learning methods for predicting liver illness using the ILPD. It compares different studies from 2018 to 2024, focusing on feature selection techniques, classifiers used, and the accuracy achieved. Most studies did not use feature selection, leading to moderate prediction accuracies ranging from 55% to 76%. These studies employed various classifiers like Naïve Bayes, Logistic Regression, Decision Trees, Support Vector Machines, and Random Forest. A few studies implemented feature selection methods which provided some improvement in accuracy. The proposed PC-RF model stands out by using Pearson Correlation for feature selection and Random Forest for classification, achieving a significantly higher accuracy of 80.34%. The results demonstrate the importance of selecting relevant features and using robust classifiers for better prediction performance.
In essence, the proposed PC-RF model shows a clear improvement over previous research, emphasizing the value of combining effective feature selection with a strong classifier.
Table 3: Comparison of the proposed Hybrid Model with the recent state-of-art work done by different researchers.
|
Study |
Year |
Feature Selection |
Classifier |
Accuracy% |
|
Muthuselvan8 |
2018 |
Not used |
Naïve Bayes, K-Star, J-48, Random Tree |
74.2% |
|
Abdalrada11 |
2019 |
Not used |
Logistic Regression |
72.4% |
|
Singh9 |
2019 |
Correlation-based |
Logistic Regression, SMO, IBK, J-48 and Random Forest |
74.36% |
|
Azam13 |
2020 |
Not used |
RF, Perceptron, DT, KNN, and SVM |
74% |
|
Naseem12 |
2020 |
Not used |
NB, MLP, CDT, Forest PA, J-48, RF, AIDE, SVM |
72% |
|
Geetha16 |
2021 |
Not used |
SVM and Logistic Regression |
75.04% |
|
Aryan14 |
2021 |
Not used |
GBM, ANN, KNN, DT, LR, RF, NB and SVM |
55% |
|
Gupta19 |
2022 |
Random Forest Feature Selection Methods |
Random Forest Tree and Light GB |
63% |
|
Jamila20 |
2022 |
Not used |
Naïve Bayes, Classification & Regression Tree and SVM |
71% |
|
Choubey 21 |
2023 |
Not used |
LR, Gaussian Naïve Bayes, Stochastic Gradient Descent, KNN, DT, RF and SVM |
75.1% |
|
Jiajun22 |
2023 |
Not used |
Logistic Regression, SVM, RF, KNN and Gradient Boosting |
73.56% |
|
Yasmin23 |
2023 |
Mutual Information and Kernel Principal Component Analysis |
KNN, SVM, RF, MLP and Ensemble classifier
|
76.03% |
|
Vardhan24 |
2024 |
Not used |
Logistic Regression & SVM |
72% |
|
Kumar25 |
2024 |
Not used |
LR, SVM, DT, KNN, RF |
75% |
|
Proposed PC-RF |
– |
Pearson Correlation |
Random Forest |
80.34% |
Figure 8 depicts the graphical comparison of the existing research work with proposed PC-RF model.
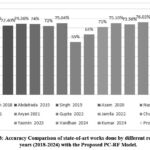 |
Figure 8: Accuracy Comparison of state-of-art works done by different researchers’ years (2018-2024) with the Proposed PC-RF Model.
|
The Indian Liver Patient Dataset (ILPD) offers valuable insights for liver disease prediction but several factors limit its applicability to broader or different populations. First, the dataset’s regional specificity sourced exclusively from North East Andhra Pradesh, India—reflects local environmental, dietary, and healthcare factors. Second, an imbalance in gender representation, with significantly more male than female records, could lead to gender-based biases, potentially impacting prediction accuracy for female patients. Furthermore, the dataset reflects healthcare practices specific to a single region, which may differ from those in other areas, may be impacting the generalizability of models to populations with varied diagnostic and healthcare protocols. Although modest in size, this dataset serves as an effective steppingstone, encouraging the integration of more diverse data sources to enhance model robustness and adaptability across various populations.
Conclusion
In this study, a PC-RF hybrid model has been employed to more accurately identify the liver disease. The result comparison of the DT, KNN, RF, AdaBoost, and XGBoost Algorithms has been done with the three feature selection methods, namely Pearson Correlation, Feature Importance using Extra Tree, and Mutual Information Gain. The experimental results depicts that the Pearson Correlation algorithm identified eight selected features from the dataset, which were contributing to an effective improvement in the model’s accuracy. The main findings also reveal that the accuracy of the model has been enhanced with the utilization of feature selection methods. Random Forest classifier in conjunction with the Pearson Correlation algorithm, was demonstrated to be the most adequate model for detecting liver disease. This proposed PC-RF Model has obtained the best accuracy of 3% to 8% among other classifiers such as DT, KNN, Adaboost, and XGboost. The results of the previously conducted research in this field has also been compared to the outcome of the proposed model, and the results indicate that the proposed model has provided greater accuracy. In the future, authors plan to expand this work by employing hybrid feature selection methods. Additionally, ensemble classification techniques may be utilized to further enhance the model’s accuracy in identifying liver illness.
Acknowledgement
The authors would like to express their gratitude to Maharishi Markandeshwar (Deemed to be University), Mullana-Ambala, for supporting and facilitating this research work.
Funding Sources
The author(s) received no financial support for the research, authorship, and/or publication of this article.
Conflict of Interest
The author(s) do not have any conflict of interest.
Date Availability Statement
The manuscript incorporates the dataset produced or examined throughout this research study.
Ethics Statement
This research did not involve human participants, animal subjects, or any material that requires ethical approval.
Informed Consent Statement
This study did not involve human participants, and therefore, informed consent was not required.
Clinical Trial Registration
This research does not involve any clinical trials
Author Contributions
Sunil Kumar: Conceptualization, Methodology, Analysis and Writing – Original Draft.
Pooja Rani: Visualization and Supervision.
All authors made a significant and equal contribution to this work.
References
- Asrani S.K., Devarbhavi H, Eaton J, Kamath PS. Burden of liver diseases in the world. J Hepatol. 2019; 70(1): 151-171.
CrossRef - Kim W.R., Brown R.S. Jr, Terrault N.A., El-Serag H. Burden of liver disease in the United States: summary of a workshop: Burden of liver disease in the United States: Summary of a workshop. Hepatology. 2002;36(1):227-242.
CrossRef - Idris, K., Bhoite, S., Applications of machine learning for prediction of liver disease. Int. J. Comput. Appl. Technol. Res, 2019; 8(9): 394-396.
CrossRef - Strohmeyer G, Weik C. Liver damage caused by drugs. Z Gastroenterol. 1999;37(5):367-378
- Forsyth D. Applied machine learning. Cham: Springer International Publishing. 2019; Jul 12.
CrossRef - Thirunavukkarasu K, Singh A.S., Irfan M., Chowdhury A. Prediction of Liver Disease using Classification Algorithms. In: 2018 4th International Conference on Computing Communication and Automation (ICCCA). IEEE; 2018.
CrossRef - Auxilia LA. Accuracy prediction using machine learning techniques for Indian patient liver disease. In: 2018 2nd International Conference on Trends in Electronics and Informatics (ICOEI). IEEE; 2018.
CrossRef - Muthuselvan, S., Rajapraksh, S., Somasundaram, K., & Karthik, K., Classification of liver patient dataset using machine learning algorithms. Int. J. Eng. Technol, 2018; 7(3.34): 323.
CrossRef - Singh J., Bagga S., Kaur R. Software-based prediction of liver disease with feature selection and classification techniques. Procedia Comput Sci. 2020;167:1970-1980.
CrossRef - Joloudari J.H., Saadatfar H., Dehzangi A., Shamshirband S. Computer-aided decision-making for predicting liver disease using PSO-based optimized SVM with feature selection. Inform Med Unlocked. 2019;17(100255):100255.
CrossRef - Abdalrada A.S., Yahya O.H., Alaidi A.H.M., Hussein N.A., Alrikabi H.T., Al-Quraishi TAQ. A predictive model for liver disease progression based on logistic regression algorithm. Periodicals of Engineering and Natural Sciences. 2019;7(3):1255-1264.
CrossRef - Naseem R., Khan B., Shah M.A. Performance assessment of classification algorithms on early detection of liver syndrome. J Healthc Eng. 2020;2020:6680002.
CrossRef - Azam, M. S., Rahman, A., Iqbal, S. H. S., & Ahmed, M. T., Prediction of liver diseases by using few machine learning based approaches. Aust. J. Eng. Innov. Technol, 2020; 2(5): 85-90.
CrossRef - Aryan P. A study of Machine Learning algorithms to predict liver. International Journal of Advanced Research. Published online 2021:135-139.
- Ghosh M., Mohsin Sarker Raihan M., Raihan M.. A comparative analysis of machine learning algorithms to predict liver disease. Intell Autom Soft Comput. 2021;30(3):917-928.
CrossRef - Geetha C., Arunachalam A.R. Evaluation based Approaches for Liver Disease Prediction using Machine Learning Algorithms. In: 2021 International Conference on Computer Communication and Informatics (ICCCI). IEEE; 2021.
CrossRef - Choudhary R., Gopalakrishnan T., Ruby D., Gayathri A., Murthy V.S., Shekhar R. An Efficient Model for predicting liver disease using machine learning. Data Analytics in Bioinformatics: A Machine Learning Perspective. Published online 2021:443-457.
CrossRef - Alsharaiah, M. A., BANIATA, L. H., Aladwan, O. M. A. R., AbuaAlghanam, O., Abushareha, A. A., Abuaalhaj, M., … & Baniata, M. O. H. A. M. M. A. D., Soft voting machine learning classification model to predict and expose liver disorder for human patients. J. Theor. Appl. Inf. Technol, 2022; 100: 4554-4564.
- Gupta K., Jiwani N., Afreen N., Divyarani. Liver Disease Prediction using Machine learning Classification Techniques. In: 2022 IEEE 11th International Conference on Communication Systems and Network Technologies (CSNT). IEEE; 2022.
CrossRef - Jamila G., Wajiga G.M., Malgwi Y.M., Maidabara A.H. A diagnostic model for the prediction of liver cirrhosis using machine learning techniques. Comput sci IT res j. 2022;3(1):36-51.
CrossRef - Choubey D.K., Dubey P., Tewari B.P., Ojha M., Kumar J. Prediction of Liver Disease Using Soft Computing and Data Science Approaches. In: 6G Enabled Fog Computing in IoT: Applications and Opportunities. Springer; 2023:183-213.
CrossRef - Lu J. Research on Prediction of Liver Disease Based on Machine Learning Models. Highlights in Science, Engineering and Technology. 2023;68:21-28.
CrossRef - Yasmin R., Amin R., Reza M.S. Design of Novel Feature Union for Prediction of Liver Disease Patients: A Machine Learning Approach. In: The Fourth Industrial Revolution and Beyond: Select Proceedings of IC4IR+2023; PP. Springer; :515-526.
CrossRef - Vardhan H., Babu D.K.R., Raju G.L. Prediction of liver disease in patients using logistic regression of machine learning. Int J Res Publ Rev. 2024;5(5):4287-4292.
CrossRef - Kumar N. Evaluation based approaches for Liver Disease detection using Machine Learning Algorithms. International Research Journal of Modernization in Engineering Technology and Science. Published online 2024:598-602.
- Maldonado S., López J., Vairetti C. An alternative SMOTE oversampling strategy for high-dimensional datasets. Appl Soft Comput. 2019;76:380-389.
CrossRef - Yang J., Honavar V. Feature subset selection using a genetic algorithm. IEEE Intell Syst. 1998;13(2):44-49.
CrossRef - Guyon I., Elisseeff A. An introduction to variable and feature selection. Journal of machine learning research. 2003;3:1157-1182.
- Mei K., Tan M., Yang Z., Shi S. Modeling of feature selection based on random forest algorithm and Pearson correlation coefficient. J Phys Conf Ser. 2022;2219(1):012046.
CrossRef - Md, A. Q., Kulkarni, S., Joshua, C. J., Vaichole, T., Mohan, S., & Iwendi, C., Enhanced preprocessing approach using ensemble machine learning algorithms for detecting liver disease. Biomedicines, 2023; 11(2): 581.
CrossRef - Lamba R., Gulati T., Jain A. A hybrid feature selection approach for Parkinson’s detection based on mutual information gain and recursive feature elimination. Arab J Sci Eng. 2022;47(8):10263-10276.
CrossRef - Song Y.Y., Lu Y. Decision tree methods: applications for classification and prediction. Shanghai Arch Psychiatry. 2015;27(2):130-135.
- Haq, A. U., Li, J. P., Memon, M. H., Nazir, S., & Sun, R., A hybrid intelligent system framework for the prediction of heart disease using machine learning algorithms. Mobile information systems, 2018; 1-21.
CrossRef - Boateng E.Y., Otoo J., Abaye D.A. Basic tenets of classification algorithms K-nearest-neighbor, support vector machine, random forest and neural network: A review. J Data Anal Inf Process. 2020;08(04):341-357.
CrossRef - Xiao L., Dong Y., Dong Y. An improved combination approach based on Adaboost algorithm for wind speed time series forecasting. Energy Convers Manag. 2018;160:273-288.
CrossRef - Kiangala S.K., Wang Z. An effective adaptive customization framework for small manufacturing plants using extreme gradient boosting-XGBoost and random forest ensemble learning algorithms in an Industry 4.0 environment. Mach Learn Appl. 2021;4(100024):100024.
CrossRef - Koutsoukas, A., Monaghan, K. J., Li, X., & Huan, J., Deep-learning: investigating deep neural networks hyper-parameters and comparison of performance to shallow methods for modeling bioactivity data. Journal of cheminformatics, 2017; 9: 1-13.
CrossRef
Abbreviations
|
DT |
Decision Tree |
KNN |
K-Nearest Neighbour |
|
RF |
Random Forest |
Adaboost |
Adaptive Boosting |
|
XGboost |
Extreme Gradient Boosting |
LR |
Logistic Regression |
|
NB |
Naïve Bayes |
J-48 |
Decision Tree |
|
PSO |
Particle Swarm Optimization |
MLP |
Multi Layer Perception |
|
CDT |
Credal Decision Tree |
GBM |
Gradient Boosting Machine |
|
ANN |
Artificial Neural Network |
SVM |
Support Vector Machine |
|
Forest PA |
Forest by Penalizing Attributes |
Chirp |
Composite Hypercube on Iterated Random Projection
|
|
TP |
Total Protein |
TB |
Total Bilirubin |
|
ALB |
Albumin |
DB |
Direct Bilirubin |
|
SGPT |
Alanine Aminotransferase |
A/G Ratio |
Albumin and Globulin Ratio |
|
Alkphose |
Alkaline Phosphatase |
SGOT |
Asparatate Aminotransferase |
|
SMOTE |
Synthetic Minority Oversampling Techniques |
TP |
True Positive |
|
FP |
False Positive |
TN |
True Negative |
|
FN |
False Negative |
ILPD |
Indian Liver Patients Dataset |
|
LD |
Liver Disease |
ML |
Machine Learning |
|
PC |
Pearson Correlation |
FS |
Feature Selection |


