
Muhammad Reza Primaguna1 , Haerani Rasyid2, Makbul Aman3, Syakib Bakri2, Hasyim Kasim2, Harun Iskandar1, Ressy Dwiyanti4, Ade Rifka Junita5, Ridwan Ridwan6, Rizki Amelia Noviyanthi5, Nur Indah Purnamasari5,7 and Mochammad Hatta5
1Department of Internal Medicine, Faculty of Medicine, Hasanuddin University, Makassar, Indonesia
2Nephrology and Hypertension Division, Department of Internal Medicine, Faculty of Medicine, Hasanuddin University, Makassar, Indonesia
3Endocrine and Metabolic Division, Department of Internal Medicine, Faculty of Medicine, Hasanuddin University, Makassar, Indonesia
4Department of Microbiology, Faculty of Medicine, Tadulako University, Palu, Indonesia
5Department of Biology and Immunology, Faculty of Medicine, Hasanuddin University, Makassar, Indonesia
6Mappa Oudang Nursing Academy, Makassar, Indonesia
7Department of Obstetrics and Gynecology, Faculty of Medicine, Haluoleo University, Kendari, Indonesia
Corresponding Author E-mail:hattaram@yahoo.com
DOI : https://dx.doi.org/10.13005/bpj/2963
Abstract
Background: A high fat diet (HFD)is one of the main causes of obesity and is closely linked to metabolic disorders brought on by stress and malfunctioning tissues. Propolis (Trigona Honey) is considered to be helpful in treating inflammatory diseases because it has also been demonstrated to have anti-inflammatory and anti-free radical properties. This study to demonstrate how much propolis supplementation affects BW, NF-κB, CysC, and ACE2 levels in Wistar rats (Rattus norvegicus) fed a HFD. Methods: Post-test and control group designs in an experimental setup. A total of twenty-four rats were randomly assigned to four groups of six. Group I received a normal diet for sixteen weeks (ND), Group II received a high fat diet (HFD) for sixteen weeks (HFD), Group III received an HFD for sixteen weeks plus propolis for eight weeks (HFD-8), and Group IV received an HFD and propolis for sixteen weeks (HFD-16). Using the Enzyme-Linked Immunosorbent Assay (ELISA), body weight (BW), serum NF-κB, Cys C, and ACE2 levels were measured before treatment (week 0), after 8 weeks of HFD (HFD-8) (week 8), and after 16 weeks of HFD (HFD-16). Results: The mean starting weight in the ND, HFD, HFD-8, and HFD-16 groups did not differ significantly (p > 0.001). By week eight, the HFD group's body weight had increased considerably (254.83 grams vs. 202.0 grams) in comparison to the ND group (p<0.001). The HFD and HFD-8 groups' body weight increased significantly at week 16 in comparison to the ND group (334.83 grams and 269.50 grams vs. 208.67 grams) (p<0.001). At week 16, there was no discernible difference in mean BW between ND and HFD-16 (p > 0.001). There was no significant difference found in the mean initial NF-κB levels between the ND, HFD, HFD-8, and HFD-16 groups (p > 0.001). At week 8, NF-κB levels in the HFD group were significantly higher (5,038 ng/ml vs. 3,655 ng/ml) (p<0.001) than in the ND group. At week 16, NF-κB levels in the HFD and HFD-8 groups were notably higher than those in the ND group (p<0.001), at 6,136 ng/ml and 4,378 ng/ml, respectively, compared to 3,775 ng/ml. Between ND and HFD-16, there was no significant distinction in the mean NF-κB levels at week 16 (p>0.001). There was no significant difference observed in the mean CysC and ACE2 between the ND, HFD, HFD-8, and HFD-16 groups (p > 0.001). CysC and ACE2 levels in the HFD group were significantly higher than those in the ND group at week 8, and in the HFD and HFD-8 groups, they were significantly higher than those in the ND group at week 16. When propolis is administered for eight weeks, the rise in BW, NF-κB, CysC, and ACE2 is suppressed until the eighth week, at which point it increases once more until the sixteenth week. Propolis administration, however, will halt the rise in BW, NF-κB, CysC, and ACE2 until the sixteenth week. Conclusion: Propolis administration for 16 weeks can suppress the increase in BW, LI, RI, NF-κB, CysC and ACE2 levels in rats given a high fat diet (HFD).
Keywords
ACE2; Body Weight (BW); CysC; High fat diet (HFD); Lee Index; NF-κB; Obesity; Propolis (Trigona Honey); Rohrer Index; Wistar rat (Ratus Norvegicus)
Download this article as:| Copy the following to cite this article: Primaguna M. R, Rasyid H, Aman M, Bakri S, Kasim H, Iskandar H, Dwiyanti R, Junita A. R, Ridwan R, Noviyanthi R. A, Purnamasari N. I, Hatta M. The Strong Effect of Propolis in Suppressing NF-κB, CysC, and ACE2 on a High-fat Diet. Biomed Pharmacol J 2024;17(3). |
| Copy the following to cite this URL: Primaguna M. R, Rasyid H, Aman M, Bakri S, Kasim H, Iskandar H, Dwiyanti R, Junita A. R, Ridwan R, Noviyanthi R. A, Purnamasari N. I, Hatta M. The Strong Effect of Propolis in Suppressing NF-κB, CysC, and ACE2 on a High-fat Diet. Biomed Pharmacol J 2024;17(3). Available from: https://bit.ly/3X86dfU |
Introduction
Obesity is found in adults, adolescents and children. Over 1.9 billion adults worldwide are overweight, and over 650 million adults are obese. According to the WHO, obesity results in the death of 2.8 million adults annually.1 Nationally, data from the 2018 National Health Research (Riskesnas) of Indonesia showed that 26.6 percent of the adult population aged over 18 years had central obesity and shows a rapid increase from 2007 where the population experiencing central obesity reached 18.8 percent. South Sulawesi, Indonesia is one of 18 provinces with the highest prevalence of central obesity.2
One of the dominant causes of obesity is a high fat diet, where the amount of a high fat diet correlates strongly with the degree of obesity.3 Obesity contributes to the risk for several diseases, such as cancer, metabolic syndrome, cardiovascular disease, hypertension, and diabetes, and decreases the body’s defenses and immune system.4 and is a major contributor to the risk of kidney diseases, such as chronic kidney disease (CKD).5,6
Metabolic diseases caused by stress and dysfunction of tissues are strongly associated with obesity. Obesity can cause the body to react in various ways, such as producing more T helper 1 and 17, which in turn trigger the inflammatory process by producing proinflammatory cytokines like IL6, IL-2, and IFNγ.7,8
By increasing metabolic rate and renal tubular reabsorption, obesity may increase the possibility of developing CKD in its earliest phases. This results in compensatory renal vasodilatation, glomerular hyperfiltration, elevated glomerular capillary pressure, and glomerular hypertrophy. Although the altered renal hemodynamics and increased glomerular filtration rate (GFR) initially compensate the increased tubular reabsorption and allowed a balance between salt and water intake and output, which must be maintained, gradually increasing mechanical stress on the glomerular capillaries may lead to slow injury development.9,10
Several studies have been done in traditional herbal medicine including Propolis.11,12,13,14,15,16,17,18 Propolis is useful in the world of health with various therapeutic effects including anti-inflammatory, antioxidant, anticarcinogenic, antibacterial, antifungal, antiprotozoal, antiviral, antidiabetic.19,20 Flavonoids are one of the main compounds involved in this function.21 Several previous studies on the compounds found in propolis have yielded similar levels of accuracy in identifying the presence of phenolic compounds in propolis using the HPLC-MS/MS and HPLC-UV methods.22 Similarly, the literature has described a few of propolis’s biological activities as well as those of its isolated compounds.23
Furthermore, an evaluation of the potential bioactive compounds and antioxidant activity of propolis which contains phenolic and flavonoid compounds has been carried out. The results showed a high total phenolic and flavonoid content.24 Fifty-nine phenolic compounds were found and quantified in the hydroalcoholic propolis extract using a novel targeted HPLC-PDA-ESI/MS method, which also demonstrated the antioxidant activity of propolis samples.25
Analysis of phenolic compounds (flavonoids and phenolic acid derivatives) in propolis using HPLC-MS/MS is the main active constituent of the propolis resin fraction and Propolis ethanol extracts from Spain, Argentina and Italy indicate approximately the same total ion chromatogram (TIC) profile, according to an analysis of flavonoids from propolis using online HPLC-electrospray mass spectrometry.26.27 Overall, several previous studies show that phenolic compounds and their derivatives are the main active components of propolis.
Propolis has also been proven to be a potential anti-inflammatory agent and an agent for reducing the production of free radicals so it is thought to be useful for treating inflammatory diseases.28 In in vivo tests to see the benefits of propolis on the respiratory system in mice’s defence against cigarette smoke and propolis administration was found to be able to restore the levels of antioxidant enzymes such as glutathione peroxidase, superoxide dismutase, and catalase, as well as biochemical markers of inflammation and oxidative stress such as nitrite and myeloperoxidase.29
NF-κB is a key player in the regulation of inflammation and has been linked to metabolic abnormalities like obesity.30 NF-κB achieves this by encouraging the production of several pro-inflammatory genes. As a well-studied modulator of inflammation and immunity, the NF-κB pathway relates the inflammatory and metabolic responses in obesity and serves as a starting point for a more comprehensive understanding of metabolic disorders and the development of novel therapeutic approaches.31
Furthermore, NF-κB has strongly related to inflammatory processes in musculoskeletal injury and acne vulgaris via activated Toll-like receptor17; infectious diseases32 and inflammation causing the progression of cardiovascular damage by Doxorubicin induction.33
It has been demonstrated that serum CysC is an early and reliable biomarker of chronic kidney disease (CKD). This is especially useful for patients for whom elevated creatinine is not a suitable marker or for whom more sophisticated glomerular filtration rate (GFR) measurement techniques are not feasible.34
The renin-angiotensin system (RAS) pathway produces the inflammatory hormone ACE2, which is secreted by excess adipose tissue in obesity. Insulin resistance and obesity are closely linked to RAS activity. Furthermore, RAS function is modulated by oxidative stress, inflammatory responses, and mitochondrial dysfunction. When RAS function is compromised, the detrimental processes stated above cause widespread dysfunction in the majority of tissues.35,36
The purpose of this study is to find out the extent to which propolis affects the following parameters: body weight (BW), NF-κB, CysC, Rohrer Index (RI), and ACE2 levels in Wistar rats (Ratus norvegicus) fed a high-fat diet (HFD)
Methods
Animal experiment
This type of research is an experimental study that uses a control group and a post-test design. A total of thirty rats were split into five groups at random, with the same number (n=6) in each group. The experimental animal groups were divided into three groups: group I received a normal diet (ND-0) for two weeks, group II received a high-fat diet (HFD-8) for eight weeks, and group III served as the control. were given a normal diet for eight weeks (ND-8), group IV received a high-fat diet for sixteen weeks (HFD-16), and group V received a normal diet for sixteen weeks (ND-16).
All experimental animals have free access to food and drink (ad libitum). Weight measurements were carried out every week in order to know the increase in body weight of each rat. In each group, blood samples were taken by intravenous to determine NF-κB , CysC and ACE2 levels.
Obese rats
Male Wistar strain white rats (Rattus norvegicus) that have been fed a high-fat diet (HFD) are referred to as obese rats. The Lee’s index and the Rohrer’s index were used to calculate the obesity of rats. If the Rohrer index is more than 30 and the Lee index is more than 300, mice are considered obese.37 A high-fat diet, defined as one that contains the following macronutrient composition: 4.1% ash/minerals, 21.4% fat, 50% carbohydrates, 3.5% fibre, and 7.5% protein, has been shown to induce weight gain and/or obesity.36,38
Propolis Treatment
The propolis is part of Trigona Honey, obtained from beekeeping in the Masamba subdistrict, South Sulawesi, Indonesia, and then through honey processing. In this place, the process is through settling, filtering, and then it is obtained into Trigona honey in Medicinal Plants Laboratory of Hasanuddin University Research Center, Indonesia.18,19 The dose of Propolis according to the previous study is 0.27 ml.18 The dose of Propolis in this study is 0.27 ml per oral every day for 8 weeks for Group HFD-8 and 16 weeks for Group HFD-16. The dose of Propolis according to the previous study is 0.27 ml. The dose of Propolis in this study is 0.27 ml per oral every day for 8 weeks for Group HFD-8 and for 16 weeks for Group HFD-16.
Examination of NF-κB, CysC and ACE2 levels using the ELISA.
Using a 19–21 gauge tail intravenous needle, 0.5 ml of blood was drawn. The blood was then placed in a sample tube, and the serum was separated using a 500x rpm centrifuge.
Using the Enzyme Linked-Immunosorbent Assay (ELISA) Technique, the levels of CysC, ACE2, and NF-κB protein were examined. Before use, the serum from the intravenous rat samples was taken out of the -80oC freezer and placed on ice. To ensure that the ELISA results were valid, each sample was duplicated. The first step involved filling each well with 100 µL of Assay Diluent that contained protein buffer. Next, each well received 100 µL of Standard solution, which contained diluted samples from rat serum or recombinant rat NF-κB targets from the established kit.
Next, it was incubated at room temperature for two hours. After filling each well with the liquid, rinse with sterile PBS. We did this washing procedure four times in a row. Each well was then filled with 200 µL of conjugate liquid containing streptavidin HRP, covered with a plastic cover, and allowed to incubate for two hours at room temperature. The liquid was drawn in, and four more times, sterile PBS was used for washing. The following procedure involved adding 200 µL of TMB-containing Substrate Solution to each well, which was then read using an ELISA Reader 270 (Biomerieux, France).11
Data analysis
A significance level of ≤ 0.001 was applied to all data analyses performed using SPSS version 25.0. Figures, tables, and narratives will be utilized for presenting the results of the analysis.
To assess differences in BW, LI, RI, NF-κB, CysC and ACE2 levels between groups given Propolis, HFD and ND, a one-way ANOVA test was used. To determine the correlation between duration of Propolis administration and BW, LI, RI, NF-κB, CysC,and ACE2, the Pearson correlation test is used. The correlation between the Propolis group and BW, LI, RI, NF-κB, CysC, and ACE2 was determined using the same test.
Result
Effect of Propolis on increasing BW on HFD
Table 1 shows the effect of giving Propolis for both 8 weeks and 16 weeks on BW in Wistar rats (Rattus Norvegicus) model with HFD compared to ND. At the beginning of the study, weight was measured (week 0) and then measurements were carried out at week 8 (week 8) and week 16 (week 16).
The initial mean weight in the ND group was 197.83 grams and increased to 202.00 grams at week 8 and 208.67 grams at week 16. There was no significant increase in weight in the ND group between weeks 0 and 8 or 16 (p >0.001).
On the other hand, there was a noteworthy increase in body weight (p<0.001) in the HFD group from weeks 0–8. The initial mean weight in the HFD group was 198.50 grams, then increased to 254.83 grams at week 8 and 334.83 grams at week 16 (Table 1).
In the HFD group with 8 weeks of Propolis administration, the initial mean BW was 197.33 grams and 214.33 grams at week 8. At week eight, there was not a significant increase (p >0.001) in BW between the pre-and post-8 weeks of propolis administration (HFD-8). The average body weight (BW) of the HFD-8 group at week 16 was 269.50 grams, and the BW of the HFD group increased significantly (p<0.001) between weeks 0 and 16 and between weeks 8 and 16 after receiving 8 weeks of propolis (HFD-8).
Furthermore, there was not a significant increase in body weight (197.67 grams vs. 223.83 grams) between weeks 0 and 8 in the HFD-16 group that received propolis. Between week 0 and week 16, the mean body weight (BW) of the HFD-16 group increased significantly (p<0.001), from 197.67 grams to 223.83 grams. But in the HFD-16 group, there was not a significant increase in mean BW between weeks 8 and 16 (214.67 grams vs. 223.83 grams) (p>0.001). (Table 1)
Table 1: Effect of Propolis on BW in HFD.
|
Group |
Time |
BW (gram) |
|
|
mean ± SD |
p value |
||
|
Normal Diet |
Week 0 vs 8 |
197.83 ± 2.31 vs 202.0 ± 3.74 |
>0.001 |
|
Week 0 vs 16 |
197.83 ± 2.31 vs 208.67 ± 6.83 |
>0.001 |
|
|
Week 8 vs 16 |
202.00 ± 3.74 vs 208.67 ± 6.83 |
>0.001 |
|
|
HFD |
Week 0 vs 8 |
198.50 ± 3.14 vs 254.83 ± 28.18 |
<0.001 |
|
Week 0 vs 16 |
198.50 ± 3.14 vs 334.83 ± 11.94 |
<0.001 |
|
|
Week 8 vs 16 |
254.83 ± 8.18 vs 334.83 ± 11.94 |
<0.001 |
|
|
HFD + Propolis |
Week 0 vs 8 |
197.33 ± 1.86 vs 214.33 ± 7.73 |
>0.001 |
|
Week 0 vs 16 |
197.33 ± 1.86 vs 269.50 ± 9.33 |
<0.001 |
|
|
Week 8 vs 16 |
214.33 ± 7.73 vs 269.50 ± 9.33 |
<0.001 |
|
|
HFD + Propolis |
Week 0 vs 8 |
197.67 ± 3.88 vs 214.67 ± 7.60 |
>0.001 |
|
Week 0 vs 16 |
197.67 ± 3.88 vs 223.83 ± 11.01 |
<0.001 |
|
|
Week 8 vs 16 |
214.67 ± 7.60 vs 223.83 ± 11.01 |
>0.001 |
|
p value <0.001 is significant different
The pattern of BW increase following HFD, HFD + Propolis for 8 weeks (HFD-8) and HFD + Propolis for 16 weeks (HFD-16) is shown in Figure 1 starting from the study’s beginning (week 0), week 8, and week 16. The HFD group’s weight increased significantly between weeks eight and sixteen. The ND group’s weight did not significantly increase between weeks eight and sixteen. Meanwhile, an increase in weight was found in the HFD-8 group that was in line with the ND group. and HFD-16 at week 8, but by week 16 there had been a significant increase in weight. However, the increase in weight at week 16 was lower than with HFD. In contrast, the HFD-16 group shown an increase that was almost in line with the ND group both at week 8 and week 16. Between the beginning of the study and weeks eight and sixteen, there was not a significant increase in the ND group.
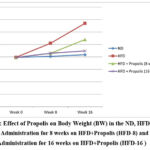 |
Figure 1: Effect of Propolis on Body Weight (BW) in the ND, HFD groups, Propolis Administration for 8 weeks on HFD+Propolis (HFD-8) and Propolis Administration for 16 weeks on HFD+Propolis (HFD-16 ) |
Table 2 shows the effect of giving Propolis for both 8 weeks and 16 weeks on the LI in Wistar rats (Rattus Norvegicus) model with HFD compared to ND. LI was measured in week 0 of the study, and further measurements were carried out in weeks 8 and 16 of the study.
In the ND group, the mean LI started at 222.00 and increased to 234.00 at week 8 and 250.00 at week 16. There was no statistically significant increase in LI in the ND group between weeks 0 and 8 or 16 (p>0.001).
In contrast, the HFD group shown a significant increase in LI between weeks 0, 8 and/or week 16 (p<0.001). The initial mean LI in the HFD group was 220.00, then increased to 335.00 at week 8 and 375.00 at week 16 (Table 2).
The initial mean LI in the HFD group receiving 8 weeks of Propolis was 222.00, and at week 8, it was 258.00. At week eight, there was not a significant increase in LI (HFD-8) between pre- and post-8 weeks of propolis (p>0.001). At week 16, the HFD-8 group’s average LI was 310.00. The LI in the HFD group significantly increased (p<0.001) between weeks 0 and 16 and between weeks 8 and 16 following the administration of 8 weeks of propolis (HFD-8).
Furthermore, there was not a significant increase in LI between weeks 0 and 8 in the HFD-16 group that received propolis administration for 16 weeks (221.00 vs 257.00). Between week 0 and week 16, the HFD-16 group’s mean LI significantly increased (221.00 vs. 272.00) (p<0.001). Nonetheless, the HFD-16 group’s mean LI did not see an increase significantly between weeks 8 and 16 (257.00 vs. 272.00) (p>0.001). (Table 2)
Table 2: Effect of Propolis on Lee Index (LI) in HFD
|
Group |
Time |
Lee Index |
|
|
mean ± SE |
p value |
||
|
Normal Diet |
Week 0 vs 8 |
222.00 ± 12.00 vs 234.00 ± 13.00 |
>0.001 |
|
Week 0 vs 16 |
222.00± 12.00 vs 250.00 ± 19.00 |
>0.001 |
|
|
Week 8 vs 16 |
234.00 ± 13.00 vs 250.00 ± 19.00 |
>0.001 |
|
|
HFD |
Week 0 vs 8 |
220.00 ± 21.00 vs 335.00± 24.00 |
<0.001 |
|
Week 0 vs 16 |
220.00 ± 21.00 vs 375.00± 13.00 |
<0.001 |
|
|
Week 8 vs 16 |
335.00± 24.00 vs 375.00± 13.00 |
<0.001 |
|
|
HFD + Propolis |
Week 0 vs 8 |
222.00± 15.00 vs 258.00± 27.00 |
>0.001 |
|
Week 0 vs 16 |
222.00± 15.00 vs 310.00± 14.00 |
<0.001 |
|
|
Week 8 vs 16 |
258.00± 27.00 vs 310.00± 14.00 |
<0.001 |
|
|
HFD + Propolis |
Week 0 vs 8 |
221.00± 17.00 vs 257.00± 13.00 |
>0.001 |
|
Week 0 vs 16 |
221.00± 17.00 vs 272.00± 15.00 |
<0.001 |
|
|
Week 8 vs 16 |
257.00± 13.00 vs 272.00± 15.00 |
>0.001 |
|
p value <0.001 is significant different
Figure 2 shows the pattern of increasing LI after administering HFD, HFD + Propolis for 8 weeks (HFD-8), and HFD + Propolis for 16 weeks (HFD-16) beginning at the beginning of the study (week 0), week 8, and week 16. In the HFD group, LI increased significantly between weeks eight and sixteen. From week 8 to week 16, the ND group did not show a statistically significant increase in LI. Meanwhile, in the HFD-8 group, an increase in LI was seen which was in line with the ND group. and HFD-16 at week 8, but then the increase in LI was quite sharp at week 16. However, the increase in LI at week 16 was lower than with HFD. In contrast, the HFD-16 group shown an increase that was almost in line with the ND group both at week 8 and week 16. In the ND group there was no significant increase seen from the start of the study until week 8 and week 16. Overall, the pattern of LI increase in line with the increase in BW based on the length of administration of Propolis.
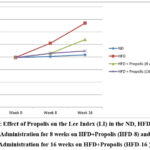 |
Figure 2: Effect of Propolis on the Lee Index (LI) in the ND, HFD groups, Propolis Administration for 8 weeks on HFD+Propolis (HFD-8) and Propolis Administration for 16 weeks on HFD+Propolis (HFD-16 ) |
Table 3 shows the effect of giving Propolis for both 8 weeks and 16 weeks on the RI in the Wistar rat (Rattus Norvegicus) model with a HFD compared to a ND. RI was measured in week 0 of the experiment, and additional measurements were performed in weeks 8 and 16 of the study. The initial mean RI in the ND group was 27.340 and increased to 29.28 at week 8 and 30.55 at week 16. In the ND group there was no significant increase in RI between week 0, week 8 and/or week 16 (p>0.001).
RI increased significantly (p<0.001) in the HFD group between weeks 0–8 and/or 16 in contrast. In the HFD group, the mean RI started at 27.25 and was up to 51.58 at week 8 and 62.87 at week 16 (Table 3).
The initial mean RI in the HFD group receiving 8 weeks of Propolis administration was 27.34, and at week 8, it was 30.29. At week eight (p>0.001), there was not a significant increase in RI between the pre- and post-8 weeks of propolis administration (HFD-8). At week 16, the HFD-8 group’s average RI was 44.74, and after receiving 8 weeks of propolis (HFD-8), the HFD group’s RI significantly increased between week 0 and 16 and between week 8 and 16.
Moreover, there was not a significant increase in RI between weeks 0 and 8 in the HFD-16 group that received propolis administration for 16 weeks (27.29 vs 30.33). Between week 0 and week 16, the mean RI in the HFD-16 group increased significantly (27.29 vs 32.82) (p<0.001). Nonetheless, the HFD-16 group’s mean RI was not found to increase significantly between week 8 and 16 (30.33 vs 32.82) (p>0.001). (Table 3)
Table 3: Effect of Propolis on RI in HFD
|
Group |
Time |
Rohrer Index |
|
|
mean ± SE |
p value |
||
|
Normal Diet |
Week 0 vs 8 |
27.34 ± 1.82 vs 29.28 ± 1.41 |
>0.001 |
|
Week 0 vs 16 |
27.34 ± 1.82 vs 30.55 ± 1.33 |
>0.001 |
|
|
Week 8 vs 16 |
29.28 ± 1.41 vs 30.55 ± 1.33 |
>0.001 |
|
|
HFD |
Week 0 vs 8 |
27.25 ± 1.27 vs 51.58 ± 2.20 |
<0.001 |
|
Week 0 vs 16 |
27.25 ± 1.27 vs 62.87 ± 1.44 |
<0.001 |
|
|
Week 8 vs 16 |
51.58 ± 2.20 vs 62.87 ± 1.44 |
<0.001 |
|
|
HFD + Propolis |
Week 0 vs 8 |
27.34 ± 1.59 vs 30.29 ± 1.27 |
>0.001 |
|
Week 0 vs 16 |
27.34 ± 1.59 vs 44.74 ± 1.38 |
<0.001 |
|
|
Week 8 vs 16 |
30.29 ± 1.27 vs 44.74 ± 1.38 |
<0.001 |
|
|
HFD + Propolis |
Week 0 vs 8 |
27.29 ± 1.51 vs 30.33 ± 0.85 |
>0.001 |
|
Week 0 vs 16 |
27.29 ± 1.51 vs 32.82 ± 2.09 |
<0.001 |
|
|
Week 8 vs 16 |
30.33 ± 0.85 vs 32.82 ± 2.09 |
>0.001 |
|
p value <0.001 is significant different
Figure 3 demonstrates the pattern of increasing RI after receiving HFD, HFD + Propolis for 8 weeks (HFD-8), and HFD + Propolis for 16 weeks (HFD-16) following the start of the study (week 0), week 8, and week 16. In the HFD group, RI increased significantly between weeks eight and sixteen. From week 8 to week 16, the ND group failed to show a statistically significant increase in RI. Meanwhile, in the HFD-8 group, an increase in RI was seen which was in line with the ND group. and HFD-16 at week 8, but then the increase in RI was quite sharp at week 16. However, the increase in RI at week 16 was lower than with HFD. On the other hand, the HFD-16 group saw an increase that was almost in line with the ND group both at week 8 and week 16. In the ND group there was no significant increase seen from the start of the study until week 8 and week 16. Overall, the RI pattern increased in line with changes in the increase in BW and LI based on the duration of Propolis administration.
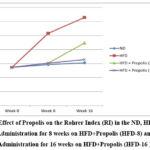 |
Figure 3: Effect of Propolis on the Rohrer Index (RI) in the ND, HFD groups, Propolis Administration for 8 weeks on HFD+Propolis (HFD-8) and Propolis Administration for 16 weeks on HFD+Propolis (HFD-16 ). |
Table 4 shows the effect of giving Propolis for both 8 weeks and 16 weeks on NF-κB in the Wistar rat (Rattus Norvegicus) model with a HFD compared to a ND. At the beginning of the study NF-κB was measured (week 0) and after that, measurements were taken at weeks eight (week 8) and sixteen (week 16).
After starting at 3.65 ng/ml, the mean NF-κB in the ND group increased to 3.74 ng/ml at week 8 and 3.77 at week 16. There was no statistically significant increase in NF-κB in the ND group from week 0 to week 8 or week 16 (p>0.001).
On the other hand, NF-κB significantly increased in the HFD group between weeks 0–8 and/or week 16 (p<0.001). Before increasing to 5,038 ng/ml at week 8 and 6,136 ng/ml at week 16, the HFD group’s mean NF-κB was 3.68 ng/ml (Table 4).
The initial mean NF-κB in the HFD group receiving 8 weeks of Propolis administration was 3,698 ng/ml, and by week 8, it had increased to 3.78 ng/ml.
There was no significant increase in NF-κB between before and after 8 weeks of propolis administration (HFD-8) at week 8 (p>0.001). The mean NF-κB in the HFD-8 group at week 16 was 4.37 ng/ml and there was a significant increase in NF-κB in the HFD group after administering 8 weeks of propolis (HFD-8) between week 0 and 16 and between week 8 and week 16 (p<0.001).
Additionally, there was not a significant increase in NF-κB between week 0 and 8 in the HFD group that received propolis for 16 weeks (HFD-16) (3.70 ng/ml vs 3.81 ng/ml). Between week 0 and week 16, the mean NF-κB in the HFD-16 group did not significantly increase (3.70 ng/ml vs. 3.85 ng/ml) (p>0.001). Similarly, in the HFD-16 group, there was no statistically significant increase in mean NF-κB between week 8 and week 16 (3.81 ng/ml vs. 3.85 ng/ml) (p>0.001). (Table 4)
Table 4: Effect of Propolis on NF-κB in HFD
|
Group |
Time |
NF-kB (ng/ml) |
|
|
Mean ± SE |
p Value |
||
|
Normal Diet |
Week 0 vs 8 |
3.65± 0.12 vs 3.74 ± 0.06 |
>0.001 |
|
Week 0 vs 16 |
3.65 ± 0.12 vs 3.77 ± 0.06 |
>0.001 |
|
|
Week 8 vs 16 |
3.74 ± 0.06 vs 3.77 ± 0.06 |
>0.001 |
|
|
HFD |
Week 0 vs 8 |
3.68 ± 0.15 vs 5.038± 0.20 |
<0.001 |
|
Week 0 vs 16 |
3.68 ± 0.15 vs 6.13± 0.05 |
<0.001 |
|
|
Week 8 vs 16 |
5.03± 0.20 vs 6.13 ± 0.05 |
<0.001 |
|
|
HFD + Propolis |
Week 0 vs 8 |
3.69 ± 0.14 vs 3.78 ± 0.09 |
>0.001 |
|
Week 0 vs 16 |
3.69 ± 0.14 vs 4.37 ± 0.14 |
<0.001 |
|
|
Week 8 vs 16 |
3.78 ± 0.09 vs 4.37 ± 0.14 |
<0.001 |
|
|
HFD + Propolis |
Week 0 vs 8 |
3.70 ± 0.12 vs 3.81 ± 0.12 |
>0.001 |
|
Week 0 vs 16 |
3.70 ± 0.12 vs 3.85 ± 0.08 |
>0.001 |
|
|
Week 8 vs 16 |
3.81 ± 0.12 vs 3.85 ± 0.08 |
>0.001 |
|
p value <0.001 is significant different
Figure 4 demonstrates the pattern of increase in NF-κB following HFD, HFD + Propolis for 8 weeks (HFD-8), and HFD + Propolis for 16 weeks (HFD-16) after the study’s start (week 0), week 8, and week 16. From week 8 to week 16, there was a significant increase in NF-κB in the HFD group. From week 8 to week 16, there was not a significant increase in NF-κB in the ND group.
In the meantime, NF-κB increased in the HFD-8 group in line with the ND group. and HFD-16 at week 8, but at week 16, there was a seen increase in NF-κB. In contrast to the HFD group, the increase in NF-κB at week 16 was, nevertheless, smaller. On the other hand, at week 8 and week 16, the HFD-16 group saw an increase that was similar to the ND group.
In the ND group there was no significant increase seen from the start of the study until week 8 and week 16. Overall the pattern of increase in NF-κB in line with changes in the increase in BW, LI and RI based on the duration of Propolis administration.
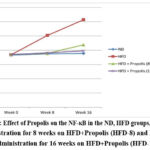 |
Figure 4: Effect of Propolis on the NF-κB in the ND, HFD groups, Propolis Administration for 8 weeks on HFD+Propolis (HFD-8) and Propolis Administration for 16 weeks on HFD+Propolis (HFD-16 ). |
Effect of Propolis on increasing CysC on HFD
Table 5 shows the effect of giving Propolis for both 8 weeks and 16 weeks on serum CysC levels in Wistar rats (Rattus Norvegicus) model with HFD compared to ND. At the start of the study CysC was measured (week 0) and then measurements were carried out at week 8 (week 8) and week 16 (week 16).
In the ND group, the mean CysC started at 1.04 ng/ml and went up to 1.06 ng/ml at week 8 and 1.10 at week 16. There was not a significant increase in CysC in the ND group from week 0 to week 8 or week 16 (p>0.001). On the other hand, there was a noteworthy increase in CysC in the HFD group during weeks 0–8 and/or 16 (p<0.001). In the HFD group, the mean CysC started at 1.04 ng/ml and went up to 1.35 ng/ml at week 8 and 1.90 ng/ml at week 16 (Table 5).
The mean initial CysC in the HFD group receiving 8 weeks of Propolis administration was 1.04 ng/ml, and by week 8, it had increased to 1.02 ng/ml. At week eight, there was not a significant increase in CysC between pre- and post-8 weeks of propolis administration (HFD-8) (p>0.001). At week 16, the mean CysC in the HFD-8 group was 1.47 ng/ml. CysC in the HFD group increased significantly (p<0.001) after 8 weeks of propolis treatment (HFD-8) both between weeks 0 and 16.
Furthermore, in the HFD group given propolis for 16 weeks (HFD-16) there was no significant increase in CysC between week 0 and week 8 (1.04 ng/ml vs 1.08 ng/ml). There was no significant increase in mean CysC in the HFD-16 group between week 0 and week 16 (1.04 ng/ml vs 1.12 ng/ml) (p>0.001). Likewise, there was no significant increase in mean CysC between week 8 and week 16 in the HFD-16 group (1.08 ng/ml vs 1.12 ng/ml) (p>0.001). (Table 5)
Table 5: Effect of Propolis on serum CysC level in HFD
|
Group |
Time |
Serum Cystatin C level (ng/ml) |
|
|
mean ± SE |
p value |
||
|
Normal Diet |
Week 0 vs 8 |
1.042 ± 0.02 vs 1.06 ± 0.03 |
>0.001 |
|
Week 0 vs 16 |
1.04 ± 0.02 vs 1.10 ± 0.02 |
>0.001 |
|
|
Week 8 vs 16 |
1.06 ± 0.03 vs 1.10 ± 0.02 |
>0.001 |
|
|
HFD |
Week 0 vs 8 |
1.04 ± 0.02 vs 1.35 ± 0.08 |
<0.001 |
|
Week 0 vs 16 |
1.04 ± 0.02 vs 1.90 ± 0.10 |
<0.001 |
|
|
Week 8 vs 16 |
1.35 ± 0.08 vs 1.90 ± 0.10 |
<0.001 |
|
|
HFD + Propolis |
Week 0 vs 8 |
1.04 ± 0.03 vs 1.08 ± 0.03 |
>0.001 |
|
Week 0 vs 16 |
1.04 ± 0.03 vs 1.47 ± 0.16 |
<0.001 |
|
|
Week 8 vs 16 |
1.08 ± 0.03vs 1.47 ± 0.16 |
<0.001 |
|
|
HFD + Propolis |
Week 0 vs 8 |
1.04 ± 0.02 vs 1.08 ± 1.128 |
>0.001 |
|
Week 0 vs 16 |
1.04 ± 0.02 vs 1.12 ± 0.06 |
>0.001 |
|
|
Week 8 vs 16 |
1.08 ± 1.12 vs 1.12 ± 0.06 |
>0.001 |
|
p value <0.001 is significant different
Figure 5 demonstrates the pattern of increasing CysC following HFD, HFD + Propolis for 8 weeks (HFD-8) and HFD + Propolis for 16 weeks (HFD-16) after the study’s start (week 0), week 8, and week 16. From week 8 to week 16, there was a significant increase in CysC in the HFD group. From week 8 to week 16, the ND group failed to show a statistically significant increase in CysC. Additionally, there was a gradual increase in CysC in the HFD-8 group. with the ND and HFD-16 groups at week 8, but by week 16, there had been an apparent increase in CysC. In contrast to the HFD group, the increase in CysC at week 16 was, nevertheless, smaller.
On the other hand, at week 8 and week 16, the HFD-16 group saw an increase that was nearly comparable to the ND group. There was not a significant increase in the ND group from the beginning of the study until weeks eight and sixteen.
Overall the pattern of increase in CysC in line with changes in the increase in BW, LI, RI and NF-κB based on the duration of Propolis administration.
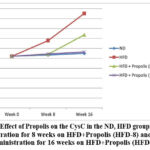 |
Figure 5: Effect of Propolis on the CysC in the ND, HFD groups, Propolis Administration for 8 weeks on HFD+Propolis (HFD-8) and Propolis Administration for 16 weeks on HFD+Propolis (HFD-16 ) |
Effect of Propolis on increasing ACE2 on HFD
Table 6 shows the effect of administering Propolis for both 8 weeks and 16 weeks on plasma levels of ACE2 in Wistar rats (Rattus Norvegicus) model with HFD compared to normal diet ND. At the start of the study ACE2 was measured (week 0) and then measurements were carried out at week 8 and week 16.
In the ND group, the mean ACE2 started at 1,863 ng/ml and went up to 1.94 ng/ml at week 8 and 2.03 at week 16. There was not a significant increase in ACE2 in the ND group from week 0 to week 8 or week 16 (p>0.001).
However, ACE2 increased significantly (p<0.001) in the HFD group between weeks 0–8 and/or week 16 as well. In the HFD group, the mean ACE2 started at 1.86 ng/ml and went up to 3.70 ng/ml at week 8 and 4.91 ng/ml at week 16 (Table 6).
The initial mean ACE2 in the HFD group receiving 8 weeks of Propolis was 1.86 ng/ml, and by week 8, it had increased to 2.08 ng/ml. At week eight, there was not a significant increase in ACE2 between pre- and post-8 propolis (HFD-8) administration. (p>0.001). At week 16, the average ACE2 in the HFD-8 group was 3.52 ng/ml. The ACE2 in the HFD group increased significantly (p<0.001) between week 0 and 16 and between week 8 and 16 following 8 weeks of propolis administration (HFD-8).
Additionally, there was not a significant increase in ACE2 between weeks 0 and 8 in the HFD-16 group that received propolis (1.87 ng/ml vs 2.06 ng/ml). Between week 0 and week 16, the mean ACE2 in the HFD-16 group did not significantly increase (1.87 ng/ml vs 2.11 ng/ml) (p>0.001). In the HFD-16 group, there was also not a significant increase in mean ACE2 between weeks 8 and 16 (2.06 ng/ml vs. 2.11 ng/ml) (p>0.001). (Table 6)
Table 6: Effect of Propolis on plasma ACE2 level in High Fat Diet HFD
|
Group |
Time |
Plasma ACE2 (ng/ml) |
|
|
mean ± SE |
p value |
||
|
Normal Diet |
Week 0 vs 8 |
1.86 ± 0.04 vs 1.94 ± 0.08 |
>0.001 |
|
Week 0 vs 16 |
1.86 ± 0.04 vs 2.03 ± 0.12 |
>0.001 |
|
|
Week 8 vs 16 |
1.94 ± 0.08 vs 2.03 ± 0.12 |
>0.001 |
|
|
HFD |
Week 0 vs 8 |
1.86 ± 0.04 vs 3.70 ± 0.31 |
<0.001 |
|
Week 0 vs 16 |
1.86 ± 0.04 vs 4.91 ± 0.05 |
<0.001 |
|
|
Week 8 vs 16 |
3.70 ± 0.31 vs 4.91 ± 0.05 |
<0.001 |
|
|
HFD + Propolis |
Week 0 vs 8 |
1.86 ± 0.07 vs 2.08 ± 0.12 |
>0.001 |
|
Week 0 vs 16 |
1.86 ± 0.07 vs 3.52 ± 0.08 |
<0.001 |
|
|
Week 8 vs 16 |
2.08 ± 0.12 vs 3.52 ± 0.08 |
<0.001 |
|
|
HFD + Propolis |
Week 0 vs 8 |
1.87 ± 0.03 vs 2.06 ± 1.13 |
>0.001 |
|
Week 0 vs 16 |
1.87 ± 0.03 vs 2.11 ± 0.08 |
>0.001 |
|
|
Week 8 vs 16 |
2.06 ± 1.13 vs 2.11 ± 0.08 |
>0.001 |
|
p value <0.001 is significant different
Following HFD, HFD + Propolis for 8 weeks (HFD-8) and HFD + Propolis for 16 weeks (HFD-16), Figure 6 demonstrates the pattern of increase in ACE2 starting from the beginning of the study (week 0), week 8 (week 8), and week 16 after giving HFD. From week 8 to week 16, there was a significant increase in ACE2 in the HFD group. There was not a significant increase in ACE2 in the ND group between weeks 8 and 16. In the meantime, the HFD-8 group’s ACE2 increased in a pattern in line with that of the ND group. and HFD-16 at week 8, but at week 16, there was a noticeable increase in ACE2.
In contrast to the HFD group, there was a less significant rise in ACE2 at week 16. However, at weeks eight and sixteen, the HFD-16 group saw an increase that was closely comparable to that of the ND group. In the ND group there was no significant increase seen from the start of the study until week 8 and week 16.
Overall the pattern of increase in ACE2 in line with changes in increasing BB, LI, RI, NF-κB, and CysC based on the duration of Propolis administration.
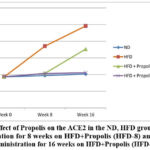 |
Figure 6: Effect of Propolis on the ACE2 in the ND, HFD groups, Propolis Administration for 8 weeks on HFD+Propolis (HFD-8) and Propolis Administration for 16 weeks on HFD+Propolis (HFD-16 ) |
Discussion
Overweight and obesity are thought to be the cause of 2.6 million deaths annually, according to WHO reports.1 Previous study revealed that the relationship between obesity and renal failure through several pathways still unclear.
From a biochemical perspective, obesity results from excess triacylglycerol in fat tissue due to daily energy intake exceeding daily energy expenditure. Obesity is associated with a significant increase in the morbidity of chronic diseases, including depression, type II diabetes, cardiovascular disease, and immobility. Childhood obesity increases the risk of developing chronic kidney disease (CKD) in adulthood and causes the same conditions to manifest earlier than usual.39
Several critical physiological responses, including apoptosis, cell adhesion, proliferation, differentiation, and inflammation, are regulated by the NF-κB family of transcription factors.11,12,29,33 The NF-κB pathway relates to the metabolic and inflammatory responses. Being a major contributor to inflammation, the NF-κB pathway can be used as a starting point to find out more about metabolic diseases like obesity caused by a high-fat diet.40
Previous studies have demonstrated that a high-fat diet (HFD) increases the activation of NF-κB associated with increased levels of NADPH oxidase components. Additionally, HFD can cause oxidative stress in prostate tissue by involving NADPH oxidase activity and NF-κB, which may result in intraprostatic inflammation and be a potential cause of prostate diseases such as BPH and prostate cancer.41
According to our study, administering Propolis during a high-fat diet can effectively reduce the increase in NF-κB levels. According to current studies, nutritional overload and metabolic stress cause the fat cell transcriptome to be reprogrammed toward inflammation through NF-κB signaling. According to certain studies, inhibiting NF-κB signaling could assist with the metabolism of inflammation in adipose tissue associated with obesity.42
An essential protein identified as CysC is filtered by the glomerulus after being non-glycosylated, and it is used as an indicator to assess kidney function. The information demonstrates a possible genetic connection between non-alcoholic fatty liver disease in children and chronic kidney diseases.
Adult studies indicate a positive relationship between CysC levels and BMI. Based on some studies, elevated CysC levels in obese children may serve as an early prognostic marker of vascular risk.43
According to the study’s findings, administering propolis can reduce an increase in Cys C in animal models of high-fat diets (HFD), which indicates that propolis administration can reduce the risk of obesity-related chronic kidney disease (CKD).
It has been demonstrated that serum CysC is an early and reliable biomarker of chronic kidney disease (CKD). This is especially useful for patients for whom creatinine is not a suitable marker or for whom more complex techniques for determining glomerular filtration rate (GFR) are not practicable.34
Through ectodomain shedding, the membrane-bound ectoenzyme ACE2 is released into the bloodstream. The renin-angiotensin system’s positive or negative feedback is thought to be responsible for either ectodomain shedding caused on by medication administration or disease, genetic factors, or differential gene expression. It is difficult to establish the relative contributions of each tissue to the blood’s release of ACE2, as circulating proteins originate from nearly every part of the body.44
According to the study’s findings, propolis administration can stifle the rise in plasma ACE2 in animal models of high-fat diets (HFD), which means that propolis administration can be utilized to prevent the decline in kidney function that results from an HFD in obesity.
Angiotensin 2 (AT2), a hormone with inflammatory characteristics that is generated in the renin-angiotensin system (RAS) pathway, is secreted by excess adipose tissue in obesity. Insulin resistance and obesity are closely linked to RAS activity. Furthermore, RAS function is modulated by oxidative stress, inflammatory responses, and mitochondrial dysfunction. Through the detrimental mechanisms outlined above, a disruption in RAS function results in widespread dysfunction in the majority of tissues.35 Renin converts angiotensinogen to angiotensin I (ATI) at the cellular level. To synthesize angiotensin 2 (AT2), the angiotensin converting enzyme (ACE) cleaves AT1. After AT2 interacts with type I G protein-coupled receptors on the cell surface, AT1R initiates a series of conditions that include insulin resistance, oxidative stress, vasoconstriction and inflammation.35,45
In a conclusion of this study, giving propolis for 16 weeks can prevent obesity, suppress the inflammatory process, prevent the risk of CKD and prevent damage to kidney function in obesity due to HFD. This shows that giving Propolis can be used as a supplement to suppress increases in BW, NF-κB, CysC and ACE2 in obesity.
The limitation of this study is that it only looks at the upstream molecular mechanisms of Propolis as an anti-obesity agent and does not yet explore in detail at the pathway of NF-κB activity which is related to pro-inflammatory cytokines such as IL6 and TNFα. Other than that, no studies have been done to explore how propolis influences the dynamics of the process in terms of preventing glomerular damage and performing as an anti-obesity agent.
Conclusion
Propolis administration can suppress the increase in BW, LI, RI, NF-κB, CysC and ACE2 protein levels in the HFD group after administration of propolis for 8 weeks and 16 weeks. Furthermore, a positive correlation was found between BW, LI, RI, NF-κB, Cy C and ACE2 protein levels in the HFD group after giving propolis for 8 weeks and 16 weeks compared to and normal diet in Wistar rats with HFD.
Further study is needed to explore in the downstream molecular mechanisms of Propolis as anti-obesity and anti-inflammatory and a more detailed in the pathway of NF-κB activity related to pro-inflammatory cytokines such as IL6 and TNFα is needed.
Also, further study is needed to explore on the dynamics of changes in BW, LI, RI, NF-κB, CysC and ACE2 protein levels and the process as an anti-obesity and anti-inflammatory after Propolis treatment.
Acknowledgement
Authors would like to thank Romi Usman, Mus Jubaru, Wani, and Markus of Molecular Biology and Immunology Laboratory for Infection Diseases, Faculty of Medicine, Hasanuddin University, Makassar, Indonesia who helped in the search of journals.
Conflict of Interest
The authors declare no conflict of interest, financial or otherwise.
Funding Sources
No specific funding are available.
Availability of Data and Materials
The authors confirm that the data supporting the findings of this study are available within the article.
Ethic Approval
The research was conducted at the Laboratory of Molecular Microbiology and Immunology, Faculty of Medicine, University of Hasanuddin Makassar. The research was obtaining approval for ethical clearance from the health research ethics committee of the Faculty of Medicine UNHAS Makassar, Indonesia, No. 221/UN4.6.4.5.31/PP36/2024; dated 27, March, 2024, according to Helsinki Declaration.
Authors Contributions
Muhammad Reza Primaguna (MRP), Haerani Rasyid (HR), Makbul Aman (MA), Syakib Bakri (SB), Hasyim Kasim (HK), Harun Iskandar (HI), Ressy Dwiyanti (RR), Ade Rifka Junita (ARJ), Ridwan Ridwan (RR), Rizki Amelia Noviyanthi (RAN), Nur Indah Purnamasari (NIP), Mochammad Hatta (MH) MRP, HR, MA, SB, RR and MH conceived and designed the study, conducted research, provided materials, and collected and organized data. MRP, HR, HK, HI, RR, RAN, NIP, and MH drafted the manuscript. MRP, HR, RD, RR, ARJ, RAN, NIP and MH analysed the data and interpreted data. MRP, HR, MA, RR, ARJ, RAN, NIP and MH wrote initial and final draft article, and provided logistic support. All authors have critically reviewed and approved the final draft and are responsible for the content and similarity index of the manuscript.
References
- WHO Obesity Report. https://www.who.int/news-room/fact-sheets/detail/obesity-and-overweight. Geneva. 09 June 2021
- Thamrin SA, Arsyad DS, Kuswanto H, Lawi A, Arundhana AI. Obesity Risk-Factor Variation Based on Island Clusters: A Secondary Analysis of Indonesian Basic Health Research 2018. Nutrients. 2022;14(5):971
CrossRef - Konda PY, Poondla V, Jaiswal KK, Dasari S, Uyyala R, Surtineni VP, Egi JY, Masilamani AJA, Bestha L, Konanki S, Muthulingam M, Lingamgunta LK, Aloor BP, Tirumalaraju S, Sade A, Ratnam Kamsala V, Nagaraja S, Ramakrishnan R, Natesan V. Pathophysiology of high fat diet induced obesity: impact of probiotic banana juice on obesity associated complications and hepatosteatosis. Sci Rep. 2020;10(1):16894
CrossRef - Chatterjee A, Gerdes MW, Martinez SG. Identification of Risk Factors Associated with Obesity and Overweight—A Machine Learning Overview. Sensors. 2020;20(9):2734
CrossRef - Kalantar-Zadeh K, Jafar TH, Nitsch D, Neuen BL, Perkovic V. Chronic kidney disease. Lancet. 2021 Aug 28;398:786-802
CrossRef - Shabaka A, Cases-Corona C, Fernandez-Juarez G. Therapeutic Insights in Chronic Kidney Disease Progression. Front Med (Lausanne). 2021;8:645187.
CrossRef - Schmidt Viviane, Hogan Andrew E. Fallon Padraic G., Schwartz Christian. Obesity-Mediated Immune Modulation: One Step Forward, (Th)2 Steps Back. Frontiers in Immunology. 2022:13
CrossRef - Ray A, Bonorden MJL, Pandit R, Nkhata KJ, Bishayee A. Infections and immunity: associations with obesity and related metabolic disorders. J Pathol Transl Med. 2023;57(1):28-42
CrossRef - Yim HE, Yoo KH. Obesity and chronic kidney disease: prevalence, mechanism, and management. Clin Exp Pediatr. 2021;64(10):511-518
CrossRef - Sharma M, Singh V, Sharma R, Koul A, McCarthy ET, Savin VJ, Joshi T, Srivastava T. Glomerular Biomechanical Stress and Lipid Mediators during Cellular Changes Leading to Chronic Kidney Disease. Biomedicines. 2022;10(2):407
CrossRef - Junita AR, Hamid F, Budu B, Natzir R, Hala Y, Alam G, Agus R, Bahar B, Syukri A, Primaguna MR, Dwiyanti R, Febrianti A, Sabir M, Azhar A, Hatta M. A potential mechanism of miana (Coleus scutellariodes) and quercetin via NF-κB in Salmonella typhi infection. Heliyon. 2023;9(11):e22327
CrossRef - Junita AR, Hamid B, Budu B, Natzir R, Hala Y, Alam G, Agus R, Bahar B, Syukri A, Primaguna MR, Dwiyanti R, Febrianti A, and Azhar A, Hatta M. Antibacterial and antiinflammation effects of Miana (Coleus scutellariodes) in infectious disease via inhibition of Nuclear factor-kappa B (NF-κB) activities: Review Article. Biomedical and Pharmacology Journal. 16(3), 1303-1317
CrossRef - Karo M, Hatta M, Salma W, Patellongi I, Natzir R. Effects of Miana (Coleus Scutellariodes [L] Benth) to Expression of mRNA IL-37 in Balb/c Mice Infected Candida albicans. Pharmacognosy J. 2018;10 (1):16-19.
CrossRef - Rosamarlina, Hatta M, Sridiana E, Djaharuddin I, Patellongi I, Murtian F. The effect of Miana (Coleus scutellariodes [L]) on Vascular Endothelial Growth Factor expression in Balb/c mice infected with Mycobacterium tuberculosis. Biomed Pharm J. 2021;14 (2): 525-532.
CrossRef - Rosamarlina R, Hatta M, Djaharuddin I, Patellongi I, Susanto A. D, Islam A. A, Massi M. N, Bukhari A, Santoso A, Tabri N. A, Murtiani F, Junita A. R, Saleh A. S, Dwiyanti R, Pakadang S. R. The Changes of HIF-1α and ICAM-1 Expression after Miana (Coleus Scutellariodes [L]) Treatment in Balb/C Mice with Mycobacterium Tuberculosis Infection. Biomed Pharm J. 2022;15(1), 73-81
CrossRef - Berretta AA, Silveira MAD, Cóndor Capcha JM, De Jong D. Propolis and its potential against SARS-CoV-2 infection mechanisms and COVID-19 disease: Running title: Propolis against SARS-CoV-2 infection and COVID-19. Biomed Pharmacother. 2020;131:110622
CrossRef - Braakhuis A. Evidence on the Health Benefits of Supplemental Propolis. Nutrients. 2019;11(11):2705
CrossRef - Syam Y, Natsir R, Rahardjo SP, Usman AN, Dwiyanti R, Hatta M. Effect of Trigona Honey to mRNA Expression of Interleukin-6 on Salmonella Typhi Induced of BALB/c. Am J Microbiol Res. 2016; 4 (3): 77-80.
- Syam Y, Usman AN, Natzir R, Rahardjo SP, Hatta M, Sjattar EL, Saleh A, Sa’na M. Nutrition and pH of Trigona Honey from Masamba, South Sulawesi, Indonesia. Int J Sci Basic Appl Res. 2016; 27 (1): 32-36.
- Pasupuleti VR, Sammugam L, Ramesh N, Gan SH. Honey, Propolis, and Royal Jelly: A Comprehensive Review of Their Biological Actions and Health Benefits. Oxid Med Cell Longev. 2017;2017:1259510
CrossRef - Zulhendri F, Lesmana R, Tandean S, Christoper A, Chandrasekaran K, Irsyam I, Suwantika AA, Abdulah R, Wathoni N. Recent Update on the Anti-Inflammatory Activities of Propolis. Molecules. 2022;27(23):8473
CrossRef - Zhang Y, Cao C, Yang Z, Jia G, Liu X, Li X, Cui Z, Li A. Simultaneous Determination of 20 Phenolic Compounds in Propolis by HPLC-UV and HPLC-MS/MS. J Food Comp Anal. 2023;115:104877
CrossRef - Aldana-Mejía JA, Ccana-Ccapatinta GV, Ribeiro VP, Arruda C, Veneziani RCS, Ambrósio SR, Bastos JK. A validated HPLC-UV method for the analysis of phenolic compounds in Brazilian red propolis and Dalbergia ecastaphyllum. J Pharm Biomed Anal. 2021;198:114029
CrossRef - Andrade JKS, Denadai M, de Oliveira CS, Nunes ML, Narain N. Evaluation of bioactive compounds potential and antioxidant activity of brown, green and red propolis from Brazilian northeast region. Food Res Int. 2017;101:129-138.
CrossRef - Kasiotis KM, Anastasiadou P, Papadopoulos A, Machera K. Revisiting Greek Propolis: Chromatographic Analysis and Antioxidant Activity Study. PLoS One. 2017;12(1):e0170077
CrossRef - Medana C, Carbone F, Aigotti R, Appendino G, Baiocchi C. Selective analysis of phenolic compounds in propolis by HPLC-MS/MS. Phytochem Anal. 2008;19(1):32-39
CrossRef - Volpi N, Bergonzini G. Analysis of flavonoids from propolis by on-line HPLC-electrospray mass spectrometry. J Pharm Biomed Anal. 2006;42(3):354-61
CrossRef - Yangi B, Cengiz Ustuner M, Dincer M, Ozbayer C, Tekin N, Ustuner D, Colak E, Kolac UK, Entok E. Propolis Protects Endotoxin Induced Acute Lung and Liver Inflammation Through Attenuating Inflammatory Responses and Oxidative Stress. J Med Food. 2018;21(11):1096-1105
CrossRef - Lopes AA, Ferreira TS, Nesi RT, Lanzetti M, Pires KM, Silva AM, Borges RM, Silva AJ, Valença SS, Porto LC. Antioxidant action of propolis on mouse lungs exposed to short-term cigarette smoke. Bioorg Med Chem. 2013;21(24):7570-7
CrossRef - Sabir JSM, El Omri A, Shaik NA, Banaganapalli B, Al-Shaeri MA, Alkenani NA, Hajrah NH, Awan ZA, Zrelli H, Elango R, Khan M. Identification of key regulatory genes connected to NF-κB family of proteins in visceral adipose tissues using gene expression and weighted protein interaction network. PLoS One. 2019;14(4):e0214337
CrossRef - Baker RG, Hayden MS, Ghosh S. NF-κB, inflammation and metabolic disease. Cell metabolism. 2011; 3(1):11-22
CrossRef - Poma P. NF-κB and Disease. Int J Mol Sci. 2020;21(23):9181
CrossRef - Syukri A, Budu, Hatta M, Amir M, Rohman MS, Mappangara I, Kaelan C, Wahyuni S, Bukhari A, Junita AR, Primaguna MR, Dwiyanti R, Febrianti A. Doxorubicin induced immune abnormalities and inflammatory responses via HMGB1, HIF1-α and VEGF pathway in progressive of cardiovascular damage. Ann Med Surg (Lond). 2022;76:103501.
CrossRef - Benoit SW, Ciccia EA, Devarajan P. Cystatin C as a biomarker of chronic kidney disease: latest developments. Expert Rev Mol Diagn. 2020;20(10):1019-1026
CrossRef - Patel AB, Verma A. COVID-19 and Angiotensin-Converting Enzyme Inhibitors and Angiotensin Receptor Blockers: What Is the Evidence?. JAMA. 2020;323(18):1769–1770
CrossRef - Ridwan R, Natzir R, Rasyid H, Patellongi I, Hatta M, Linggi E. B, Bukhari A, Bahrun U. Decreased Renal Function Induced by High fat diet in Wistar Rat: The Role of Plasma Angiotensin Converting Enzyme 2 (ACE2). Biomed Pharmacol J. 2019;12(3):1279-1287
CrossRef - Lee SII, Kim JW, Lee YK, Yang S, Lee IA, Suh JW, Kim SD. Anti-obesity Effect of Monascus pilosus Mycelial Extract in High Fat Diet induced Obese Rat. J. Appl. Biol. Chem. 2011;54 (3):197-205
CrossRef - Lozano I, Van der Werf R, Bietiger W, Seyfritz E, Peronet C, Pinget M, Jeandidier N, Maillard E, Marchioni E, Sigrist S, Dal S. High-fructose and high fat diet-induced disorders in rats: impact on diabetes risk, hepatic and vascular complications. Nutr Metab (Lond). 2016;13:15
CrossRef - Prasad R, Jha RK, Keerti A. Chronic Kidney Disease: Its Relationship With Obesity. Cureus. 2022;14(10):e30535
CrossRef - Park, M, Hong, J. Roles of NF-κB in Cancer and Inflammatory Diseases and Their Therapeutic Approaches. Cells, 2016;5(2):15
CrossRef - Vykhovanets EV, Shankar E, Vykhovanets OV, Shukla S, Gupta S. High fat diet increases NF-κB signaling in the prostate of reporter mice. Prostate.2011;71(2):147-56
CrossRef - Griffin MJ. On the Immunometabolic Role of NF-κB in Adipocytes. Immunometabolism. 2022;4(1):e220003
CrossRef - Huo YX, Wei W, Liu Y, Ma YN, Tao JM, Wang NN, Li XF, Chen X. Serum Cystatin C Levels Are Associated With Obesity in Adolescents Aged 14-17 Years. Front Endocrinol (Lausanne).2022;13:816201
CrossRef - Emilsson V, Gudmundsson EF, Aspelund T, Jonsson BG, Gudjonsson A, Launer LJ, Lamb JR, Gudmundsdottir V, Jennings LL, Gudnason V. Serum levels of ACE2 are higher in patients with obesity and diabetes. Obes Sci Pract. 2020;7(2):239-243
CrossRef - Al-Benna S. Association of high level gene expression of ACE2 in adipose tissue with mortality of COVID-19 infection in obese patients. Obes Med. 2020;19:100283.
CrossRef

