
Manuscript accepted on :28-05-2024
Published online on: 18-07-2024
Plagiarism Check: Yes
Reviewed by: Dr. Ayan Chatterjee and Dr. Dito Anurogo
Second Review by: Dr. Rishit Jangde
Final Approval by: Dr. Eman Refaat Youness
Achadiyani Achadiyani1* , Denata Prabhasiwi2, Auria Ekanti Pratiwi2, Aceng Hamudin2, Henhen Heryaman1, Nayla Majeda Alfarafisa1 and Nur Atik1
1Department of Biomedical Sciences, Faculty of Medicine, Universitas Padjadjaran, West Java, Indonesia
2Graduate School of Anti Aging and Aesthetic Medicine Master Program, Faculty of Medicine, Universitas Padjadjaran, Bandung Indonesia.
Corresponding Author E-mail: achadiyani@unpad.ac.id
DOI : https://dx.doi.org/10.13005/bpj/2977
Abstract
During skin aging, there is excessive secretion of inflammatory cytokines such as interleukin-6 (IL-6), which can make the ageing process more severe. Metformin has been known to have good anti-inflammatory activity through various pathways, one of which reduces the expression of inflammatory cytokines. This study aimed to analyze the effect of metformin treatment on IL-6 gene expression in an in vitro human fibroblast cell. Human fibroblast cells were obtained through foreskin isolation, and 72 cultured human fibroblast cells were divided into six groups based on cell passages, ranging from the third to the eighth. The expression of IL-6 was assessed in three treatments: negative control (normal cells), metformin 100 µM, and positive control (Vitamin E 50 µM). Treatment and measurement of IL-6 gene expression were carried out using qRT-PCR and calculated using the Livak-Schmittgen method. The results were then compared and analyzed using One-Way Analysis of Variance (ANOVA) and followed by post-hoc analysis. The negative control group had the lowest IL-6 gene expression compared to the metformin group and positive control group. The negative control IL-6 expression showed the highest value at passage 3 (0.166 ± 0.04) and the lowest at passage 6 (0.048 ± 0.04). Meanwhile, the expression of IL-6 positive control passage 4 (5.590 ± 3.34) showed the highest value and passage 7 (0.000 ± 0.00) showed the lowest value. In the metformin group, IL-6 gene expression was highest in passage 5 (0.836 ± 0.15) and lowest in passage 3 (0.078 ± 0.02). Based on treatment, there is a difference in IL-6 gene expression at passage 4 (p-value <0.05) and passage 5 (p-value <0.001). Metformin treatment passage 5 showed a significant difference with negative control (p-value <0.05) and with positive control (p-value <0.05). Our study concluded that the administration of metformin had no effect on IL-6 gene expression in human fibroblasts. However, metformin demonstrated anti-aging potential, as evidenced by a statistically significant difference in IL-6 expression between the negative control and positive control treatment groups.
Keywords
Aaging; Human fibroblast cells; IL-6; metformin; qRT-PCR
Download this article as:| Copy the following to cite this article: Achadiyani A, Prabhasiwi D, Pratiwi A. E, Hamudin A, Heryaman H, Alfarafisa N. M, Atik N. Effect of Metformin on Interleukin-6 Expression in Human Fibroblast Cell Aging Model. Biomed Pharmacol J 2024;17(3). |
| Copy the following to cite this URL: Achadiyani A, Prabhasiwi D, Pratiwi A. E, Hamudin A, Heryaman H, Alfarafisa N. M, Atik N. Effect of Metformin on Interleukin-6 Expression in Human Fibroblast Cell Aging Model. Biomed Pharmacol J 2024;17(3). Available from: https://bit.ly/46rLs2V |
Introduction
The skin is the main medium that plays a role in the interaction of organisms with their environment through electromagnetic irradiation or light, air, skin contact, food, and injections.1,2 Skin health decreases with age, characterized by changes in skin structure, such as wrinkles, dryness, and roughness of the skin, reduced skin elasticity, and skin pigmentation. Skin aging is based on a molecular fibroblast cell population mechanism.3,4 During skin aging, the number of fibroblasts and their functional activity are reduced.5 A decrease in the number of fibroblasts in the skin leads to a decrease in collagen synthesis and blood vessels, thereby forming wrinkles in the skin.6 In the aging skin layer, cellular senescence occurs, which is characterized by the inability of cells to proliferate, maintain viability, and metabolic activity, despite the presence of sufficient nutrients and mitogens.7
Skin aging occurs through two processes; intrinsic and extrinsic.8,9 Intrinsic processes are closely related to an individual’s genetic makeup, such as the production of extracellular collagen and matrix proteins in the skin.10,11 Extrinsic aging is closely related to an individual’s lifestyle, including smoking, exposure to UV radiation, and intake of large amounts of alcohol.10,11 External stimuli, such as UV radiation, oxidative stress, and poor nutrition, along with internal stimuli, such as hormonal changes, can trigger inflammatory processes in the skin or inflammaging.10,12 Several studies have shown that aging cells and inflammatory cells secrete cytokines and chemokines that can trigger the aging process to become stronger.13,14 During skin aging, several processes occur, such as excessive secretion of TNF-α, IL-6, IL-1β, IL-2, IL-1, and IL-8, increased levels of metalloproteinases, and excessive production of ROS by mitochondria.12
One of the markers of early inflammatory reactions is an increase in IL-6 levels.15 IL-6 is a cytokine that is involved in the differentiation, activation, and proliferation of leukocytes, endothelial cells, keratinocytes, and fibroblasts.16 IL-6 concentrations increase during aging, particularly in the elderly population.17 IL-6 plays a role in skin aging and the formation of skin wrinkles.10 High expression of IL-6 can predict increased mortality in the elderly.19,20 However, low IL-6 expression can cause reduced inflammaging.19
Skin aging can affect dermatological conditions, which can increase the risk of morbidity and mortality.20,21 The consumption of various supplements and anti-aging drugs is one way to maintain skin health.20,22 Antiaging agents in topical medications or supplements such as vitamin C, vitamin B3, Vitamin E, and polyphenolic compounds have antioxidant and anti-inflammatory activities that can reduce collagen degradation by reducing free radicals in tissues, regulating cell metabolism and regeneration, and inhibiting matrix metalloproteinase.22,23 Research on primary fibroblast cells shows that Vitamin E supplementation can reduce the number of SA-β-gal positive cells in vitro and supports reduced cell senescence.24 Previous study shows that addition of Vitamin E can improve protective effect on fibroblast cell survival.25 Therefore, maintaining skin health by supplementation of antiaging agent has become increasingly important.
Currently, several drugs with potential as anti-aging agents are attracting the attention of many researchers, including metformin.26 Metformin is known as an antidiabetic drug for more than 60 years, which is indicated to regulate various aging-related pathways such as Adenosine monophosphate-activated protein kinase (AMPK), Sirtuin (silent mating type information regulation 2 homolog) 1 (SIRT1), Mammalian target of rapamycin complex 1 (mTORC1), and inhibit pro-inflammatory cytokines.26,27 Metformin has anti-inflammatory effects by inhibiting the expression of pro-inflammatory mediators such as IL-6 and IL-17.28 Previous studies have shown that metformin can reduce IL-6 secretion from bone marrow-derived macrophages (BMDMs).29 In addition, metformin reduced the number of IL-6-induced lung cancer A549 and HCC827 cells.28 The anti-aging potential of metformin is reinforced by the results of previous studies showing that metformin inhibits MMP-1 and MMP-2, which act as collagen and gelatin degradation enzymes, and may be involved in photoaging induced by LPS.30,31 Moreover, addition of 100 µM metformin shows a antiaging activity by extend the lifespan of human fibroblasts and mesenchymal stem cells.32 However, the antiaging activity of metformin shows various mechanisms. Low doses of metformin show the antiaging effect, however at high doses of metformin cause severe mitochondrial dysfunction that damages cells.33 In addition to extending the life of diploid fibroblast cells, in its mechanism of action, metformin can induce aging activation of Nrf2 target gene, activates the AMPK signaling pathway and increases stress responses, such as superoxide dismutase 2 (SOD2), thioredoxin 1 (TrxR1), quinone oxidoreductase 1 (NQO1) and quinone oxidoreductase 2 (NQO2).32,34,35
In recent years, many studies have been conducted using cell lines and animal models to test the anti-aging activity of metformin.36,37 Based on the molecular mechanism of fibroblasts, the skin aging process was developed by culturing or subculturing normal human diploid fibroblast cells.38 In this regard, cell culture technology in the form of cell aging or replication is a widely used way to study cell aging.39 Subculturing or passaging cells is a procedure that allows further propagation of a cell line or cell strain.40 Fibroblast cells can be passage between 5 and 10 times. In general, fibroblast cells grown in culture media will become more stable and able to proliferate well at passage 3 and growth begins to slow down at passage 8.41 Therefore, testing the antiaging model of fibroblast cells at passage 3 to passage 8 needs to be further analyzed.
The Targeting Aging with Metformin (TAME) clinical trial was conducted to further explore the anti-aging activity of metformin.42,43 However, the role of metformin in IL-6 expression in the mechanism of aging in human fibroblasts has not been elucidated. Accordingly, this study aimed to analyze the potential of metformin as an anti-aging agent, particularly in regulating the IL-6 expression pathway in fibroblast cell aging models. The antiaging model conducted in this study is the process of cell aging through cell passaging.
Human foreskin tissue was collected through circumcision of male patients aged 1 to 12 years. Protocol procedures were approved by The Research Ethics Committee of the Faculty of Medicine, Padjadjaran University. The parents of the study participants took part in the study by signing an informed consent to participate as respondents for the collection and analysis of foreskin tissue which is usually discarded. The specimens were first collected in 10% povidone-iodine for 5 minutes before being transferred to 70% ethanol for 15 seconds. The cells were rinsed with 4% antibiotic-antimycotic (ABAM) (Sigma-Aldrich, USA) in phosphate-buffered saline (PBS) (Gibco, USA) for 5 minutes and moved to 4°C. Before usage, store Dulbecco’s modified eagle medium (DMEM) (Gibco, USA) in a cooler box with 10% Fetal Bovine Serum (FBS) (Gibco, USA), 1% penicillin/streptomycin (Gibco, USA), and 1% HEPES (Sigma-Aldrich, USA). To remove any adhering blood, the specimens were washed three times with PBS + 1% ABAM. The adipocyte tissue in the specimen was cleaned by cutting it into a 5 mm square segment, incubating it in povidone-iodine 10% for 5 minutes, and then washing it three times with PBS + ABAM 1%. After washing, the specimen was placed in an empty T25 flask for attachment. Then, 2 mL of DMEM complete media was added and incubated at 37 degrees Celsius with 5% CO2.44,45
Cell culture and Treatment with metformin
Human foreskin fibroblasts were cultivated at Padjadjaran University’s Cell Culture and Cytogenetic Laboratory in Bandung, Indonesia. The Research Ethics Committee of the Faculty of Medicine at Padjadjaran University approved this study, which ran from June 2022 to November 2022 (Number: 492/UN6.KEP/EC/2022). Cell culture procedures and treatments were carried out using previously published methods, with minor modifications.46 Isolated human foreskin fibroblasts were grown in DMEM media containing 10% FBS, 1% penicillin/streptomycin, and the minor modification was added 1% HEPES in the media. The cells were cultivated at 37℃, 8% CO2, and 100% humidity. The media conditions for the metformin treatment were same; however, 100 µM metformin (Tocris, UK) was added to nuclease-free H2O. Dosage of 100 µM metformin has been shown to extend the lifespan of human fibroblasts and mesenchymal stem cells.32 The positive control treatment was 50 µM α-tocopherol/Vitamin E (Sigma-Aldrich, USA) in nuclease-free H2O which has been shown the protective effect of Vitamin E by improve fibroblast survival.25 Fibroblasts were used at stages 3 through 8. Fibroblast cells with a density of 80-90% were cultured for passage, planted in 12 well microplates at 40,000 cells/well for treatment, and counted with a hemocytometer. Cells were seeded and grown in the medium determined for each treatment, with the media replenished every 72 hours. RNA was extracted at 80% confluence and isolated for qRT-PCR analysis.
Gene Expression Analysis using qRT-PCR
IL-6 gene expression analysis using qRT-PCR was performed at the Laboratory of Molecular and Genetics of Padjadjaran University, Bandung, Indonesia. The Promega GoTaq 1-Step RT-qPCR System was used to isolate total RNA and execute qRT-PCR in accordance with the manufacturer’s instructions. After 72 hours, the cells were washed twice with PBS and homogenized with 1 mL TRI reagent per 10 cm2 area (Life Technologies, Gaithersburg, MD). The cells were scraped to remove them, and the cell lysate and TRI reagent were combined in a 1.5 mL Eppendorf tube and left to stand for 5 minutes at room temperature (25°C). The recovered RNA was rinsed with 1 mL of 75% ethanol in DEPC-treated water and then centrifuged at 7500-9500 rpm for 5 minutes at 2 – 8℃. The dried RNA pellet was reconstituted using DEPC-treated water (1:40). The Nano Drop 2000 spectrophotometer (Thermo Scientific™, USA) was used to measure total RNA quantity and quality.
Human IL-6 gene expression was measured using the following primers that are shown in Table 1. Quantitative RT-PCR was performed in a total volume of 50 μL and was carried out in triplet for each measurement. Each reaction had a primer concentration of 01-0.5 µM. The following cycling conditions were used: denaturation at 95°C for 2 min, followed by 31-35 cycles of 95°C for 15 s, primer annealing at 50-60°C for 20 s, extension at 72°C for 1 min/1 kb, and 5 min. Threshold cycle (Ct) values from each trial were used to compute the fold change in household gene expression using Livak-Schmittgen method.47,48
Table 1: Primer sequence for RT- PCR
|
Gene |
Primer sequence |
|
|
IL-6 |
Forward |
5′-GAACTCCTTCCACCAGCGCCTT-3′ |
|
|
Reverse |
5′-CAAAAGACCAGTGATGATTTTCACCAGG-3’ |
|
GAPDH |
Forward |
5′-AGAAGGCTGGGGCTCATTTG-3′ |
|
|
Reverse |
5′-AGGGGCCATCCACAGTTTTC-3’ |
Data management and Statistical Analysis
Statistical analysis was performed using SPSS software 26 version (SPSS Inc., USA). The obtained data were analyzed using the Shapiro-Wilk test for normality, to decide whether the mean can be used as a representative value of the data or not. If applicable, then means were compared using parametric tests, otherwise, medians were used to compare groups, using nonparametric methods.49 The IL-6 gene expression is presented as mean ± standard deviation. The difference of IL-6 expression among treatment and passage were evaluated using one-way ANOVA test was performed followed by Games Howell post hoc. A Games Howell post hoc was used to make multiple comparisons among means of groups with unequal variances and unequal sample sizes.50 A p-value less than 0.05 was considered statistically significant. The data of IL-6 gene expression was reported using GraphPad Prism 8.0.1 (GraphPad, USA).
Result
To analyze the effect of metformin treatment in reducing aging, cytokine IL-6 was measured using the RT-PCR method, and the measurement results were analyzed using the Livak method. IL-6 expression for NC, Metformin, PC, and histogram of metformin treatment results are shown in Figure 1.
IL-6 relative gene expression among cell passage
IL-6 gene expression in negative control had the lowest value compared to metformin treatment and positive control. In the negative control, the IL-6 expression in passage 6 showed the smallest value (0.048 ± 0.04) and passage 3 showed the highest expression (0.166 ± 0.04). On the other hand, negative control IL-6 expression showed the highest value at passage 4 (5.590 ± 3.34), continued to decrease until passage 7 (0.000 ± 0.00), and increased again at passage 8 (2.988 ± 4.78). Based on Figure 1(b), metformin-treated IL-6 expression increased from passage 3 with the lowest expression (0.078 ± 0.02) until passage 5 (0.836 ± 0.15) and decreased again at passage 6 (0.123 ± 0.03). Figure 1(a) shows that IL-6 expression of metformin treatment did not show lower results than the negative control, but showed low values compared to the positive control.
In this study, the results of homogeneity testing of data variance between groups were not homogeneous (data not shown), hence the next analysis was data analysis using One way ANOVA test (parametric test) and followed by post hoc analysis using Games Howell test. Based on one way ANOVA analysis, only Metformin treatment showed a difference between the passages (p = 0.000). To determine the difference between the passages, the Games Howell test was conducted and the p value for each passage is shown in Table 2. However, in the negative control and positive control, no significant difference was found between cell passages. Based on the results of statistical analysis shown in Figure 1(b) and Table 2, metformin treatment showed significant differences between passage 5 and other passages (p<0.05).
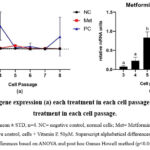 |
Figure 1: IL-6 gene expression (a) each treatment in each cell passage, (b) metformin treatment in each cell passage. |
Table 2: p-value Games Howell post hoc of IL-6 comparison among passages
|
p-value of comparison IL-6 relative expression among passages |
||||||
|
|
Passage 3 |
Passage 4 |
Passage 5 |
Passage 6 |
Passage 7 |
Passage 8 |
|
Passage 3 |
|
0.339 |
0.043 |
0.481 |
0.742 |
0.903 |
|
Passage 4 |
0.339 |
|
0.039 |
0.559 |
0.995 |
0.459 |
|
Passage 5 |
0.043 |
0.039 |
|
0.042 |
0.032 |
0.042 |
|
Passage 6 |
0.481 |
0.559 |
0.042 |
|
0.944 |
0.975 |
|
Passage 7 |
0.742 |
0.995 |
0.032 |
0.944 |
|
0.878 |
|
Passage 8 |
0.903 |
0.459 |
0.042 |
0.975 |
0.878 |
|
The statistical method used is ANOVA following by Games Howell post hoc with p < 0.05. p-value < 0.05 = there is a difference between groups and p-value> 0.05 = there is no difference between groups
IL-6 gene expression among treatments
To analyze the differences in each treatment between cell passages, a statistical test was carried out using the ANOVA method. The p-value results for each passage determine the differences in IL-6 expression in the three treatments are shown in Table 3.
Table 3: Statistical analysis of IL-6 gene expression against treatment in each cell passage
|
Cell Passage |
IL-6 expression |
p-value |
||
|
NC |
Met |
PC |
||
|
3 |
0.116 ± 0.04 |
0.078 ± 0.02 |
1.214 ± 1.04 |
0.110 |
|
4 |
0.149 ± 0.03 |
0.023 ± 0.09 |
5.590 ± 3.45 |
0.025 |
|
5 |
0.158 ± 0.05 |
0.836 ± 0.15 |
0.284 ± 0.14 |
0.001 |
|
6 |
0.048 ± 0.04 |
0.123 ± 0.03 |
0.589 ± 0.85 |
0.408 |
|
7 |
0.095 ± 0.01 |
0.187 ± 0.13 |
0.000 ± 0.00 |
0.070 |
|
8 |
0.072 ± 0.02 |
0.104 ± 0.03 |
2.988 ± 4.75 |
0.378 |
NC= negative control, normal cell; Met= Metformin, cell + metformin 100µM; PC= positive control, cell + Vitamin E 50µM. n = 4, the statistical method used is ANOVA with p < 0.05. p-value < 0.05 = there is a difference between groups and p-value> 0.05 = there is no difference between groups.
According to Table 3, significant variations in IL-6 expression were observed among treatments, particularly in passages 4 (p=0.025) and 5 (p=0.001). Further test subsequently analyzed the expression of IL-6 in passages 4 and 5, as depicted in Figure 2.
We observed that the positive control group exhibited the highest IL-6 expression, showing an increase of up to 24 times compared to metformin-treated cells. However, the difference was not found to be statistically significant, as indicated by Games Howell’s further test. In passage 5, metformin IL-6 expression showed the highest value with a difference of 5 times compared to the negative control and 3 times compared to the positive control. Interestingly, a significant difference in IL-6 expression was observed between the metformin treatment group and both the negative control and positive control groups (Figure 2).
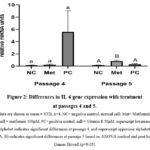 |
Figure 2: Differences in IL-6 gene expression with treatment at passages 4 and 5. |
Discussion
Inflammaging refers to the chronic, low-grade inflammation associated with aging, leading to a diminished capacity to regulate persistent inflammatory processes. This phenomenon may be linked to skin aging, given that the skin, as the outermost organ, is consistently exposed to external stressors such as UV radiation, airborne particles, and the human microbiome.51 Cellular senescence is a program of cessation of cell proliferation, one of which is initiated in response to replicative senescence (RS).52 With age, fibroblast cells produce SASP rich in proinflammatory cytokines, Interleukin-6 (IL-6), Interferon-gamma (IFN-γ), and Tumor necrosis factor alpha (TNF-α).51,53 Aging fibroblast culture research has various terms, one of which is cumulative population doubling (CPD), which is the number of times the number of cells doubles. Cells that are considered senescent are cells that cannot complete one procurement/doubling for 4 weeks by giving fresh media for 3 consecutive weeks.38 To prevent skin aging, several studies have been conducted on natural and synthesized compounds that have a relationship with cell senescence.54 As an anti-diabetic drug, is known to have good anti-inflammatory activity, and research on its anti-aging activity has been conducted.54,55 This study hypothesized that IL-6 gene expression would be lower in the metformin-treated group than in the negative control group in an in vitro human fibroblast cell aging model. However, the result warrant rejection of the null hypothesis that treatment of metformin does not lower the IL-6 gene expression than negative control.
In this study, IL-6 gene expression was measured in 3 treatments (negative control, metformin, and positive control/vitamin E) and 6 cell passages (passages 3, 4, 5, 6, 7, and 8). The results showed that the negative control group produced the lowest IL-6 gene expression value compared to the metformin treatment group and the positive control group. IL-6 expression in negative control cells showed a very small expression value, where the highest result was shown in passage 5 with a value of 0.158 ± 0.05. The present results are in line with earlier research indicating the highest expression of IL-6 in fibroblast cells reached 0.17 in passage 1, and in the following passage, IL-6 expression was at a value of 0.05.56,57 By statistical analysis, the difference in IL-6 expression in the metformin treatment group compared to the negative control group is significant. This can be seen in the descriptive picture of IL-6 expression data (Table 3), especially in passage 4 and 5, it was found that the increase in IL-6 expression in the metformin treatment group and the positive control group was higher when compared to other passage stages. This finding provides new information that metformin has an anti-inflammatory effect on cellular reprogramming related to cell immunosenescence through increased IL-6 expression, although the process of subculture or passage that is carried out repeatedly cannot be ignored in the induction of inflammatory factors in this study.
IL-6 is one of the most prominent cytokines involved in several inflammaging-related diseases.58 Proinflammatory cytokines such as IL-6 are one of the characteristics of the aging-related secretory phenotype (SASP) and are upregulated in cells undergoing replicative senescence (RS).52 Senescent cells represent only a fraction of cells within organ tissues.59 A previous study found that healthy fibroblasts expressed pro-inflammatory cytokines such as IL-6, TNF-α, and IL-8 during passage.56 Therefore, IL-6 secretion in senescent cells only results in very low concentrations.60
The results of this study showed that IL-6 expression after metformin treatment was higher than in the negative group. This result is not comparable to some previous studies, where metformin can reduce the expression of IL-6 and IL-8 in human vascular smooth muscle cells (SMCs), macrophages (Mφs), and endothelial cells (ECs).61 In addition, metformin treatment of liposaccharide (LPS)-induced rabbit annulus fibrosus stem cells (AFSCs) showed that metformin decreased the expression of pro-inflammatory cytokines (IL-1β, IL-6, TNF-α) and MMPs by blocking the translocation of HMGB1 from the cell nucleus to the cytoplasm.62 By contrast, treatment with 0.5 mM metformin in primary human fibroblasts promotes IL-g gene than compared to without the addition of metformin,46 which is in line with present study funding. The higher expression of IL-6 in Metformin treatment may be attributed to the reparative function of IL-6 involved in fibroblast cell differentiation, activation, and proliferation.16 Cytokines such as IL-6 are often referred to as pro-inflammatory, however increased IL-6 can stimulate the production of IL-1 receptor antagonists (anti-inflammatory cytokines).63 In addition, IL-6 knockout mice show reduced insulin sensitivity, glucose intolerance64 and late-onset obesity65; it has also been shown to be important in the regeneration and protection of some tissues (e.g. intestinal epithelial cells).66,67 Therefore, pro-inflammatory cytokines upregulated in response to metformin may be involved in a more complicated role in maintaining pro- and anti-inflammatory cytokine homeostasis.46
This study shows that there are differences in IL-6 gene expression at each passage, which can be observed in all treatments. Previous research showed similar results, where there were differences in IL-6 expression between Synovial fibroblast passage 6, 7, and 8 cells.68 Although IL-6 gene expression between passages showed different values, the difference in IL-6 gene expression between cell passages in the negative and positive control treatments did not show significant differences (p>0.05). This study is in line with previous research, that is, there was no significant difference in IL-6 expression between old and young fibroblasts.53 Moreover, earlier research found that changes in IL-6 expression in passages 3 and 4 were not statistically different, which supports the findings of our study.57 Similarly to Adam Rolt et al., IL-6 expression in human male neonatal foreskin primary fibroblasts (HF043) was not significantly different at passage ‘young’ cells (CPD 36.6) and ‘middle aged’ (CPD 65.5).60 Based on previous studies, antiaging testing of inflammatory cytokine expression in fibroblast cells is carried out at passages 10 to 20 because the fibroblast cell population is known to experience aging at passage 50.46,69 This may be the cause of no significant difference between all passages, especially in the negative control and positive control treatments. However, there were differences in IL-6 expression after metformin treatment, which increased at passage 5 and then decreased until passage 8.
The difference in IL-6 expression at each cell passage may be due to differences in the inflammatory responses regulated by NF-κB. NF-κB plays a role in inducing the expression of various proteins involved in cell proliferation and migration and increases collagen synthesis and fibroblast differentiation.70 In aging skin, increased NF-κB activity decreases the expression of type 1 collagen (COL1A1 and COL1A2) by increasing the expression of collagenase (MMP-1).55,71 In addition, there are differences in the response of fibroblasts to double stress during passage. Passaging can result in selection pressure on parts of the cell population, such as adherent cells and trypsin-sensitive cells, which are released at different flash levels. This can alter the overall gene expression profile at higher passages. Thus, the expression profiles of inflammatory genes in the same cell type can vary between cell passages.72
As we already know, metformin exhibits antiaging activity at the cellular and organismal levels.73 Metformin reduces several effects that are closely associated with signs of aging, such as inflammation,26 autophagy,74 and cellular aging.75 Metformin has anti-inflammatory activity by decreasing the expression of multiple proinflammatory cytokines including IL-6, IL-1β, and TNF-α.76-78 The addition of metformin can modulate the inflammatory process in skin fibroblasts by decreasing the expression of mTOR and STAT3.54 The decrease in mTOR and STAT3 expression results in the inhibition of proinflammatory cytokine expression mediated by mTOR-STAT3 signaling, and can further reduce aging.54,79 The antiaging potential of metformin is reinforced by the results of previous studies, which can increase the antioxidant capacity of cells and increase the production of type I and type III collagen, thus inhibiting the level of intracellular ROS, MMP expression and NF-κB (p65) activity in aging fibroblast cells.55,80 Based on this, metformin shows a cell aging inhibitory effect comparable to vitamin E. Comparison of the antiaging effect of metformin and vitamin E which is not significantly different is shown in the results of the present study which shows insignificant differences in some cell passages, namely passages 3, 6, 7, and 8 (p>0.05). However, this finding needs to be confirmed by further research.
The evaluation of metformin as an anti-aging agent by determining IL-6 gene expression has several limitations. The first limitation lies in the method performed that shows the results of gene expression. Measurement of IL-6 gene expression using RT-PCR does not reflect functional IL-6 protein levels, as cellular regulation can impact several steps between mRNA production and functional protein secretion, including mRNA stability, translational efficiency, post-translational processing, and control of intracellular transport and secretion pathways.60 In this study, phenotyping of each group and passage was not performed because it considers time and cost factors. In further research, a cell morphological phenotype, including cell shape, size, intensity, and texture of cellular compartments, is required to determine changes in cell morphological features with changes in cellular function due to the addition of metformin. Moreover, the evaluation of metformin as an anti-aging agent can be examined in larger passages, and more appropriate proteins such as AMPK, mTOR, p53, IGF-1, EGF, and c-fos, and the activity of senescence-associated-β-galactosidase (SA-β-GAL) can be added for more reasonable statistical power and more reliable results. To complete the research information, it is recommended to conduct further research with variations in metformin concentration on fibroblast cell treatment or on aging cells with higher passage to analyze the anti-aging potential of metformin. In addition, it is expected that in future studies, experiments or in vivo clinical trials can be conducted so that the potential of metformin as an anti-aging agent can be better explored.
Conclusion
The absence of a statistically significant decrease in IL-6 expression compared to the negative control indicates that the metformin treatment did not influence the expression of the IL-6 gene in human fibroblasts. However, a statistically significant difference in IL-6 expression between the treatment groups under the negative control and the positive control suggests potential anti-aging effects of metformin. These findings may contribute to understanding how metformin impacts IL-6 gene expression in aging models of human fibroblast cells and lay the groundwork for further exploration into the anti-aging properties of metformin.
Acknowledgments
The authors are grateful to Drs Astrid Feinisa Khairani, Reti Hindritiani, Oki Suwarsa, and Dr Putri Tessa for fruitful discussions. We would also like to express our thanks to all the staff at the Cell Culture and Cytogenetic Laboratory, Laboratory of Molecular and Genetics, Padjadjaran University, who have assisted in this study.
Conflict of Interest
All authors declare no conflict of interest in the publication of this research.
Funding Sources
This study received no additional funding.
Data Availability
The data used to support the findings are available from the corresponding author upon request.
Reference
- Alves G de AD, Oliveira de Souza R, Ghislain Rogez HL, Masaki H, Fonseca MJV. Cecropia obtusa extract and chlorogenic acid exhibit anti aging effect in human fibroblasts and keratinocytes cells exposed to UV radiation. PLoS One. 2019; 14(5): e0216501.
CrossRef - Ring J. The skin and the environment. Hautarzt, 1993; 44(10): 625-635.
- Madiha F, Mehran R, Alia N, Awan SJ. A systematic review of aging and its causes. Int J Dev Res. 2018; 8(11): 23904-23908.
- Zhang S, Duan E. Fighting against skin aging: the way from bench to bedside. Cell Transplant. 2018; 27(5): 729-738.
CrossRef - Zorina A, Zorin V, Kudlay D, Kopnin P. Age-related changes in the fibroblastic differon of the dermis: role in skin aging. Int J Mol Sci. 2022; 23(11): 6135.
CrossRef - Chaudhary M, Khan A, Gupta M. Skin ageing: Pathophysiology and current market treatment approaches. Curr Aging Sci. 2020; 13(1): 22-30.
CrossRef - Kojima H, Inoue T, Kunimoto H, Nakajima K. IL-6-STAT3 signaling and premature senescence. JAKSTAT. 2013;2(4):e25763. doi:10.4161/jkst.25763
CrossRef - Tobin DJ. Introduction to skin aging. J Tissue Viability., 2017; 26(1): 37-46.
CrossRef - Wong QYA, Chew FT. Defining skin aging and its risk factors: a systematic review and meta-analysis. Sci Rep. 2021; 11(1): 22075.
CrossRef - Borg M, Brincat S, Camilleri G, Schembri-Wismayer P, Brincat M, Calleja-Agius J. The role of cytokines in skin aging. Climacteric. 2013; 16(5): 514-521.
CrossRef - Lee SH, Won G-W, Choi S-H, et al. Antiaging effect of inotodiol on oxidative stress in human dermal fibroblasts. Biomed Pharmacother. 2022; 153: 113311.
CrossRef - Pająk J, Nowicka D, Szepietowski JC. Inflammaging and Immunosenescence as Part of Skin Aging—A Narrative Review. Int J Mol Sci. 2023; 24(9): 7784.
CrossRef - Wang Y, Dong C, Han Y, Gu Z, Sun C. Immunosenescence, aging and successful aging. Front Immunol. 2022; 13: 942796.
CrossRef - Shive C, Pandiyan P. Inflammation, immune senescence, and dysregulated immune regulation in the elderly. Front Aging. 2022; 3: 840827.
CrossRef - Tanaka T, Narazaki M, Kishimoto T. IL-6 in inflammation, immunity, and disease. Cold Spring Harb Perspect Biol. 2014; 6(10): a016295.
CrossRef - Johnson BZ, Stevenson AW, Prêle CM, Fear MW, Wood FM. The role of IL-6 in skin fibrosis and cutaneous wound healing. Biomedicines. 2020; 8(5): 101.
CrossRef - Valiathan R, Ashman M, Asthana D. Effects of ageing on the immune system: infants to elderly. Scand J Immunol. 2016; 83(4): 255-266.
CrossRef - Adriaensen W, Matheï C, Vaes B, Van Pottelbergh G, Wallemacq P, Degryse J-M. Interleukin-6 as a first-rated serum inflammatory marker to predict mortality and hospitalization in the oldest old: A regression and CART approach in the BELFRAIL study. Exp Gerontol. 2015; 69: 53-61.
CrossRef - Brábek J, Jakubek M, Vellieux F, Novotný J, Kolář M, Lacina L, Szabo P, Strnadová K, Rösel D, Dvořánková B, Smetana K Jr. Interleukin-6: molecule in the intersection of cancer, ageing and COVID-19. Int J Mol Sci. 2020 Oct 26;21(21):7937. doi: 10.3390/ijms21217937.
CrossRef - Al-Nuaimi Y, Sherratt MJ, Griffiths CEM. Skin health in older age. Maturitas. 2014; 79(3): 256-264.
CrossRef - Karimkhani C, Dellavalle RP, Coffeng LE, et al. Global skin disease morbidity and mortality: an update from the global burden of disease study 2013. JAMA dermatology. 2017; 153(5): 406-412.
CrossRef - Ganceviciene R, Liakou AI, Theodoridis A, Makrantonaki E, Zouboulis CC. Skin anti-aging strategies. Dermatoendocrinol. 2012; 4(3): 308-319.
CrossRef - Altay BA, Tarbox T, Benetti C. Current Insights into the Formulation and Delivery of Therapeutic and Cosmeceutical Agents for Aging Skin. Cosmetics. 2023; 10(2): 54.
CrossRef - La Fata G, Seifert N, Weber P, Mohajeri MH. Vitamin E Supplementation Delays Cellular Senescence In Vitro. Biomed Res Int. 2015;2015:563247. doi: 10.1155/2015/563247. Epub 2015 Nov 3. PMID: 26613084; PMCID: PMC4647025
CrossRef - Hincal F, Gürbay A, Favier A. Biphasic response of ciprofloxacin in human fibroblast cell cultures. Nonlinearity Biol Toxicol Med. 2003 Oct;1(4):481-92. doi: 10.1080/15401420390271083. PMID: 19330132; PMCID: PMC2656119.
CrossRef - Barzilai N, Crandall JP, Kritchevsky SB, Espeland MA. Metformin as a tool to target aging. Cell Metab. 2016; 23(6): 1060-1065.
CrossRef - Kulkarni AS, Gubbi S, Barzilai N. Benefits of metformin in attenuating the hallmarks of aging. Cell Metab. 2020; 32(1): 15-30.
CrossRef - Zhao Z, Cheng X, Wang Y, Han R, Li L, Xiang T, He L, Long H, Zhu B, He Y. Metformin inhibits the IL-6-induced epithelial-mesenchymal transition and lung adenocarcinoma growth and metastasis. PLoS One. 2014 Apr 30;9(4):e95884. doi: 10.1371/journal.pone.0095884.
CrossRef - Cameron AR, Morrison VL, Levin D, Mohan M, Forteath C, Beall C, McNeilly AD, Balfour DJ, Savinko T, Wong AK, Viollet B, Sakamoto K, Fagerholm SC, Foretz M, Lang CC, Rena G. Anti-inflammatory effects of metformin irrespective of diabetes status. Circ Res. 2016 Aug 19;119(5):652-665. doi: 10.1161/CIRCRESAHA.116.308445.
CrossRef - Alshibani N, AlKattan R, Allam E, Alshehri FA, Shalabi MM, Almuhanna N, Almarshad H, Aljamili A. Effects of metformin on human gingival fibroblasts: an in vitro study. BMC Oral Health. 2023 May 15;23(1):292-299. doi: 10.1186/s12903-023-02978-0.
CrossRef - Takada K, Amano S, Kohno Y, Nishiyama T, Inomata S. Non-invasive study of gelatinases in sun-exposed and unexposed healthy human skin based on measurements in stratum corneum. Arch Dermatol Res. 2006; 298: 237-242.
CrossRef - Hamudin A, Atik N. Mechanism of action of metformin as an anti-aging agent: a literature review. Intisari Sains Medis. 2021 Jul 14;12(2):453-8.
CrossRef - Slack C, Foley A, Partridge L. Activation of AMPK by the Putative Dietary Restriction Mimetic Metformin Is Insufficient to Extend Lifespan in Drosophila. PLoS One. 2012;7(10):1–7.
CrossRef - Song J, Jiang G, Zhang J, Guo J, Li Z, Hao K, Liu L, Cheng Z, Tong X, Dai F. Metformin prolongs lifespan through remodeling the energy distribution strategy in silkworm, Bombyx mori. Aging (Albany NY). 2019 Jan 13;11(1):240-248. doi: 10.18632/aging.101746.
CrossRef - Kulkarni AS, Brutsaert EF, Anghel V, Zhang K, Bloomgarden N, Pollak M, Mar JC, Hawkins M, Crandall JP, Barzilai N. Metformin regulates metabolic and nonmetabolic pathways in skeletal muscle and subcutaneous adipose tissues of older adults. Aging Cell. 2018 Apr;17(2):e12723. doi: 10.1111/acel.12723.
CrossRef - Novelle MG, Ali A, Diéguez C, Bernier M, de Cabo R. Metformin: a hopeful promise in aging research. Cold Spring Harb Perspect Med. 2016; 6(3): a025932.
CrossRef - Hu D, Xie F, Xiao Y, Lu C, Zhong J, Huang D, Chen J, Wei J, Jiang Y, Zhong T. Metformin: a potential candidate for targeting aging mechanisms. Aging Dis. 2021 Apr 1;12(2):480-493. doi: 10.14336/AD.2020.0702.
CrossRef - Chen H, Li Y, Tollefsbol TO. Cell senescence culturing methods. Biol Aging Methods Protoc. 2013: 1-10.
CrossRef - Rocha A, Magalhães S, Nunes A. Cell Culture Studies: A Promising Approach to the Metabolomic Study of Human Aging. Current Metabolomics and Systems Biology Formerly: Current Metabolomics. 2021 Mar 1;8(1):1-26.
CrossRef - Geraghty RJ, Capes-Davis A, Davis JM, Downward J, Freshney RI, Knezevic I, Lovell-Badge R, Masters JR, Meredith J, Stacey GN, Thraves P, Vias M; Cancer Research UK. Guidelines for the use of cell lines in biomedical research. Br J Cancer. 2014 Sep 9;111(6):1021-46. doi: 10.1038/bjc.2014.166. Epub 2014 Aug 12. PMID: 25117809; PMCID: PMC4453835.
CrossRef - Singh M, Sharma AK. Outgrowth of fibroblast cells from goat skin explants in three different culture media and the establishment of cell lines. In Vitro Cell.Dev.Biol.Animal. 2011; 47:83–88
CrossRef - Justice JN, Niedernhofer L, Robbins PD, Aroda VR, Espeland MA, Kritchevsky SB, Kuchel GA, Barzilai N. Development of clinical trials to extend healthy lifespan. Cardiovasc Endocrinol Metab. 2018 Dec;7(4):80-83. doi: 10.1097/XCE.0000000000000159.
CrossRef - Chen S, Gan D, Lin S, Zhong Y, Chen M, Zou X, Shao Z, Xiao G. Metformin in aging and aging-related diseases: Clinical applications and relevant mechanisms. Theranostics. 2022 Mar 6;12(6):2722-2740. doi: 10.7150/thno.71360.
CrossRef - Nadalutti CA, Wilson SH. Using Human Primary Foreskin Fibroblasts to Study Cellular Damage and Mitochondrial Dysfunction. Curr Protoc Toxicol. 2020; 86(1): e99.
CrossRef - Davison PM, Bensch K, Karasek MA. Isolation and growth of endothelial cells from the microvessels of the newborn human foreskin in cell culture. J Invest Dermatol. 1980; 75(4): 316-321.
CrossRef - Gillespie ZE, Wang C, Vadan F, Yu TY, Ausió J, Kusalik A, Eskiw CH. Metformin induces the AP-1 transcription factor network in normal dermal fibroblasts. Sci Rep. 2019 Mar 29;9(1):5369. doi: 10.1038/s41598-019-41839-1.
CrossRef - Mo Y, Wan R, Zhang Q. Application of reverse transcription-PCR and real-time PCR in nanotoxicity research. Nanotoxicity methods Protoc. 2012: 99-112.
CrossRef - Berawi KN, Maskoen AM, Akbar L. Decreased Expression of Peroxisome Proliferator-activated Receptor α Gene as an Indicator of Metabolic Disorders in Stunting Toddler. Open Access Maced J Med Sci. 2020; 8(A): 175-180.
CrossRef - Mishra P, Pandey CM, Singh U, Gupta A, Sahu C, Keshri A. Descriptive statistics and normality tests for statistical data. Ann Card Anaesth. 2019 Jan-Mar;22(1):67-72. doi: 10.4103/aca.ACA_157_18. PMID: 30648682; PMCID: PMC6350423.
CrossRef - Lee S, Lee DK. What is the proper way to apply the multiple comparison test? Korean J Anesthesiol. 2018 Oct;71(5):353-360. doi: 10.4097/kja.d.18.00242. Epub 2018 Aug 28. Erratum in: Korean J Anesthesiol. 2020 Dec;73(6):572. PMID: 30157585; PMCID: PMC6193594.
CrossRef - Lee YI, Choi S, Roh WS, Lee JH, Kim T-G. Cellular senescence and inflammaging in the skin microenvironment. Int J Mol Sci. 2021; 22(8): 3849.
CrossRef - Van Deursen JM. The role of senescent cells in ageing. Nature. 2014; 509(7501): 439-446.
CrossRef - Wolf J, Weinberger B, Arnold CR, Maier AB, Westendorp RGJ, Grubeck-Loebenstein B. The effect of chronological age on the inflammatory response of human fibroblasts. Exp Gerontol. 2012; 47(9): 749-753.
CrossRef - Moon J, Lee SY, Choi JW, Lee AR, Yoo JH, Moon SJ, Park SH, Cho ML. Metformin ameliorates scleroderma via inhibiting Th17 cells and reducing mTOR-STAT3 signaling in skin fibroblasts. J Transl Med. 2021 May 4;19(1):192. doi: 10.1186/s12967-021-02860-z.
CrossRef - Soydas T, Yaprak Sarac E, Cinar S, Dogan S, Solakoglu S, Tuncdemir M, Kanigur Sultuybek G. The protective effects of metformin in an in vitro model of aging 3T3 fibroblast under high glucose conditions. J Physiol Biochem. 2018 May;74(2):273-281. doi: 10.1007/s13105-018-0613-5.
CrossRef - Kent L. Effect of in vitro passage of healthy human gingival fibroblasts on cellular morphology and cytokine expression. Archs oral Biol. 1996; 41: 263.
CrossRef - Karlis GD, Schoenmaker T, Tsoromokos N, Veth OE, Loos BG, de Vries TJ. Passaging of gingival fibroblasts from periodontally healthy and diseased sites upregulates osteogenesis-related genes. Hum Cell. 2024;37(1): 193-203.
CrossRef - Gomez CR, Karavitis J, Palmer JL, Faunce DE, Ramirez L, Nomellini V, Kovacs EJ. Interleukin-6 contributes to age-related alteration of cytokine production by macrophages. Mediators Inflamm. 2010;2010:475139. doi: 10.1155/2010/475139.
CrossRef - Ghosh K, Capell BC. The senescence-associated secretory phenotype: critical effector in skin cancer and aging. J Invest Dermatol. 2016;136(11):2133-2139.
CrossRef - Rolt A, Nair A, Cox LS. Optimisation of a screening platform for determining IL-6 inflammatory signalling in the senescence-associated secretory phenotype (SASP). Biogerontology. 2019;20(3):359-371.
CrossRef - Feng X, Chen W, Ni X, Little PJ, Xu S, Tang L, Weng J. Metformin, Macrophage Dysfunction and Atherosclerosis. Front Immunol. 2021 Jun 7;12:682853. doi: 10.3389/fimmu.2021.682853. PMID: 34163481; PMCID: PMC8215340.
CrossRef - Han Y, Yuan F, Deng C, He F, Zhang Y, Shen H, Chen Z, Qian L. Metformin decreases LPS-induced inflammatory response in rabbit annulus fibrosus stem/progenitor cells by blocking HMGB1 release. Aging (Albany NY). 2019; 11(22): 10252-10265.
CrossRef - Gabay C, Smith MF, Eldlen D, Arend WP. Interleukin 1 receptor antagonist (IL-1Ra) is an acute-phase protein. J Clin Invest. 1997;99:2930–2940. doi: 10.1172/JCI119488.
CrossRef - Matthews VB, Allen TL, Risis S, Chan MH, Henstridge DC, Watson N, Zaffino LA, Babb JR, Boon J, Meikle PJ, Jowett JB, Watt MJ, Jansson JO, Bruce CR, Febbraio MA. Interleukin-6-deficient mice develop hepatic inflammation and systemic insulin resistance. Diabetologia. 2010 Nov;53(11):2431-41. doi: 10.1007/s00125-010-1865-y.
CrossRef - Wallenius V, Wallenius K, Ahrén B, Rudling M, Carlsten H, Dickson SL, Ohlsson C, Jansson JO. Interleukin-6-deficient mice develop mature-onset obesity. Nat Med. 2002 Jan;8(1):75-9. doi: 10.1038/nm0102-75.
CrossRef - Grivennikov S, Karin E, Terzic J, Mucida D, Yu GY, Vallabhapurapu S, Scheller J, Rose-John S, Cheroutre H, Eckmann L, Karin M. IL-6 and Stat3 are required for survival of intestinal epithelial cells and development of colitis-associated cancer. Cancer Cell. 2009 Feb 3;15(2):103-13. doi: 10.1016/j.ccr.2009.01.001.
CrossRef - Dann SM, Spehlmann ME, Hammond DC, Iimura M, Hase K, Choi LJ, Hanson E, Eckmann L. IL-6-dependent mucosal protection prevents establishment of a microbial niche for attaching/effacing lesion-forming enteric bacterial pathogens. J Immunol. 2008 May 15;180(10):6816-26. doi: 10.4049/jimmunol.180.10.6816.
CrossRef - Noss EH, Nguyen HN, Chang SK, Watts GFM, Brenner MB. Genetic polymorphism directs IL-6 expression in fibroblasts but not selected other cell types. Proc Natl Acad Sci. 2015; 112(48): 14948-14953.
CrossRef - Bridger JM, Kill IR, O’Farrell M, Hutchison CJ. Internal lamin structures within G1 nuclei of human dermal fibroblasts. Journal of Cell Science. 1993;104:297–306.
CrossRef - Sun LQ, Zhao J, Zhang TT, Qu L, Wang X, Xue B, Li XJ, Mu YM, Lu JM. Protective effects of Salvianolic acid B on Schwann cells apoptosis induced by high glucose. Neurochem Res. 2012 May;37(5):996-1010. doi: 10.1007/s11064-011-0695-8.
CrossRef - Visse R, Nagase H. Matrix metalloproteinases and tissue inhibitors of metalloproteinases: structure, function, and biochemistry. Circ Res. 2003; 92(8): 827-839.
CrossRef - Neumann E, Riepl B, Knedla A, Lefèvre S, Tarner IH, Grifka J, Steinmeyer J, Schölmerich J, Gay S, Müller-Ladner U. Cell culture and passaging alters gene expression pattern and proliferation rate in rheumatoid arthritis synovial fibroblasts. Arthritis Res Ther. 2010;12(3):R83. doi: 10.1186/ar3010.
CrossRef - Song R. Mechanism of metformin: a tale of two sites. Diabetes Care. 2016; 39(2): 187-189.
CrossRef - Guo Y, Shi J, Wang Q, Hong L, Chen M, Liu S, Yuan X, Jiang S. Metformin alleviates allergic airway inflammation and increases Treg cells in obese asthma. J Cell Mol Med. 2021 Feb;25(4):2279-2284. doi: 10.1111/jcmm.16269.
CrossRef - Lu G, Wu Z, Shang J, Xie Z, Chen C. The effects of metformin on autophagy. Biomed Pharmacother. 2021; 137: 111286.
CrossRef - Arai Y, Martin-Ruiz CM, Takayama M, Abe Y, Takebayashi T, Koyasu S, Suematsu M, Hirose N, von Zglinicki T. Inflammation, but not telomere length, predicts successful ageing at extreme old age: a longitudinal study of semi-supercentenarians. EBioMedicine. 2015 Jul 29;2(10):1549-58. doi: 10.1016/j.ebiom.2015.07.029.
CrossRef - Cheng F-F, Liu Y-L, Du J, Lin JT. Metformin’s mechanisms in attenuating hallmarks of aging and age-related disease. Aging Dis. 2022; 13(4): 970.
CrossRef - Xu S, Yang Z, Jin P, Yang X, Li X, Wei X, Wang Y, Long S, Zhang T, Chen G, Sun C, Ma D, Gao Q. Metformin suppresses tumor progression by inactivating stromal fibroblasts in ovarian cancer. Mol Cancer Ther. 2018 Jun;17(6):1291-1302. doi: 10.1158/1535-7163.MCT-17-0927.
CrossRef - Esparza-López J, Alvarado-Muñoz JF, Escobar-Arriaga E, Ulloa-Aguirre A, de Jesús Ibarra-Sánchez M. Metformin reverses mesenchymal phenotype of primary breast cancer cells through STAT3/NF-κB pathways. BMC Cancer. 2019; 19(1): 1-13.
CrossRef - Cui B, Liu Q, Tong L, Feng X. The effects of the metformin on inhibition of UVA-induced expression of MMPs and COL-I in human skin fibroblasts. Eur J Inflamm. 2019; 17: 1–5
CrossRef

