
G Hari Krishnan1* , Sheeba Santhosh2, G Mohandass3 and T Sudhakar4
1Department of Electrical and Electronics Engineering, Sree Vidyanikethan Engineering College, Mohan Babu University, Tirupati, Andhra Pradesh, India.
2Department of Electronics and Communication Engineering, Panimalar Engineering College, Chennai, India
3Department of Biomedical Engineering, Saveetha School of Engineering, Saveetha Institute of Medical and Technical Sciences, Saveetha University, Chennai, India
4Department of Biomedical Engineering, Sathyabama Institute of Science and Technology, Chennai, India.
Corresponding Author E-mail: haris_eee@yahoo.com
DOI : https://dx.doi.org/10.13005/bpj/2903
Abstract
Electrical characterization of biological tissues offers a promising non-invasive approach to understanding tissue properties. This research rigorously examines how bio-impedance values are influenced by the frequency of the input signal and the strategic placement of electrodes. Utilizing the capabilities of the AD5933 evaluation board by Analog Devices, the study spanned a frequency range from 1KHz to 200 KHz. The results highlighted a significant decrease in impedance with increasing frequency, a trend attributed to the capacitive characteristics of cell membranes. Moreover, the specific distance between electrodes was identified as a crucial factor affecting measurement accuracy. Given these findings, the adaptation of this technique in healthcare settings, particularly in diagnostics, could offer enhanced precision, underscoring its potential relevance in clinical practice.
Keywords
Bio-Impedance; Electrode Positioning; Electrical Properties; Input Signal Frequency; Pathological Conditions; Tetra Polar Electrode
Download this article as:| Copy the following to cite this article: Krishnan G. H, Santhosh S, Mohandass G, Sudhakar T. Non-Invasive Bio-impedance Diagnostics: Delving into Signal Frequency and Electrode Placement Effects. Biomed Pharmacol J 2024;17(2). |
| Copy the following to cite this URL: Krishnan G. H, Santhosh S, Mohandass G, Sudhakar T. Non-Invasive Bio-impedance Diagnostics: Delving into Signal Frequency and Electrode Placement Effects. Biomed Pharmacol J 2024;17(2). Available from: https://bit.ly/4bFCY9I |
Introduction
Bio-impedance spectroscopy has emerged as a powerful non-invasive technique for assessing the electrical properties of biological tissues and their physiological conditions. This method utilizes the variation in impedance, which includes resistance and reactance, in response to alternating current signals across a range of frequencies. The electrical properties of tissues are influenced by factors such as cell composition, fluid distribution, and cellular membrane characteristics. Therefore, bio-impedance spectroscopy has found applications in fields ranging from medical diagnosis to monitoring changes in body composition [1]. Recent advances in biomedical engineering have emphasized the significance of electrode designs and their impact on capturing bioelectrical signals. A comb-shaped surface electrode for measuring signals from tissues cultured with electric stimulation, underscoring the need for innovative designs in achieving precise measurements. Similarly, the relevance of design configurations in recording bioelectric signals, particularly in the assessment of ultraviolet radiation effects on tissues [3].
Implantable electrodes and their biocompatibility are also of paramount importance. The investigation on tissue reactions to a polyimide cuff electrode implanted around the sciatic nerves of rats, emphasizing the challenges associated with foreign body responses and the importance of selecting appropriate insulating materials [2]. Further delving into the technical aspects, Finite element model was utilized to simulate surface EMG signals. They focused on the role of dielectric properties and electrode configurations in influencing the myoelectric activity detected at the surface, highlighting the critical interplay between electrode design and tissue properties [4].
Moreover, the integration of optical measurements with bioelectrical readings has garnered attention. A novel photometric patch electrode capable of simultaneous neural electrical activity and optical signal measurements in brain tissues, underscoring the potential of such integrative approaches in advancing diagnostic and investigative capabilities [5]. The field of bio-impedance is witnessing a shift towards Multi-frequency Bio-impedance Analysis (MF-BIA), allowing simultaneous measurements across various frequencies for comprehensive tissue assessment. Coupled with this, advancements in wearable bio-impedance devices enable continuous monitoring, blending diagnostic precision with user convenience, aligning seamlessly with tele-health and real-time health monitoring trends.
Bio-impedance approaches are fully reliant on the use of a high-frequency low-intensity input signal. The key determinants of bio-impedance diagnosis depend on the frequency [6] at which the measurement is carried out, the type of electrode, electrode location and the separation between the electrodes. The error generated during the measurement depends on the frequency [7] at which the measurement is performed as well as on the intensity of the applied current. As a result, choosing the right amplitude of current and frequency utilized for measurement is crucial. The flow of current through a biological tissue relies completely on the electrical characteristics of the tissue [8] and also on the electrical characteristics of the applied signal. The intracellular fluid behaves as a good conductor of electricity and therefore develops a resistance for any applied alternating current. The presence of ionic components in the extracellular fluid develops resistance [9] to any flow of current in the extracellular region. The internal and external cellular fluids, separated by the cell membrane which act as capacitance storing the charges at either side of the membrane when excited by an external applied current. The capacitance developed by the cell membrane induces capacitive reactance which depends on the structural composition of the membrane as well as on the applied signal frequency [10]. The frequency of the excited signal has an inverse relationship with the capacitive reactance(Xc = 1/2πfC). Thus, an electrical bio-impedance is generated by the resistance offered by the intracellular and extracellular fluid [11] and also by the capacitance that has developed across the cell membrane.
 |
Figure 1: Equivalent circuit representation of cell. |
The generalized electrical circuit representation of cell and its associated impedance is shown in figure1.The bio-impedance generated varies according to the input excitation current and its frequency. To perform any measurement using bio-impedance technique it is crucial to identify the variation in the peak bio-impedance value with respect to the frequency. For this purpose AD5933 evaluation board by Analog Devices were chosen. It is an impedance generating system with great precision [12] that estimates the peak magnitude and corresponding phase of the impedance at regular frequency points. Experiment was conducted by applying a low magnitude current using two of electrodes. These electrodes are positioned at the lower part of the neck exactly at the latero-cervical region. Other set of two electrodes are positioned at the mid axillaries line at the upper abdominal region [13].
The induced electric current takes its path through the aorta and the venae cavae of thoracic region. This flow of current depends on blood volume [14] [15] of the underlying tissue and therefore produces trans-thoracic impedance that changes according to the blood flow. Using a constant current source of 10mA, measurement of impedance was performed by varying the frequency from 1KiloHertz to 100 KHz. Generated bio-impedance signal is influenced by blood flow and blood volume, distribution of current [16] and variations in the blood flow resistance in the place where electrodes are positioned. A sine wave with voltage of 2V(P-P) was selected from the current source. To obtain an undistorted impedance wave, the feedback resistor connected between the voltage pins Vin and Vout was adjusted to ensure correct calibration.. After the initial configuration, set values were loaded into the register of the program device and the set up were completed to determine the factor of gain. The frequency was varied to excite tissue with various predefined range of frequency. Impedance values were tabulated and graph was plotted against the signal frequency and the mean impedance value as shown in figure 1.
The study of bio-impedance spectroscopy has garnered significant attention due to its potential in providing insights into various physiological and pathological conditions [17]. They emphasized that the selection of appropriate frequency and current amplitude is crucial for accurate measurements. Measurement error varies with frequency and current intensity, underlining the need for careful consideration in experimental design were highlighted [19].Researchers have investigated the role of electrode positioning in bio-impedance measurements [20]. The type of electrode used and its distance from the tissue surface can introduce variations in the obtained impedance values. Different types of electrodes, such as disposable foam pad electrodes, metallic disc electrodes, metallic plate electrodes, and suction cup electrodes, have been explored for their suitability in bio-impedance measurements.
In this study, we delve into the nuanced dynamics of bio-impedance signals, focusing on two central variables: input signal frequency and electrode positioning. Initially, we use the AD5933 evaluation board to examine how varying frequencies influence bio-impedance. Subsequently, we pivot to assess the role of electrode placement, experimenting with different types, including foam pad and metallic disc electrodes. By systematically altering electrode positions and distances, and measuring impedance across varied frequencies, we aim to discern the optimal conditions for precise bio-impedance readings.
Materials and Methodology
Electrodes can be constructed from a wide range of materials. Silver, titanium, copper, platinum are the most common materials utilized. Electrodes made of silver-silver chloride are commonly utilized for measurement of bio-impedance. The electrodes [21] [22] are generally categorized as gel type, capacitive type, active and passive type. For bio potential measuring system, electrodes are categorized as metal surface electrodes that are non-invasive and microelectrodes that are invasive [23]. Most popularly used metal surface electrodes can be further classified as
Disposable foam pad electrodes
Metallic disc electrodes
Metallic plate electrodes
Suction cup electrodes
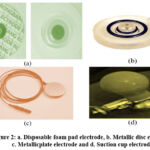 |
Figure 2: a. Disposable foam pad electrode, b. Metallic disc electrode, |
For measurement and diagnosis need most often used electrode is foam pad disposable type electrode which can be used for patients undergoing surgery and for those suffering from contagious condition. This type of electrode has a silver plate disc with electrolytic gel which is coated with silver chloride layer and the foam is occupied by an adhesive biocompatible material [24] [25]. The substrate comprising of silver is submerged in chlorine ion solution and electrolysis is done. The copper wire connected to the electrode helps in transuding ionic currents into electrical current thus picking up the bio signals. The non polarisable behaviour of the silver- silver chloride electrode produces less electrical noise. Therefore, this type of electrode is preferred for measuring low voltage bio signals [26] [27]. Metallic suction cup surface electrodes do not require any adhesive. These types of electrodes are easy to place on the surface of the skin without causing any irritation to skin [28].
Bio-impedance analysis (BIA) serves as a critical tool in correlating the impedance values of biological tissues to specific physiological or pathological states. When examining body composition, a diminished impedance value often denotes an increased water or muscle content, while heightened impedance suggests a predominant fat presence, proving pivotal for evaluations related to obesity and malnutrition. Fluid status in patients can also be gauged: a spike in impedance may signal dehydration, whereas a drop may highlight edema, especially crucial for patients with heart or renal ailments. Monitoring wound recovery is another application. If an injured area displays a progressive decline in impedance, it’s indicative of enhanced blood flow and healing; conversely, stagnant or rising values may signify potential necrosis. In the context of pulmonary examinations, particularly for conditions like congestive heart failure, an upswing in thoracic impedance can be suggestive of decreased fluid accumulation in the lungs. Additionally, the differentiation between malignant and benign tumors can be aided by BIA, as malignant growths may present distinct impedance values in contrast to benign ones or the adjacent tissues. While less conventional, bone health assessments can also leverage BIA. Variations in impedance could potentially infer changes in bone mineral density, offering insights for osteoporosis screenings.
Hardware Description
For our bio-impedance evaluations, we made use of the AD5933 impedance converter system from Analog Devices, Inc. This tool combines a frequency generator with a 12-bit, 1 MSPS ADC. By exciting external complex impedance at a specified frequency, the AD5933 records the resultant signal through its in-built ADC. A subsequent Discrete Fourier Transform is carried out by the onboard DSP, providing real and imaginary data values for each frequency point. After calibration, this enables the precise calculation of both the impedance magnitude and phase. The internal circuit for our AD5933-based bio-impedance measuring system is depicted in Figure 3, illustrating its design and interconnections. This system’s demonstrated proficiency in bioelectrical impedance analysis made it particularly suitable for our research activities.
 |
Figure 3A: Schematic of the AD5933-Based Bio-Impedance Measuring Circuitry |
To analyze the impact of electrode positioning and its distance experiment was carried out by a waveform generator with variable frequency AD5955evaluation board which is an impedance analyzer [29] [30]. A sine wave of 2V peak to peak excitation signal is generated with a frequency of 500Hz. The frequency of the signal is varied in step of 100 from 500Hz to 10 KHz and the variation in the peak bio-impedance value is observed. Bio-impedance is obtained with the help of electrodes. Different type of electrodes are available for measurement purpose, but most commonly used electrode for bio-impedance measurement is silver-silver chloride surface electrode [31] [32] Widely utilized measuring set up for electrode system is the tetra polar system, where four electrodes are used [33] [34]. One set of electrodes introduced for injecting the input signal and another set of electrodes is utilized to detect the output potential [35] [36]. The separation between the output electrodes plays a significant role in the diagnosis. Thus, distance between output electrodes is varied in accordance with the frequency of the excitation signal [37] [38].
The experiment involves assessing the impact of electrode positioning and signal frequency on bio-impedance measurements [39] [40]. A waveform generator with a variable frequency AD5955 evaluation board, serving as an impedance analyzer, is used [41] [42]. A sine wave with a 2V peak-to-peak excitation signal is generated at a frequency of 500Hz. The frequency is varied in increments of 100Hz from 500Hz to 10 KHz, and the corresponding peak bio-impedance values are observed [43] [44]. The tetra polar electrode setup is employed, utilizing four electrodes. One set of electrodes injects the input signal, while another set detects the output potential. The separation between the output electrodes is varied based on the frequency of the excitation signal.
Frequency Dependence Analysis
The variation in the magnitude and phase of the bio-impedance signal is analyzed and tabulated for different frequencies. The mean impedance values and standard deviations are computed and recorded in Table 1. The analysis shows that the impedance value decreases as the frequency increases. At lower frequencies, the impedance is higher due to the dominance of extracellular fluid conductance. As the frequency increases, the capacitive reactance decreases, allowing current to penetrate the cell membrane, resulting in decreased impedance.
Electrode Distance and Impedance:
To evaluate the influence of electrode distance on bio-impedance, experiments are conducted with varying electrode spacing. The peak impedance values for different electrode distances are recorded in Table 2. The results show a linear correlation between electrode spacing and peak impedance values. As the distance between electrodes increases, the impedance magnitude also increases. This emphasizes the importance of accurate electrode placement to ensure undistorted peak impedance values.
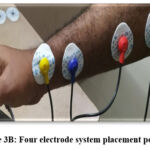 |
Figure 3B: Four electrode system placement position. |
Results and Discussion
Our experiment aimed to investigate the relationship between impedance and frequency, as well as the effects of electrode spacing on peak impedance. The results have provided several specific insights which will be discussed in depth below.
Impedance Variation with Frequency:
As shown in Table 1, there’s a distinct trend observed in the variation of impedance with frequency. Specifically, the mean impedance value drops significantly as we move from 1KHz to 200KHz.
Table 1: Variation of Impedance with frequency
|
S.NO |
FREQUENCY (HZ) |
MEAN IMPEDANCE (Ω) |
STANDARD DEVIATION |
|
1 |
1K |
1316.43 |
6.54 |
|
2 |
10K |
1258.13 |
5.74 |
|
3 |
20K |
738.25 |
3.88 |
|
4 |
30K |
615.66 |
2.46 |
|
5 |
40K |
567.12 |
2.13 |
|
6 |
50K |
502.52 |
1.77 |
|
7 |
60K |
469.74 |
1.36 |
|
8 |
70K |
413.36 |
2.19 |
|
9 |
80K |
353.78 |
3.14 |
|
10 |
90K |
279.47 |
4.36 |
|
11 |
100K |
221.36 |
1.79 |
|
12 |
110K |
219.58 |
3.3 |
|
13 |
120K |
215.88 |
1.93 |
|
14 |
130K |
210.16 |
2.06 |
|
15 |
140K |
195.24 |
4.5 |
|
16 |
150K |
189.47 |
0.86 |
|
17 |
160K |
185.14 |
3.87 |
|
18 |
170K |
176.18 |
1.36 |
|
19 |
180K |
162.77 |
2.69 |
|
20 |
200K |
157.93 |
2.84 |
At 1KHz, the mean impedance is 1316.43Ω with a standard deviation of 6.54. By the time we reach 200KHz, this value drops to 157.93Ω with a standard deviation of 2.84. This is a remarkable decrease by almost 87.99% over this frequency range. The largest drop in mean impedance is observed between 10KHz and 20KHz, where the value falls by approximately 41.26%. This interval provides a crucial insight into the behaviour of biological tissues and their capacitive and resistive components. Figure 4, which visually plots the mean impedance against frequency, reaffirms the inverse relationship seen in the tabulated data. The graphical representation makes it evident that the impedance values drop sharply initially and then begin to plateau at higher frequencies. This behaviour is consistent with the theoretical understanding that at lower frequencies, the capacitive reactance of cell membranes dominates, thereby showing higher impedance due to restricted current penetration. As frequency rises, this capacitive barrier reduces, allowing more current to penetrate through the cell membrane, leading to a decrease in impedance values.
Peak Impedance Variation with Electrode Distance:
Table 2 and Figure 5 shed light on another important aspect of our study – the relationship between electrode distance and peak impedance. Starting from an electrode distance of 4 cm which records a peak impedance of 201Ω, we see a linear increase in impedance as the distance increases, culminating in 230Ω at 22 cm. It is evident that as the spacing between electrodes increases, so does the magnitude of impedance. This is particularly significant between distances of 4 cm and 22 cm, showing an increase of approximately 14.42%.
 |
Figure 4: Mean impedance plot with respect to frequency |
Table 2: Variation of peak impedance with electrode distance
|
S.NO |
ELECTRODE DISTANCE (CM) |
PHASE |
MAGNITUDE |
PEAK IMPEDANCE (OHM) |
|
1 |
22 |
9.64 |
6732.603 |
230 |
|
2 |
20 |
11.04 |
6530.755 |
225 |
|
3 |
18 |
11.48 |
6489.356 |
221 |
|
4 |
16 |
6.82 |
6344.05 |
219 |
|
5 |
14 |
12.37 |
6314.951 |
217 |
|
6 |
12 |
13.05 |
6028.763 |
209 |
|
7 |
10 |
13.19 |
6020.925 |
205 |
|
8 |
8 |
7.74 |
6000.469 |
204 |
|
9 |
6 |
7.58 |
5858.264 |
193 |
|
10 |
4 |
7.32 |
5955.906 |
201 |
 |
Figure 5: Peak Impedance variations with respect to Electrode spacing. |
It is also interesting to note the phase variations across different distances. For instance, the phase at 4 cm is 7.32, and it shows variability, reaching a maximum of 13.19 at a 10 cm distance, before reducing again. The direct relationship between electrode spacing and peak impedance emphasizes the importance of precise electrode placement. To ensure accurate bio-impedance measurements, attention must be given to the exact distance between electrodes, especially as the magnitude of impedance is found to increase linearly with spacing.
Conclusion
In our comprehensive study on bio-impedance analysis, we meticulously examined two key parameters: the relationship between signal frequency and impedance, and the influence of electrode spacing on peak impedance. Our experimental data from Table 1 revealed a notable decrease in mean impedance, specifically a reduction of approximately 87.99% as we transitioned from 1KHz to 200KHz. This highlights the pivotal role of frequency selection in obtaining accurate impedance readings. Similarly, the data from Table 2 demonstrated a linear increase in peak impedance of roughly 14.42% as electrode spacing ranged from 4 cm to 22 cm. This emphasizes the paramount importance of precise electrode positioning for accurate measurements. Thus, we’ve established concrete relationships between signal frequency, electrode positioning, and bio-impedance, presenting foundational insights that are crucial for enhancing the precision of bio-impedance diagnostics in diverse healthcare applications.
Future Scope
Exploring the effects of varying tissue thickness and type can yield deeper insights into impedance values across diverse biological samples. Additionally, investigating the influence of different current amplitudes on impedance can further refine our understanding of bio-impedance behaviour, emphasizing the need for meticulous experimental setups.
References
- S. Hashimoto et al., “Design of comb-shaped surface electrode to measure signal from tissue cultured with electric stimulation,” in WMSCI 2016 – 20th World Multi-Conference on Systemics, Cybernetics and Informatics, Proceedings, 2016, vol. 2, pp. 99-104.
- Baumgartner R. N, Chumlea W. C, Roche A. F (1988), “Bioelectric impedance phase angle and body composition”, Am. J. Clin. Nutr., vol.48, pp.16–23.
CrossRef - Beckmann L., Riesen D., Leonhardt S. (2007), “Optimal electrode placement and frequency range selection for the detection of lung water using Bioimpedance Spectroscopy”, In the Proceedings of the 29th Annual International Conference of the IEEE EMBS Cité International, Lyon, France August 23-26, pp. 2685-2688.
CrossRef - Bera T. K.,Nagaraju J. (2011), “Electrical Impedance Spectroscopic Study Of Broiler Chicken Tissues Suitable For The Development Of Practical Phantoms In Multifrequency EIT,” Journal of Electrical Bioimpedance, Vol. 2, pp. 48–63.
CrossRef - Caicedo-Eraso J. C., González-Correa C. H., González-Correa C. A. (2012), “Use of electrocardiogram (ECG) electrodes for Bioelectrical Impedance Analysis (BIA)”, Journal of Physics: Conference Series 407 012008.
CrossRef - Cornish B, Ward L, Thomas B, Jebb S, Elia M (1996), “Evaluation of multiple frequency bioelectrical impedance and cole-cole analysis for the assessment of body water volumes in healthy humans”, Eur. J. Clin. Nutr., vol.50, pp.159–164.
- Cox-Reijven P L and Soeters P B (2000), “Validation of bio-impedance spectroscopy: Effects of degree of obesity and ways of calculating volumes from measured resistance values”, International Journal of Obesity, vol.24, pp.271-280.
CrossRef - Dai T. and Adler A. (2009), “In vivo blood characterisation from bioimpedance spectroscopy of blood pooling”, IEEE Trans. on Instr. And Meas., vol.58, no.11, pp.3831-3838.
CrossRef - Krishnan, G.H., Natarajan, R.A., and Nanda, A., “Comparative study of rheumatoid arthritis diagnosis using two methods,” Biomedical and Pharmacology Journal, vol. 7, no. 1, pp. 379-381, 2014. doi: 10.13005/bpj/502
CrossRef - Hari Krishnan, G.H., Ananda Natarajan, R., and Nanda, A., “Impact of upper limb joint fluid variation on inflammatory diseases diagnosis,” Journal of Electrical Engineering and Technology, vol. 9, no. 6, pp. 2114-2117, 2014. doi: 10.5370/JEET.2014.9.6.2114
CrossRef - Mohandass, G., Ananda Natarajan, R., and Hari Krishnan, G., “Comparative analysis of optical coherence tomography retinal images using multidimensional and cluster methods,” Biomedical Research (India), vol. 26, no. 2, pp. 273-285, 2015.
- B. Hiebl et al., “In vivo assessment of tissue compatibility and functionality of a polyimide cuff electrode for recording afferent peripheral nerve signals,” Applied Cardiopulmonary Pathophysiology, vol. 14, no. 4, pp. 212-219, 2010.
- F. Garay et al., “Design of a Device for Recording Bioelectric Signals with Surface Electrodes, in the Evaluation of the Effect of Ultraviolet Radiation on a Tissue,” in Communications in Computer and Information Science, 2018, vol. 916, pp. 428-441.
CrossRef - Krishnan, G.H., Natarajan, R.A., and Nanda, A., “Microcontroller based non invasive diagnosis of knee joint diseases,” in Proc. of the 2014 International Conference on Information Communication and Embedded Systems (ICICES 2014), 2015. doi: 10.1109/ICICES.2014.7034178
CrossRef - V. G. Anand, G. H. Krishna, G. Mohandass, R. J. Hemalatha and S. Sundaram, “Predicting grade of prostate cancer using image analysis software,” Trendz in Information Sciences & Computing (TISC2010), Chennai, India, 2010, pp. 122-124, doi: 10.1109/TISC.2010.5714621.
CrossRef - Hemalatha, R.J., Krishnan, G.H., Umashankar, G., and Abraham, S., “Computerized breast cancer detection system,” Biosciences Biotechnology Research Asia, vol. 11, no. 2, pp. 907-910, 2014. doi: 10.13005/bbra/1357
CrossRef - Hari Krishnan, G., Hemalatha, R.J., Umashankar, G., Ahmed, N., and Nayak, S.R., “Development of Magnetic Control System for Electric Wheel Chair Using Tongue,” in Advances in Intelligent Systems and Computing, vol. 308 AISC, no. VOLUME 1, pp. 635-641, 2015. doi: 10.1007/978-81-322-2012-1_68
CrossRef - Sudhakar, T., Hari Krishnan, G., Krishnamoorthy, N.R., Janney J, B., Pradeepa, M., and Raghavi, J.P., “Sleep Disorder Diagnosis using EEG based Deep Learning Techniques,” in Proc. of the 2021 IEEE 7th International Conference on Bio Signals, Images and Instrumentation (ICBSII 2021), 2021. doi: 10.1109/ICBSII51839.2021.9445158
CrossRef - A. Teklemariam et al., “A Finite Element Model simulation of surface EMG signals based on muscle tissue dielectric properties and electrodes configuration,” in 2014 9th International Symposium on Communication Systems, Networks and Digital Signal Processing, CSNDSP 2014, 2014, pp. 193-197.
CrossRef - Abdurrahman A., Price D., Bhansali S.(2007),” Effect of electrode geometry on the impedance evaluation of tissue and cell culture Sensors and Actuators B: Chemical Vol 127 Issue 1 pp 89- 96.
CrossRef - Ayllon D, Seoane F, Gil-Pita R (2009), “Cole equation and parameter estimation from electrical bioimpedance spectroscopy measurements-a comparative study”, In Proceedings of Annual International Conference of the IEEE Engineering in Medicine and Biology Society (EMBC 2009), Minneapolis, pp.3779–3782.
CrossRef - Nagarjuna Reddy, A., Hari Krishnan, G., and Raghuram, D., “Real time patient health monitoring using raspberry PI,” Research Journal of Pharmaceutical, Biological and Chemical Sciences, vol. 7, no. 6, pp. 570-575, 2016.
- Hari Krishnan, G., Umashankar, G., and Abraham, S., “Cerebrovascular disorder diagnosis using MR angiography,” Biomedical Research (India), vol. 27, no. 3, pp. 773-775, 2016.
- Santhosh, S., Juliet, A.V., and Krishnan, G.H., “Predictive analysis of identification and disease condition monitoring using bioimpedance data,” Journal of Ambient Intelligence and Humanized Computing, vol. 12, no. 2, pp. 2955-2963, 2021. doi: 10.1007/s12652-020-02452-7
CrossRef - Ilangovan, N. and Hari Krishnan, G., “Wheel chair movement control using human input: Comparative study approach,” Research Journal of Pharmaceutical, Biological and Chemical Sciences, vol. 6, no. 3, pp. 568-570, 2015.
- Hari Krishnan, G., Abinaya, N., Hemalatha, R.J., and Mohandass, G., “Hardware implementation for feedback control based health monitoring and drug delivery,” Biomedicine (India), vol. 37, no. 1, pp. 123-126, 2017.
- Santhosh, S., Juliet, A.V., and Krishnan, G.H., “Impact of electrodes separation distance on bio-impedance diagnosis,” Biomedical and Pharmacology Journal, vol. 14, no. 1, pp. 141-146, 2021. doi: 10.13005/bpj/2108
CrossRef - Umashankar, G., Hari Krishnan, G., Hemalatha, R.J., Abraham, S., and Divakaran, S., “Assistive system for remote accident patients,” Research Journal of Pharmaceutical, Biological and Chemical Sciences, vol. 5, no. 5, pp. 516-520, 2014.
- Sudhakar, T., Hari Krishnan, G., Santosh, S., Meenakshi, S., and Thomas, L., “Prosthetic arm control using processing device, a comparative approach,” Biomedical Research (India), vol. 29, no. 13, pp. 2904-2907, 2018. doi: 10.4066/biomedicalresearch.29-17-3417
CrossRef - Sudhakar, T., Krishnan, G.H., Umashankar, G., Divakaran, S., Bhurnima, U., and Shanchita, B., “Drug Retrieving System in Hospitals Using Robotics,” Biomedical and Pharmacology Journal, vol. 13, no. 3, pp. 1239-1244, 2020. doi: 10.13005/bpj/1992
CrossRef - Sudhakar, T., Hari Krishnan, G., Prem Kumar, J., Divakaran, S., Janney, B., Mohandass, G., Devanesan, P.S., and Shalini, S., “Inducement of Artificial Sleep using Low Strength Magnetic Waves,” Journal of Physics: Conference Series, vol. 2318, no. 1, 2022. doi: 10.1088/1742-6596/2318/1/012028
CrossRef - Ganesan, U., Paul, N.E.E., Krishnan, G.H., Aarthi, S., and Swamy, I.K., “Detecting Diabetes Mellitus from Tongue Image Hybrid Features and Neural Network Classifier,” in Proc. of the 4th International Conference on Cybernetics, Cognition and Machine Learning Applications (ICCCMLA 2022), 2022, pp. 425-427. doi: 10.1109/ICCCMLA56841.2022.9989053
CrossRef - Abraham, S., Krishnan, G.H., Hemalatha, R.J., Divakaran, S., and Umashankar, G., “Design of voice based pill ejector system,” Biomedical and Pharmacology Journal, vol. 7, no. 1, pp. 231-234, 2014. doi: 10.13005/bpj/478
CrossRef - Radhakrishna Rao, G. and Hari Krishnan, G., “Comparative study of pacemaker energy harvesting techniques,” Research Journal of Pharmaceutical, Biological and Chemical Sciences, vol. 6, no. 1, pp. 1545-1547, 2015.
- Nandhini, P., Hari Krishnan, G., and Umashankar, G., “Home based telemedicine system for respiratory disorder patients,” International Journal of Pharma and Bio Sciences, vol. 6, no. 4, pp. B227-B231, 2015.
- Margreat, L. and Hari Krishnan, G., “Statistical approach for diagnosis of diseases using histopathology data,” International Journal of Pharma and Bio Sciences, vol. 6, no. 2, pp. B199-B203, 2015.
- Sabarivani, A. and Hari Krishnan, G., “Home health assistive system for critical care patients,” Research Journal of Pharmaceutical, Biological and Chemical Sciences, vol. 6, no. 2, pp. 629-633, 2015.
- Umashankar, G., Hari Krishnan, G., Abraham, S., Hemalatha, R.J., Bethanney Janney, J., Krishnakumar, S., Kirubika, T.R., and Rajendran, M., “Proximity sensing system for retinal surgery patients,” Journal of Chemical and Pharmaceutical Sciences, vol. 8, no. 4, pp. 607-610, 2015.
- Umashankar, G., Vimala, J.A., and Hari, K.G., “Elbow Joints for Upper-Limb Prosthesis: Analysis of Biomedical EEG Signals using Discrete Wavelet Transform,” International Journal of Engineering Trends and Technology, vol. 70, no. 7, pp. 190-197, 2022. doi: 10.14445/22315381/IJETT-V70I7P220
CrossRef - David Naranjo Hernández, Javier Reina-Tosina, Mart Min, (2019)” Fundamentals, Recent Advances, and Future Challenges in Bioimpedance Devices for Healthcare Applications”, Journal of Sensors, Volume 2019, Article ID 9210258, 42 pages
CrossRef - Gautam Anand, Andrew Lowe (2020),” Investigating Electrical Impedance Spectroscopy for Estimating Blood Flow-Induced Variations in Human Forearm”, Sensors 2020, 20, 5333.
CrossRef - Gong WeiYan, LV JingHua, Wang Yan, Sha Hong, Zhao Shu, RenChaoShi, (2009).” The impedance property of Electrode used in Electrical Bioimpedance Measurement”, 3rd International Conference on Bioinformatics and Biomedical Engineering, Beijing, China, IEEE Xplore; 11-13.
CrossRef - Hannan W, Cowen S, Plester C, Fearon K, DeBeau A (1995), “Comparison of bieimpedance spectroscopy and multi frequency bioimpedance analysis for the assessment of extracellular and total body water in surgical patients”, Clin. Sci., vol.89, pp.651–658.
CrossRef

