
Manuscript accepted on :24-01-2025
Published online on: 10-02-2025
Plagiarism Check: Yes
Reviewed by: Dr. Nagham Aljamali
Second Review by: Dr. Ahmed Salah
Final Approval by: Dr. Prabhishek Singh
Janmejay Pant1* , Hitesh Kumar Pant2, Vinay Kumar Pant3, Vikas Bhatt4, Devendra Singh1 and Kapil Joshi5
1Department of Computer Science and Engineering, Graphic Era Hill University, Bhimtal Campus, India.
2Department of Management Studies, Kumaun University, Bhimtal, India.
3Department of Computer Science and Engineering, Moradabad Institute of Technology Moradabad, India.
4Faculty of Pharmaceutical Sciences, Amrapali University, Haldwani, India.
5Department of Computer Science and Engineering, Uttaranchal University, Dehradun, India.
Corresponding Author E-mail: geujay2010@gmail.com
Abstract
Parkinson's disease (PD) is a chronic, non-fatal, and well-known progressive neurological disorder, the symptoms of which often overlap with other diseases. Effective treatment of diseases also requires accurate and early diagnosis, a way that patients can lead healthy and productive lives. The main PD signs are resting tremors, muscular rigidity, akinesia, postural instability, and non-motor signs. Clinician-filled dynamics have traditionally been an essential approach to monitoring and evaluating Parkinson's Disease (PD) using checklists. Accurate and timely diagnosis of Parkinson's disease (PD), a chronic and progressive neurological ailment, can be difficult due to its symptoms overlapping with those of other disorders. Effective therapy and improvement in the quality of life for patients depend on early and accurate detection. To improve classification performance, this study investigates transfer learning, which uses pre-trained models to extract features from massive datasets. Transfer learning improves generalization and permits domain adaptation, especially for small or resource-constrained datasets, while lowering training time, resource needs, and overfitting concerns. This work aims to design and assess a general transfer learning paradigm for the reliable prognosis of Parkinson’s disease based on DaTscan images that consider feature extraction and the performance of a variety of ML algorithms. This work aims to explore the use of transfer learning with pre-trained deep learning models to extract features from DaTscan images in order to improve classification accuracy. The sample of this study is made up of 594 DaTscan images from 68 participants, 43 with PD and 26 healthy. Out of the four algorithms employed; the Random Forest, Neural Network, Logistic Regression, and Gradient Boosting models, transfer learning-based features were applied. Four indices of accuracy, namely Area Under the Curve (AUC), Classification Accuracy (CA), F1 Score, Precision, Recall and Matthews Correlation Coefficient (MCC) were used to evaluate four machine learning models on a PD classification task such as Random Forest, Neural Network, Logistic Regression, and Gradient Boosting. Neural networks outperformed the other models, showing robustness and reliability with an AUC of 0.996, CA of 0.973, and MCC of 0.946. Gradient Boosting performed competitively, coming in second with an AUC of 0.995 and MCC of 0.925. Random Forest performed the worst, with an AUC of 0.986 and an MCC of 0.905, whereas Logistic Regression had an AUC of 0.991 and an MCC of 0.926. These results demonstrate how well neural networks perform high-precision tasks and point to gradient boosting as a more computationally effective option.
Keywords
Deep Learning; Feature Extraction; Neurological disorder; Parkinson's disease; Transfer Learning
| Copy the following to cite this article: Pant J, Pant H. K, Pant V. K, Bhatt V, Singh D, Joshi K. Deep Learning-Based Feature Extraction and Machine Learning Models for Parkinson's Disease Prediction Using DaTscan Image. Biomed Pharmacol J 2024;17(December Spl Edition). |
| Copy the following to cite this URL: Pant J, Pant H. K, Pant V. K, Bhatt V, Singh D, Joshi K. Deep Learning-Based Feature Extraction and Machine Learning Models for Parkinson's Disease Prediction Using DaTscan Image. Biomed Pharmacol J 2024;17(December Spl Edition). Available from: https://bit.ly/416gaOc |
Introduction
Parkinson’s disease is a clinical condition characterized by the progressive degeneration of the motor system and is mainly secondary to lowered dopamine production in the brain. Dopamine, acting as a neurotransmitter, sends signals that reach the basal ganglia needed by the brain for effective motor control. Dopamine is reduced when there appears to be dysfunctions or death of dopaminergic neurons from the basal ganglia. The motor symptoms of Parkinsonism include resting tremors, bradykinesia, postural instability, rigidity, akinesia, hypothesia and dyskinesia, and changes in speech and writing 1,2. The diagnosis of Parkinson’s disease presents a problem since there are few biochemical tests, for example, blood tests, that can conclusively point to the disease. Even though PD predominantly affects people over 60 years, it may appear in a person of a younger age and may be diagnosed only when the disease has reached the later stages. Detecting the disease in the early stages is useful because it also allows one to manage the symptoms that arise from it and slows down the disease’s advancement 3. Parkinson’s disease onset may cause finger trembling and interruptions during speech and the normal flow of movement. In most cases, finger tremors result in changes in the handwriting to a small and cramped writing style known as Micrographia. The above micrographia analysis shows that it can be used as an early diagnostic marker for Parkinson’s disease. Early diagnosis of PD is possible if the signs of Micrographia or other abnormalities in handwriting patterns are assessed in addition to observation of the general condition and medical history. Proper diagnosis is crucial in managing and treating Parkinson’s disease, so prompt diagnosis is important. Conventional diagnostic approaches often depend on subjective observations and clinical assessments, which may delay identifying and addressing the condition. Recent advancements in deep learning (DL) and machine learning (ML) have revolutionized the diagnostic process, especially through transfer learning. This method speeds up the training process and improves model performance by utilizing features learned from prior tasks. Recently, it was established that transfer learning works in various domains, including image and speech processing, making it a promising technique for early detection of Parkinson’s disease. For example, convolutional neural networks (CNNs) and transformer-based models have been effectively used to analyze voice recordings and neuroimaging data, achieving high accuracy in differentiating individuals with Parkinson’s disease from healthy controls 4-6. Integrating transfer learning into Parkinson’s disease detection strategies enables the development of more robust models capable of handling the complexities of diverse datasets, including self-reported voice recordings and MRI scans. These models enhance diagnostic precision and support early detection, critical for timely intervention and effective disease management. As advancements in research progress, the transformative potential of transfer learning in Parkinson’s disease diagnosis becomes increasingly apparent, offering innovative approaches to improve patient care and outcomes. Deep learning techniques have recently achieved significant success in classification tasks. Several techniques, such as convolutional neural networks (CNNs), have shown optimum accuracy rates in classification problems. CNNs have been used in image, audio and video classification since they are good at identifying different features of the inputs to provide the right classification. The accessibility and ease of use make convolutional neural networks (CNNs) an ideal choice for classification tasks. Previous studies have shown that deep learning algorithms, particularly CNNs, can outperform traditional machine learning methods, especially when applied to transfer learning. This learning involves using pre-trained CNNs for new applications to fine-tune the model for specific tasks 2,7. Certain deep learning architectures, such as ResNets, EfficientNets, and MobileNets, have attracted much attention in the present world. With deep learning models, medical applications have been analyzed based on medical data such as X-ray pictures and MRI scans, and a helpful diagnostic capacity is provided in the medical field. In the last 10 years, for instance, there has been fast advancement in Artificial intelligence, which has enhanced the use of AI in the healthcare industry and resulted in astonishing improvements in medical diagnosis and treatment of patients. Artificial intelligence is a promising medical tool widely used to diagnose and predict various diseases. Research suggests that deep learning methods often outperform other high-performing algorithms, offering superior accuracy and efficiency in medical applications 8,9. Applying deep learning techniques for detecting Parkinson’s disease from handwriting data is possible as it holds high accuracy, as most deep learning methodologies do. To implement an efficient classification of patients as healthy or Parkinson ‘s-affected patients, deep transfer learning models and machine learning techniques are used in the proposed model. This system uses features from the DaTscan images to improve the detection of these abnormalities. This paper reviews diverse transfer learning-based approaches used in detecting Parkinson’s disease, including their assessment criteria, strengths, and possibilities to affect clinical management. By synthesizing current research and suggesting future directions, we aim to contribute to the ongoing efforts to improve diagnostic techniques for neurodegenerative diseases.
PD is a clinical condition of the motor system that deteriorates due to decreased synthesis of dopamine in the brain. Dopamine, a neurotransmitter, is involved in motor control, and the shortage of dopamine is known to directly cause resting tremor, bradykinesia, postural instability, rigidity, and akinesia. Other symptoms, such as slowness in speaking and writing (e.g., micrographia) and impaired cognition, also make diagnosis and treatment difficult in patients with PD. Diagnosis of PD is difficult as few biochemical tests are available to confirm this disease. Also, the characteristic manifestations are similar to those in other neurodegenerative diseases, which can cause confusion and delay the diagnosis at the initial stages. This is especially important as PD can be diagnosed in its early stages, and the progression of the disease may be minimized apart from enhancing patients’ quality of life. Historically, diagnosis depends on clinical evaluation, and although they can provide useful information, they are relatively inaccurate and less standardized.
New approaches in the field of AI and DL have revitalized emergency diagnostics by applying limited feature learning from a great number of inputs. Specifically, transfer learning can be applied to advance DNNs for healthcare-related tasks, as demonstrated by l. For example, there have been quite many investigations proving how CNNs can be used in identifying neurological conditions, including Alzheimer’s disease, from MRI scans, as well as in identifying lung cancer from CT scans. Similarly, authors have used transfer learning to classify images from SPECT and DaTscan for PD diagnosis, demonstrating tremendous improvements in classification success rates and sensitivity.
For example, Majhi et al.10 obtained an AUC of 100% for PD detection using images of SPECT that provide evidence of the capability of transfer learning-based models handling the neuroimaging data. The CNNs were applied to distinguish the handwriting patterns by Gazda et al. 14, and it was shown that the proposed model could successfully evaluate PD-related micrographia. These studies emphasize the importance of Deep learning methods in improving the difficulties of diagnosing the disorder known as PD. Based on these developments, this work further intends to establish a comprehensive framework for Parkinson’s disease detection through comprehensive transfer learning-based deep learning models and DaTscan images. To this end, the study aims to compare various machine learning classifiers to establish one that yields high diagnostic accuracy and reliability. The findings of this study can help to advance the development of automated diagnostic systems and suggest a route toward improving the detection and treatment of PD at the early stages.
Related Works
In the last few decades, deep learning, machine learning, and AI technologies have led to adoption in various domains. Deep learning approaches have recently been integrated into the various aspects of healthcare. Due to the constant advances and updates encountered with artificial intelligence and deep learning, AI has seen a broader scope in the healthcare industry, specifically, the diagnosis and prediction of diseases. Various studies have used and introduced different datasets to diagnose Parkinson’s disease. Several signs, including olfactory dysfunction, gait, speech, handwriting, and other motor functions, have been studied as markers of PD. Fang12 introduced an enhanced KNN algorithm based on entropy for Parkinson’s disease detection. The UCI dataset was used for this study, and a comparative analysis of existing approaches was performed to assess the efficiency of the improved algorithm. The study results showed that the entropy weighting KNN algorithm was better than ordinary KNN based on accuracy improvement. Kuplan 13 developed a new method for predicting the severity of symptoms of Parkinson’s disease from MRI images. This study aimed to enhance the detection efficiency of Parkinson’s disease with the aid of AI based on clinical information. The research involved three classification tasks, each focusing on the stages and key symptoms of the disease. The symptoms included the extent of the disease stage and the presence or absence of dementia or motor impairments. The model has proven to perform excellently for every classification task considered. Subsequently, more recently, Gazda14 proposed an ensemble of deep neural networks to classify PD from isolated handwritten characters. This literature survey examines key studies utilizing transfer learning techniques across various modalities, including voice signals, neuroimaging, and EEG data, focusing on their methodologies and findings. One study demonstrated the effectiveness of machine learning (ML) and deep learning (DL) techniques in detecting Parkinson’s disease through voice signals. It employed a multiclass ML approach, incorporating feature selection methods like Recursive Feature Elimination, and reported that Support Vector Machines (SVM) achieved an accuracy of 93.84%. These findings highlight the potential of voice features in Parkinson’s diagnosis, emphasizing ML techniques’ significant role in facilitating early diagnosis and intervention strategies for the disease4. Several studies have investigated deep learning models for analyzing neuroimaging data, focusing on SPECT DaTscan images. This approach achieved an outstanding Area Under the Curve (AUC) score of 100% for Parkinson’s disease detection from SPECT images, highlighting the effectiveness of transfer learning in enhancing diagnostic accuracy10. Another study employed a CNN model to analyze 1,390 DaTscan images, achieving a classification accuracy of 94.7%. This approach also utilized soft attention mechanisms to pinpoint regions of interest within the images10. Similarly, in an innovative method, transfer learning was applied to classify resting-state EEG data, offering a novel avenue for Parkinson’s disease monitoring. A modified VGG-16 architecture was employed to map EEG data into deep latent space, enabling effective differentiation between Parkinson’s disease patients and healthy controls. The study highlighted that fine-tuning pre-trained models can achieve accurate classifications by leveraging prior knowledge from large datasets11. Including fully connected layers customized for specific classification tasks further improved model performance. Additionally, some researchers have investigated ensemble methods that integrate multiple deep-learning architectures to enhance Parkinson’s disease detection. These studies suggest that ensemble techniques can boost predictive accuracy10. For instance, an ensemble deep-learning approach was designed to predict patient outcomes by integrating clinical assessments and neuroimaging features extracted from the PPMI database. In another study15, recognizing the importance of rapid disease diagnosis, researchers focused on developing deep convolutional neural networks (CNNs) for automated Parkinson’s disease identification using biomarker-derived voice signals. For instance, an ensemble deep-learning approach was designed to predict patient outcomes by integrating clinical assessments and neuroimaging features extracted from the PPMI database. In another study15, recognizing the importance of rapid disease diagnosis, researchers focused on developing deep convolutional neural networks (CNNs) for automated Parkinson’s disease identification using biomarker-derived voice signals. The proposed CNN methods consisted of two main stages: data preprocessing and the transfer learning method known as fine-tuning. The data sets were obtained from the mPower Voice database to train and evaluate the proposed technique. The researchers proposed transfer learning16 and sparse learning methods to estimate the parameter posterior distributions in the Hierarchical Bayesian framework and facilitate quantifying prediction uncertainty. They proposed an empirical Bayes transfer learning (ebTL) model that would correct for between-patient variability and knowledge transfer between modelling processes for the patients in question. Notably, the ebTL model features automatic hyperparameter estimation, eliminating the need for extensive manual tuning. They further demonstrated its application in predicting Parkinson’s disease severity levels using speech signal features from PD patients. The proposed strategy17 incorporates HT-WVD and transfer learning with an SVM classifier based on ResNet-50. This work proposed novel methods for feature representation of voice and showed that PD could be classified from speech signals. With a 5-fold cross-validation (CV) approach, the model achieved a peak accuracy of 92.13%. Additionally, through a blind test interface, the method shows potential for distinguishing new PD patients from healthy individuals in clinical settings. This research18 explored MRI datasets related to Alzheimer’s disease (AD) and Parkinson’s disease (PD) using neural network transfer architectures for disease classification. ADNI, OASIS, and NTUA datasets common in the literature were used, and seven state-of-the-art transfer learning paradigms were assessed. The results established the feasibility of transfer learning in dementia diagnostics for Alzheimer’s and Parkinson’s classifications. Specifically, it is essential to mention the highest achieving outcomes of the neural network models, InceptionV3 and InceptionResNetV2, for the OASIS and ADNI datasets and the NTUA transfer learning architectures of ResNet50 and EfficientNetB0.The reviewed literature highlights the promising potential of transfer learning in improving the detection and diagnosis of Parkinson’s disease across different modalities. Researchers are creating robust systems that enhance diagnostic accuracy and enable early detection by utilizing pre-trained models and optimizing feature extraction techniques. Future research should explore multimodal approaches and address current challenges to refine these methodologies further.
Materials and Methods
In this section, various materials and methods used in the development of the proposed PD detection model are discussed. The present research would help increase the identification rate of PD disease by implementing an image classification methodology, which will incorporate the deep features extracted based on popular VGG16, VGG19 and Squeeze Net feature extraction methods. Further, the features obtained from these methods are inspected and sorted out through other integral forms of machine learning involving logistic regression, neural networks, and gradient boost and random forest algorithms.
Transfer Learning
It would be observed that transfer learning presents attractive gains in cost and performance by allowing the reuse of pre-trained networks for new objectives. The basic idea can be described as exploiting prior learning and solving a new problem with new information2. It is particularly useful if there is little data to train the general model due to the shortcut required to build a model from fundamental building blocks. Transfer learning enables users to transform the neural networks from one domain to another with an entirely different data set, whereby the dimensions of the output layers can be adjusted as desired. Besides, users can use techniques to tweak hyperparameters, and even the weights of some layers can make the model more flexible. Normally, the early levels of the pre-trained model are not trained or are ‘frozen’ so as not to lose pre-trained features. In contrast, the other levels are trainable to accommodate the other tasks so that they can be learned efficiently and effectively. Transfer learning in machine learning is one of the biggest innovation techniques that involve reusing a formation learned in one application for use in other related applications. This approach seeks to enhance the performance and robustness of the target task by leveraging knowledge from the source dataset, particularly when the target dataset is limited or lacks diversity. This results in transfer learning with low computational costs and time since it retrains new models on new data instead of training a model from scratch. There are three main applications of semi-supervised learning; image classification, natural language processing and medical diagnostics where annotated datasets are difficult or costly to acquire. Transfer learning can also find application in healthcare by improving the ability of pre-trained models to be fine-tuned for specific tasks such as classifying Parkinson’s diseases effectively extracting features and improving the accuracy of the predictive models.
Feature extraction models
Feature extraction is one of the most important steps when building an image classification system. Considering the results presented in Table 10, the classification task’s performance heavily depends on the decision-making based on the most significant features in the images. Convolutional features are extracted from a pre-trained convolutional neural network recently proposed and already in use (VGG16 and VGG19, and SqueezeNet).
VGG 16
VGG1620,25, is an abbreviation for Visual Geometry Group 16 in simple terms, is a deep convolutional neural network (CNN) model, created by the Visual Geometry Group of the University of Oxford in 2014. Originally this network was developed for image classification problems and for some of them it reached one of the best results with the help of ILSVRC dataset. The structure of the network is as follows: the first is a convolutional layer, and the second is a fully connected layer, there are 13 convolutional layers and 3 fully connected layers in total; The input layer takes an image of size for example 224 × 224 × 3. All the 13 convolutional layers are applying 3X3 filters with the stride 1. It must also be mentioned that after the max-pooling layer the number of filters is doubled starting from the first layer with 64 filters and a stride of 2 to increase the brightness of the filter. The employment of max-pooling layers useful in perfecting the decrease of the spatial dimensions of the output pattern by a factor of 2 so as to reduce cases of overfitting due to increased number of parameters. To this end, padding is added to all convolutional layers in a way that the output volume has the same spatial dimensions as the input volume. ReLU is one of the activation functions that introduces nonlinearity to the model once every convolutional layer has been accomplished. For this model, there are two layers with 256 neurons in the first layer and 128 neurons in the second layer with full connection. The last layer consists of 128 neurons, or the output layer corresponding to T1, T2-weighted, and SPECT DaTscan; for the current work, there are two classes. In order to produce the probability distribution of the classes a sigmoid function is used. It is well documented that the VGG16 is really easy to use while at the same time it can provide additional information regarding the image in question. However, training and using computationally can be costly as computationally is a very deep network with a vast parameter. The architecture of VGG16 is shown in Fig: 1.
 |
Figure 1: The architecture of VGG1620 |
VGG 19
VGG1924, developed by Simonyan and Zisserman in 2014, is a convolution neural network with 19 layers, 16 convolution layers and three fully connected, which assists in categorizing the images into 1000 object classes. They argue that VGG19 has been trained on the ImageNet database, which they say has one million images of a thousand classes. This is a very common approach for image classification since many 3 × 3 filters are used in each convolutional layer. The structure of VGG19 is presented in Fig. 2.
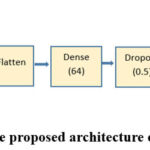 |
Figure 2: The proposed architecture of VGG19 |
A dropout of 0.5 was incorporated into the new FC head. Dropout is a form of regularization that lets weights get the minimum value to make the distribution of weights of the model more regular. An epoch has been defined as a pass through the network, and a dropout of 0.5 means that 50% of the neurons will be randomly omitted from the training process during each epoch pass. It helps remove cases of overfitting for the model meant for the small training set. This work used category cross-entropy as a loss function to solve multi-class classification.
SqueezeNet
Another smaller CNN structure is the SqueezeNet 21,22, which has an equally efficient number of parameters to other much more conventional structures. Several strategies are employed on the CNN basis to design the SqueezeNet: 1) to replace 3 * 3 filters by 1 * 1 filters, 2) to decrease the input channel size for 3 * 3 filters, 3) to down sample relatively late in the network, so that the convolution layers can have big activations. This structure of SqueezeNet includes ten fire layers, which squeeze the layers containing one-dimension filters. They’re then fed into an additional layer with 1×1 and 3×3 convolution layers, as the Fig 3 displays.
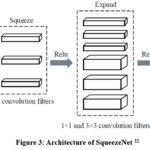 |
Figure 3: Architecture of SqueezeNet22 |
Proposed Methodology
This section will explain the plan for PD identification through image information. This section briefly describes the dataset used before presenting a detailed description of the proposed methodology.
This dataset currently consists of DaTscan from 68 individuals, with 43 suffering from Parkinson’s, while 26 serve as normal control subjects. A total of over 594 images are available. We have limited images, so transfer learning is the best choice. The data on DaTscan images was collected from a secondary source23.
| Imagetype | PD | NPD | Total |
| DaTscan | 330 | 264 | 594 |
The presented methodology lays out a strategy to classify Parkinson’s disease (PD) into different types based on image processing and a transfer learning-based Convolutional Neural Network (CNN) model. Here’s a step-by-step breakdown:
Input Data
The dataset is medical images of Parkinson’s disease. These images are usually scans of DaTscan that can differentiate patients with Parkinson’s disease-PD from patients with no Parkinson’s disease-NPD.
Image Pre-Processing
Image Resizing: Any input image is first scaled to a certain size, 224×224 pixels in this study. This step ensures uniformity in input size, which is necessary for CNN models like pre-trained networks. Pre-processing also involves preparing images for downstream tasks by normalizing pixel values or applying transformations.
Data Augmentation
Data augmentation is applied to improve model generalization and overcome limitations caused by a small dataset. Techniques like rotation, flipping, or brightness adjustments may artificially increase the variety of training data.
Pre-trained Transfer Learning CNN Model
A pre-trained CNN model (e.g., VGG16, VGG19 and SqueezeNet) is employed. These models have been trained on large datasets (e.g., DaTscan) and possess robust feature extraction capabilities. Transfer learning leverages the existing knowledge of the pre-trained model to extract relevant features from the medical images.
Additional Fully Connected Layers
After feature extraction, two new fully connected layers are incorporated for fine-tuning the learned features according to the target classification problem (PD vs NPD). These layers filter the extracted features, giving better results in the prediction.
Classification
The final output layer predicts whether the input image corresponds to a Parkinson’s disease (PD) or a non-Parkinson’s disease (NPD). This step involves a binary classification, where the model outputs the probability of the image belonging to each class. We have used ML models for classification. The methodology discussed is described in Fig4.
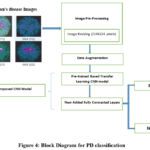 |
Figure 4: Block Diagram for PD classification |
Results
In this part, we shall be showing the results obtained from this study through another set implicating tests aimed at testing the performance of the model that has been advanced herein. The experiment evaluated the ability of the proposed methodology to predict using the DaTscan dataset specifically for PD and how the feature subset contributed to an overall feature score and accuracy percentage. The results are evaluated according to how the algorithm’s effectiveness is measured. Accuracy, Recall, Precision, and AUC measure the performance of the proposed model detection.
Results of SqueezeNet Image Embedding Model
Tables 1 and 2 demonstrate the performance metrics of different machine-learning models after feature extraction using SqueezeNet. It includes two similar tables, each listing evaluation metrics for four models: Logistic Regression, Neural Network, Gradient Boosting, and Random Forest. The table mentions its application to Parkinson’s and non-Parkinson’s class accuracy evaluation.
Table 1: Performance matrices of the models used after feature extraction using SqueezeNet to Parkinson’s class
| Model | AUC | CA | F1 | Prec | Recall | MCC |
| Logistic Regression | 0.992 | 0.963 | 0.967 | 0.952 | 0.982 | 0.926 |
| Neural Network | 0.996 | 0.973 | 0.975 | 0.975 | 0.975 | 0.946 |
| Gradient Boosting | 0.995 | 0.963 | 0.966 | 0.969 | 0.969 | 0.925 |
| Random Forest | 0.985 | 0.953 | 0.957 | 0.963 | 0.951 | 0.905 |
Table 2: Performance matrices of the models used after feature extraction using SqueezeNet to non-Parkinson’s class
| Model | AUC | CA | F1 | Prec | Recall | MCC |
| Logistic Regression | 0.992 | 0.963 | 0.958 | 0.977 | 0.941 | 0.926 |
| Neural Network | 0.996 | 0.973 | 0.97 | 0.97 | 0.97 | 0.946 |
| Gradient Boosting | 0.995 | 0.963 | 0.959 | 0.963 | 0.956 | 0.925 |
| Random Forest | 0.985 | 0.953 | 0.949 | 0.942 | 0.956 | 0.905 |
Table 3. presents the average accuracy metrics of models used for both classes in the classification task, summarizing their performance comprehensively.
Table 3: Average Accuracy of the used model for both classes
| Model | AUC | CA | F1 | Prec | Recall | MCC |
| Logistic Regression | 0.991 | 0.963 | 0.963 | 0.963 | 0.963 | 0.926 |
| Neural Network | 0.996 | 0.973 | 0.973 | 0.973 | 0.973 | 0.946 |
| Gradient Boosting | 0.995 | 0.963 | 0.963 | 0.963 | 0.963 | 0.925 |
| Random Forest | 0.986 | 0.953 | 0.953 | 0.953 | 0.953 | 0.905 |
With the highest scores on every metric—including AUC (0.996), CA (0.973), F1 (0.973), and MCC (0.946)—the Neural Network is the best performer, exhibiting remarkable consistency and dependability. With a slightly higher MCC (0.926) than Gradient Boosting (0.925), Logistic Regression and Gradient Boosting both produce performance that is equal and balanced across CA, F1, Precision, and Recall (0.963). Despite being reliable, Random Forest performed the worst overall, with AUC (0.986), CA (0.953), and MCC (0.905). For this dataset, a neural network is the most reliable option.
Two groups of data are shown by the scatter plot in Fig 5 “No Parkinson” (blue dots) and “Parkinson” (red dots). Each category is represented by a horizontal axis called “category,” and the vertical axis shows the values that correspond to it.
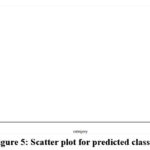 |
Figure 5: Scatter plot for predicted class |
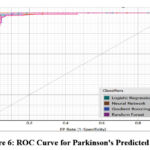 |
Figure 6: ROC Curve for Parkinson’s Predicted Class |
Fig 5 (Scatter Plot) Explains the distribution of predicted classes in the scatter plot and the clear distinction between the Parkinson’s patients and the other patients. Emphasize the fact of clusters, groupings, or overlapping of the data points. Fig 6 (ROC Curve) Compares the general ROC curves of the classifiers about the idea of sensitivity and specificity. Explain why gradient boosting and neural networks were better and what the curves mean to the performance of the models.
Individuals without Parkinson’s disease are represented by the blue dots gathered on the left side of the chart, while those with the disease are represented by the red dots concentrated on the right. Although the vertical axis indicates a range of values for both groups, the two groups are separated, suggesting that the data distribution is different. In Fig 6, four classifiers are compared using the ROC curve: random forest, gradient boosting, neural network, and logistic regression, selected as four categories of machine learning algorithms. The graph of the first quadrant is constructed using the False Positive Rate (1-specificity) on the horizontal axis and the True Positive Rate (sensitivity) on the vertices. Every model performs well; curves around the upper-left corner show a high capacity for discrimination. The gradient boosting and neural network curves are marginally better, indicating higher sensitivity and specificity. Although they exhibit variations from the best-performing models, Random Forest and Logistic Regression perform admirably. With just little variations in their ROC curves, the data demonstrates the effectiveness of every classifier.
Results for VGG-16 image embedding model
Table 4 and 5 demonstrate the performance metrics of different machine-learning models after feature extraction using VGG-16. It includes two similar tables, each listing evaluation metrics for four models: Logistic Regression, Neural Network, Gradient Boosting, and Random Forest. The Fig mentions its application to Parkinson’s and non-Parkinson’s class accuracy evaluation.
Table 4: Performance matrices of the models used after feature extraction using VGG-16 to Parkinson’s class
| Model | AUC | CA | F1 | Prec | Recall | MCC |
| Gradient Boosting | 0.995 | 0.966 | 0.970 | 0.964 | 0.975 | 0.932 |
| Logistic Regression | 0.991 | 0.933 | 0.940 | 0.923 | 0.957 | 0.865 |
| Neural Network | 0.998 | 0.973 | 0.976 | 0.970 | 0.982 | 0.946 |
| Random Forest | 0.984 | 0.926 | 0.933 | 0.927 | 0.939 | 0.851 |
Table 5: Performance matrices of the models used after feature extraction using VGG-16 to non-Parkinson’s class
| Model | AUC | CA | F1 | Prec | Recall | MCC |
| Gradient Boosting | 0.995 | 0.966 | 0.963 | 0.970 | 0.956 | 0.932 |
| Logistic Regression | 0.991 | 0.933 | 0.924 | 0.946 | 0.904 | 0.865 |
| Neural Network | 0.998 | 0.973 | 0.970 | 0.977 | 0.963 | 0.946 |
| Random Forest | 0.984 | 0.926 | 0.918 | 0.925 | 0.911 | 0.851 |
Table 6 presents the average accuracy metrics of models used for both classes in the classification task, summarizing their performance comprehensively.
Table 6: Average Accuracy of the used model for both classes
| Model | AUC | CA | F1 | Prec | Recall | MCC |
| Gradient Boosting | 0.995 | 0.966 | 0.966 | 0.966 | 0.966 | 0.932 |
| Logistic Regression | 0.990 | 0.933 | 0.933 | 0.933 | 0.933 | 0.865 |
| Neural Network | 0.997 | 0.973 | 0.973 | 0.973 | 0.973 | 0.946 |
| Random Forest | 0.984 | 0.926 | 0.926 | 0.926 | 0.926 | 0.851 |
Using parameters like AUC, CA, F1, Precision, Recall, and MCC, the table assesses four machine learning models: Random Forest, Neural Network, Logistic Regression, and Gradient Boosting. With the highest AUC (0.997), CA (0.973), F1 (0.973), and MCC (0.946), the Neural Network performs better than the others. Gradient Boosting comes in second with balanced metrics, showing good reliability with an MCC of 0.932 and an AUC of 0.995. Both Random Forest and Logistic Regression perform similarly but less well; Random Forest trails slightly behind with an AUC of 0.984 and MCC of 0.851, while Logistic Regression scores an AUC of 0.990 and MCC of 0.865. For this dataset, the neural network model is the most reliable overall.
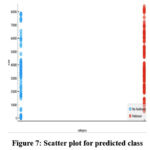 |
Figure 7: Scatter plot for predicted class |
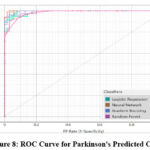 |
Figure 8: ROC Curve for Parkinson’s Predicted Class |
In Fig 7 and Fig 8, the scatter plot and ROC curve are shown, respectively. The ROC curve demonstrates the performance of four classifiers, including Logistic Regression, Neural Network, Gradient Boosting and Random Forest for Parkinson’s disease prediction after feature extraction using VGG-16.
Results for VGG-19 image embedding model
Table 7 and 8 demonstrate the performance metrics of different machine-learning models after feature extraction using VGG-19. It includes two similar tables, each listing evaluation metrics for four models: Logistic Regression, Neural Network, Gradient Boosting, and Random Forest. The Fig mentions its application to Parkinson’s and non-Parkinson’s class accuracy evaluation.
Table 7: Performance matrices of the models used after feature extraction using VGG-19 to Parkinson’s class
| Model | AUC | CA | F1 | Prec | Recall | MCC |
| Gradient Boosting | 0.960 | 0.883 | 0.897 | 0.860 | 0.939 | 0.765 |
| Logistic Regression | 0.956 | 0.883 | 0.896 | 0.868 | 0.926 | 0.763 |
| Neural Network | 0.965 | 0.876 | 0.890 | 0.862 | 0.920 | 0.750 |
| Random Forest | 0.934 | 0.852 | 0.872 | 0.829 | 0.920 | 0.704 |
Table 8: Performance matrices of the models used after feature extraction using VGG-19 to non- Parkinson’s class
| Model | AUC | CA | F1 | Prec | Recall | MCC |
| Gradient Boosting | 0.960 | 0.883 | 0.863 | 0.917 | 0.815 | 0.765 |
| Logistic Regression | 0.956 | 0.883 | 0.865 | 0.903 | 0.830 | 0.763 |
| Neural Network | 0.965 | 0.876 | 0.857 | 0.895 | 0.822 | 0.750 |
| Random Forest | 0.934 | 0.852 | 0.825 | 0.889 | 0.770 | 0.704 |
Table 9 presents the average accuracy metrics of models used for both classes in the classification task, summarizing their performance comprehensively.
Table 9: Average Accuracy of the used model for both classes
| Model | AUC | CA | F1 | Prec | Recall | MCC |
| Gradient Boosting | 0.960 | 0.883 | 0.882 | 0.885 | 0.883 | 0.765 |
| Logistic Regression | 0.956 | 0.883 | 0.882 | 0.884 | 0.883 | 0.763 |
| Neural Network | 0.964 | 0.876 | 0.875 | 0.877 | 0.876 | 0.750 |
| Random Forest | 0.932 | 0.852 | 0.851 | 0.856 | 0.852 | 0.704 |
Four machine learning models are compared in the table based on six metrics: AUC, CA (Classification Accuracy), F1, Precision, Recall, and MCC. The models are Gradient Boosting, Logistic Regression, Neural Network, and Random Forest. In contrast to Gradient Boosting, which scored 0.960 in AUC and performed quite well in F1 (0.882) and Precision (0.885), Neural Network obtained the highest AUC (0.964) but significantly lower CA and F1. With an AUC of 0.932 and an MCC of 0.704, Random Forest fared the worst across all metrics, while Logistic Regression closely trails Gradient Boosting. Overall, Neural Network performs exceptionally well in AUC but somewhat poorly in other metrics, whereas Gradient Boosting and Logistic Regression exhibit high performance.
In Fig 9 and Fig 10, the scatter plot and ROC curve are shown, respectively. The ROC curve demonstrates the performance of four classifiers, including Logistic Regression, Neural Network, Gradient Boosting and Random Forest for Parkinson’s disease prediction after feature extraction using VGG-19.
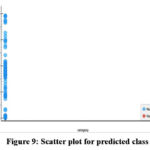 |
Figure 9: Scatter plot for predicted class |
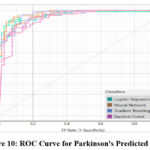 |
Figure 10: ROC Curve for Parkinson’s Predicted Class |
Discussion
Table 10 compares the performance of various classifiers (Gradient Boosting, Logistic Regression, Neural Network, and Random Forest) across three feature extraction models: SqueezeNet, VGG-16, and VGG-19. The analysis is based on six performance metrics: AUC, CA, F1, Precision, Recall, and MCC. A detailed comparison of all three feature extraction models is explained in the paragraph below.
SqueezeNet
The best-performing feature extraction model across all classifiers. Neural Network achieves the highest AUC (0.996), CA (0.973), F1 (0.973), and MCC (0.946), making it the most effective classifier for features extracted by SqueezeNet. Gradient Boosting performs similarly but slightly behind Neural Networks, with a CA of 0.963 and MCC of 0.926. Random Forest, with the lowest AUC (0.986) and MCC (0.905).
VGG-16
Slightly better than SqueezeNet for Gradient Boosting, achieving the highest CA (0.966), F1 (0.966), and MCC (0.932) among all combinations. Again, Neural Network leads in most metrics, with an AUC of 0.997 and CA of 0.973. Random Forest, with the lowest AUC (0.984) and MCC (0.851).
VGG-19 is the weakest feature extraction model overall, as metrics drop significantly across all classifiers. Neural Network has high accuracy, but its performance is reduced compared to SqueezeNet and VGG-16, with AUC (0.964), CA (0.876), and MCC (0.746). Gradient Boosting and Logistic Regression perform slightly better than Random Forest but still deliver lower metrics than the other feature extraction models.
Table 10: Comparison of different models in terms of performance
| Feature Extraction Models | Classifiers | AUC | CA | F1 | Prec | Recall | MCC |
|
SqueezeNet |
Gradient Boosting | 0.995 | 0.963 | 0.963 | 0.963 | 0.963 | 0.926 |
| Logistic Regression | 0.991 | 0.973 | 0.973 | 0.973 | 0.973 | 0.946 | |
| Neural Network | 0.996 | 0.963 | 0.963 | 0.963 | 0.963 | 0.925 | |
| Random Forest | 0.986 | 0.953 | 0.953 | 0.953 | 0.953 | 0.905 | |
| VGG-16 | Gradient Boosting | 0.995 | 0.966 | 0.966 | 0.966 | 0.966 | 0.932 |
| Logistic Regression | 0.990 | 0.933 | 0.933 | 0.933 | 0.933 | 0.865 | |
| Neural Network | 0.997 | 0.973 | 0.973 | 0.973 | 0.973 | 0.946 | |
| Random Forest | 0.984 | 0.926 | 0.926 | 0.926 | 0.926 | 0.851 | |
|
VGG-19 |
Gradient Boosting | 0.960 | 0.883 | 0.882 | 0.885 | 0.883 | 0.765 |
| Logistic Regression | 0.956 | 0.883 | 0.882 | 0.884 | 0.883 | 0.763 | |
| Neural Network | 0.964 | 0.876 | 0.875 | 0.877 | 0.876 | 0.750 | |
| Random Forest | 0.932 | 0.852 | 0.851 | 0.856 | 0.852 | 0.704 |
In the results of this study, deep learning-based feature extraction is shown to work well with machine learning classifiers for Parkinson’s disease (PD) prediction. Among all the evaluated feature extraction models, which included SqueezeNet, VGG-16, and VGG-19, SqueezeNet coupled with Neural Networks and VGG-16 coupled with Neural Network were shown to have a higher AUC, CA, F1-score, and MCC than models from other combinations. This study proves that Neural Networks outperform other classifiers, emphasizing its potential for capturing rich features in DaTscan images to classify PD.
Key Findings and Implications
Performance Analysis
SqueezeNet and VGG-16
These models demonstrated higher robustness and precision, with Neural Networks achieving the highest AUC (0.996) and CA (97.3%) using SqueezeNet features. Gradient Boosting also showed competitive performance, making it a viable alternative for scenarios requiring simpler implementations.
VGG-19
Although VGG-19 performed well, its metrics were slightly lower than SqueezeNet and VGG-16. This suggests that deeper architectures like VGG-19 may not always provide significant benefits for PD classification, possibly due to overfitting or the small dataset size.
Classifiers
Neural Networks had the best accuracy score through all the feature extraction models compared to Random Forest, Logistic Regression, and Gradient Boosting. This goes a long way in establishing the appropriateness of Neural Networks in high-dimension medical image analysis.
Clinical Implications:
The suggested method allows early and accurate diagnosis of PD, which is especially important to intervene and manage the symptoms.
The aspect of transfer learning makes this methodology feasible even in areas where it is hard to gather large amounts of data.
Such results are important for creating automatic diagnostic instruments that can diminish the usage of clinical estimations and increase the accuracy of diagnostics.
Limitations
The data set employed in this work is rather limited, comprising 594 images. While transfer learning helps avoid this problem, it is still important to work with larger datasets to obtain more general and robust models. DaTscan images comprise the majority of data samples, leading to the problem of multimodal data analysis, which includes voice recordings, handwriting, or other clinical indicators.
Future Research Directions
For future work, the focus must be on collecting more significant and diverse datasets and expanding the model by including other modalities, such as MRI scans data or EEG data or voice records data. Perhaps using data from different sources, i.e. clinical history, other motor scale scores and imaging could be used to form a more holistic diagnostic approach in future.
Conclusion
This paper aims to present a novel framework for accurately detecting Parkinson’s disease using DatScan images obtained from secondary sources. The proposed framework utilizes transfer learning models to minimize training time, including squeeze Net, VGG16, and VGG-19. The performance of the proposed model is evaluated and analyzed through various assessments. it demonstrates the importance of both extraction models and classifier choice. We have used four classifiers for all three deep learning feature extraction models, Logistic Regression, Neural network, Gradient Boosting and Random Forest, to classify and predict Parkinson’s disease. Our study shows that SqueezeNet and VGG-16 combined with a Neural Network offer the best performance for this classification task. For slightly simpler implementations, Gradient Boosting with VGG-16 offers competitive results. The combination of Random Forest and VGG-19 is the least effective. The loss is minimal, and the model demonstrates high precision and strong performance metrics. Experimental results and comparative performance analysis confirm the superior accuracy of the proposed model in detecting Parkinson’s disease.
Acknowledgement
The author would like to thank Graphic Era Hill University for providing the necessary resources, facilities, and a conducive environment for completing the research work.
Funding Sources
The author(s) received no financial support for the research, authorship, and/or publication of this article.
Conflict of Interest
The authors do not have any conflict of interest
Data Availability
This statement does not apply to this article.
Ethics Statement
This research did not involve human participants, animal subjects, or any material that requires ethical approval.
Informed Consent Statement
This study did not involve human participants, and therefore, informed consent was not required.
Clinical Trial Registration
This research does not involve any clinical trials
Author Contributions
Janmejay Pant: Conceived and designed the research study, developed the methodology, Writing the original Draft
Hitesh Kumar Pant: Data Collection, conducted data preprocessing, assisted with visualization
Vinay Kumar Pant: Data Preprocessing, Results interpretation
Vikas Bhatt: Data Analysis, Domain Expert
Devendra Singh: Worked on deep learning and machine learning models and assisted in fine-tuning the algorithms.
Kapil Joshi: Contributed to the interpretation of the results, ensured the technical rigor of the analysis
References
- Bloem BR, Okun MS, Klein C. Parkinson’s disease. Lancet. 2021;397(10291):2284-2303.
CrossRef - Abdullah SM, Abbas T, Bashir MH. Deep transfer learning based Parkinson’s disease detection using optimized feature selection. IEEE Access. 2023;11:3511-3524.
CrossRef - Li H, Pun C-M, Xu F, Pan L, Zong R, Gao H . A hybrid feature selection algorithm based on a discrete artificial bee colony for Parkinson’s diagnosis. ACM Trans Internet Technol. 2021;21(3):1–22.
CrossRef - Srinivasan S, Ramadass P, Mathivanan SK, Panneer Selvam K, Shivahare BD, Shah MA. Detection of Parkinson disease using multiclass machine learning approach. Sci Rep. 2024;14(1):1–17.
CrossRef - Tougui I, Zakroum M, Karrakchou O, Ghogho M. Transformer-based transfer learning on self-reported voice recordings for Parkinson’s disease diagnosis. Sci Rep. 2024;14(1):1–21
CrossRef - Li H, Yang Z, Qi W, Yu X, Wu J, Li H. Parkinson’s image detection and classification based on deep learning. BMC Med Imaging. 2024;24(1).
CrossRef - Kim M, Yun J, Cho Y, Shin K, Jang R, Bae H-J. Deep learning in medical imaging. Neurospine. 2019;16(4):657–68.
CrossRef - Bakator M, Radosav D. Deep learning and medical diagnosis: A review of literature. Multimodal Technol Interact. 2018;2(3):47.
CrossRef - Wong PC, Abdullah SS, Razak MIBS. Current trends in deep learning techniques for Alzheimer’s disease diagnosis using medical images: A systematic literature review. Heliyon. Published online 2024.
CrossRef - Majhi B, Kashyap A, Mohanty SS. An improved method for diagnosis of Parkinson’s disease using deep learning models enhanced with metaheuristic algorithm. BMC Med Imaging. 2024;24(1):156.
CrossRef - Arasteh E, Mahdizadeh A, Mirian M, Lee S, McKeown M. Deep transfer learning for Parkinson’s disease monitoring by image-based representation of resting-state EEG using directional connectivity. Algorithms. 2021;15(1):5.s
CrossRef - Fang Z. Improved KNN algorithm with information entropy for the diagnosis of Parkinson’s disease. In: 2022 International Conference on Machine Learning and Knowledge Engineering (MLKE). IEEE; 2022.
CrossRef - Kaplan E, Altunisik E, Ekmekyapar Firat Y. Novel nested patch-based feature extraction model for automated Parkinson’s Disease symptom classification using MRI images. Comput Methods Programs Biomed. 2022;224(107030):107030.
CrossRef - Gazda M, Hires M, Drotar P. Multiple-fine-tuned convolutional neural networks for Parkinson’s disease diagnosis from offline handwriting. IEEE Trans Syst Man Cybern Syst. 2022;52(1):78-89.
CrossRef - Karaman O, Çakın H, Alhudhaif A, Polat K. Robust automated Parkinson disease detection based on voice signals with transfer learning. Expert Syst Appl. 2021;178(115013):115013.
CrossRef - Zou N, Huang X. Empirical Bayes transfer learning for uncertainty characterization in predicting Parkinson’s disease severity. IISE Trans Healthc Syst Eng. 2018;8(3):209-219
CrossRef - Macharla A, Pradeepini G. A novel framework for the diagnosis of Parkinson’s disease using transfer learning with RESNET50 and SVM classifier. Indones J Electr Eng Comput Sci. 2023;32(2):877.
CrossRef - Thakur M, Kuresan H, Dhanalakshmi S, Lai KW, Wu X. Soft attention based DenseNet model for Parkinson’s disease classification using SPECT images. Front Aging Neurosci. 2022;14:908143
CrossRef - Mallik S, Majhi B, Kashyap A. An improved method for diagnosis of Parkinson’s disease using deep learning models enhanced with metaheuristic algorithm. Res Sq. Published online 2023.
CrossRef - Simonyan K, Zisserman A. Very deep convolutional networks for large-scale image recognition. arXiv [csCV]. Published online 2014.
- Forrest NI, Song H, Matthew WM, Khalid A, William JD, Kurt K. SqueezeNet: AlexNet-level accuracy with 50x fewer parameters and <0.5MB model size. [Internet]. arXiv [cs.CV] 2016.
- Lee HJ, Ullah I, Wan W, Gao Y, Fang Z. Real-time vehicle make and model recognition with the residual SqueezeNet architecture. Sensors (Basel). 2019;19(5):982.
CrossRef - https://www.kaggle.com/datasets/shayalvaghasiya/ntua-prakinson.
CrossRef - Bansal M, Kumar M, Sachdeva M, Mittal A. Transfer learning for image classification using VGG19: Caltech-101 image data set. J Ambient Intell Humaniz Comput. 2023;14(4):3609-3620.
CrossRef - Tran C, Shen K, Liu K. Deep learning predicts prevalent and incident Parkinson’s disease from UK Biobank fundus imaging. Sci Rep. 2024;14(1):3637
CrossRef

