
Manuscript accepted on :03-11-2025
Published online on: 06-02-2026
Plagiarism Check: Yes
Reviewed by: Dr. Ramdas Bhat
Second Review by: Dr. Ummarah Kanwal
Final Approval by: Dr. Patorn Piromchai
Khagga Bhavya Sri1* , Thandra Ambika1and Dhilli Rao Gorja2
1Department of Pharmaceutical Analysis, RBVRR women’s college of pharmacy, Barkatpura, Hyderabad, India.
2Department of Chemistry, Texila American University, Georgetown, Guyana.
Corresponding Author E-mail: dhilli.rao@tau.edu.gy
Abstract
Develop a simple, rapid, precise method and validate the method according to the ICH (Q2R1) and M10 guidelines. Using the 1-Naphthol reagent, which produces a coloured complex, a straightforward and sensitive spectrophotometric technique has been devised and validated for quantifying dabigatran etexilate mesylate (DAB) in both bulk and pharmaceutical dosage forms.DAB reacts with 1-naphthol in the presence of sodium nitrite and HCl with ammonium sulphamate, to form a green-colored complex which is a diazotization and azo coupling method. A sensitive UV-visible spectroscopy method determination of dabigatran in human plasma was developed and validated. 1ml aliquot was developed by protein precipitation with acetonitrile and validated. Beer’s law is obeyed in the concentration range of 8-62 µg/mL for dabigatranwith 1-Naphthol respectively with a correlation coefficient of 0.999. The limits of detection and quantification were 0.120µg/mL and 0.366 µg/mL for dabigatran. The recovery of accuracy was found to be 100.26%. Drug was quantified and was found to be 100.62%. The estimated calibration range of the method with plasma was 5–100 µg/ml. stability studies are performed and results are within limits. The recovery studies of accuracy and precision were studied.The superiority of this spectrophotometric technique has been demonstrated due to its low solvent concentration, lack of extraction stages, specificity, and sensitivity. A UV-visible technique that is sensitive, easy to use, and affordable was created and verified for the measurement of DAB in human plasma and pharmaceutical dosage form.
Keywords
Dabigatran Etexilate Mesylate (DAB); 1-Naphthol; Plasma; Stability studies; UV-visible spectrophotometer
| Copy the following to cite this article: Sri K. B, Ambika T, Gorja D. R. Quantification of Dabigatran in Spiked Plasma, Bulk and Formulation Using 1 – Naphthol as Per ICH Guidelines by UV Visible Spectrophotometer. Biomed Pharmacol J 2026;19(1). |
| Copy the following to cite this URL: Sri K. B, Ambika T, Gorja D. R. Quantification of Dabigatran in Spiked Plasma, Bulk and Formulation Using 1 – Naphthol as Per ICH Guidelines by UV Visible Spectrophotometer. Biomed Pharmacol J 2026;19(1). Available from: https://bit.ly/4qerP6J |
Introduction
Chemically, dabigatran etexilate mesylate (DAB) is trimethylomethyl 3-(1-{2-[({4-[amino({[(hexyloxy)carbonyl]imino}) methyl]phenyl}amino)methyl]One methyl-1H-1,3-benzodiazol-5-yl}-N-(pyridin-2-yl)formamido)propanoate. A blood clotprevention and treatment medication is dabigatran etexilate mesylate. To stop the thrombin-mediated activation of coagulation factors, dabigatran binds reversibly to the active site on the thrombin molecule. When fibrin is attached, it can even render thrombin inactive, which could potentially increase fibrinolysis and lessen thrombin-mediated inhibition of it. Put differently, it disrupts the clotting mechanism, hence decreasing the formation of blood clots.
It is a prodrug that hydrolyzes in the liver and plasma under the action of esterase to become its active form. DAB inhibits thrombin directly and reversibly in a competitive manner.1
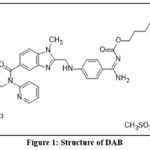 |
Figure 1: Structure of DAB |
The term “chromogen” describes colorless (or weakly colored) chemical substances that can undergo a chemical reaction to transform into “colored” chemicals known as chromophores. Chromogenic assays produce a colored reaction product that absorbs light in the visible range. Chromophore refers to the part of a molecule that is responsible for its color. Chromophores are usually composed of a series of conjugated double bonds that absorb certain wavelengths of light, resulting in the color that we see2
Based on an extensive literature review, various methods have been reported for the quantification of dabigatran, including spectrophotometric, spectrofluorimetric, and numerous reverse-phase high-performance liquid chromatography techniques. Spectrophotometric methods developed so far utilize solvents such as hydrochloric acid, methanol, and acetonitrile. However, to the best of our knowledge, there is no reported spectrophotometric method that employs 1-naphthol. Compared to chromatographic techniques, spectrophotometric methods offer significant advantages: they are simpler, faster, require minimal sample preparation, and are cost-effective. Moreover, spectrophotometric methods are more responsive and selective due to their reliance on specific chemical reactions between the analyte and a reagent, resulting in the formation of a colored chromogen.
A thorough review of the literature found that few analytical techniques are available for determining DAB using UV spectroscopy.3-11
Mechanism of reaction
When an amine group in DAB reacts with Sodium Nitrite in the presence of Hydrochloric acid, it undergoes diazotization to form a diazonium salt. This reaction occurs under acidic conditions and is typically performed at low temperatures to ensure the stability of the diazonium salt.
When 1-Naphthol is added to the reaction, it reacts with the diazonium salt in an azo coupling reaction. This results in the formation of an azo compound, which is a brightly colored compound containing an -N=N- functional group.
When amine reacts with sodium nitrite in the presence of HCl, it produces diazonium salt and ammonium sulphamate reacts with excess nitrous acid to neutralize. Further, this Diazonium salt reacts with 1-naphthol which produces azo dyes (green colored chromogen).
Unstable Salt of diazonium
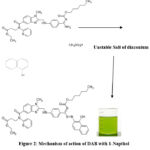 |
Figure 2: Mechanism of action of DAB with 1-Napthol |
Materials and Methods
Chemicals and Materials
DAB (API) was gifted a sample by laural pharma and commercial hard gelatin capsule dosage form Dabigat-75mg was acquired from local pharmacies.All chemicals and reagents used were of analytical grade and were freshly prepared in distilled water.Preparation of 2M HCl:Pipette 4ml of concentrated HCl (37%) into a 25ml volumetric flask, then add distilled water to fill the container up to the brim.Preparation of Sodium Nitrite (0.025%):preparation involved weighing 0.025g of sodium nitrite and transferring it to a 100 volumetric flask and made up to 100ml with distilled water after being dissolved in a little amount of it (around 10 mL).Preparation of Ammonium Sulphamate (0.5%): preparation involved weighing and dissolving 0.5g of ammonium sulphamate in a small amount of distilled water. Use distilled water to further make up to 100ml.Preparation of 1-Napthol (0.250%):250 mg of the reagent was weighed, diluted in a small amount of ethanol, and then added to a 100 ml volumetric flask.
Instrumentation: Double–beam ELICO SL 210 UV–Visible Spectrophotometer, Weighing balance, Sonicator.
Preparation of standard solution
Standard solution preparation involved weighing 10 mg of pure DAB medication and transferring it to a 10 ml volumetric flask. Dissolved in 10 ml of volumetric flask containing ethanol until 3/4 of the mark was reached, then sonicated. The final mixture was adjusted to yield 1000µg/ml of reference stock solution. 1 ml of the standard stock solution was pipetted into a 10ml volumetric flask, and 100µg/ml of the working standard was obtained by adding ethanol to the mark.
Experimental methodology
We performed four trials on DAB with 1-naphthol and other reagents. The optimized method trial was performed with 16µg/ml. Pipetted 1.6ml of working standard solution into 10ml volumetric flaskbefore adding 2M HCl (1ml) and 0.025% sodium nitrite (1ml)and left for 3mins. Then 0.5%ammonium sulphamate(1ml) was added and leftfor 2mins. After that, 0.25% 1-naphthol (1 ml) was added anda 10 ml volumetric flask was filled to the appropriate level with ethanol. The resultant solution was scanned in the 400–800 nm range using UV–visible spectroscopy. It has been found that the optimal wavelength, which corresponds to room-temperature green chromogen, was 449 nm. The optimised wavelength is shown in fig:3.
Validation parameters: The written proof that guarantees a desired outcome with predefined compliance is the validation procedure. 12-26
Linearity
Preparation of 8 – 62 µg /ml serial dilution
A series of 10ml volumetric flasks were filled with aliquots of the standard drug solution of DAB in the following sizes: 0.8, 1.6, 2.4, 3.2, 4.0, 4.8, 5.6, and 6.2 ml. We added 1 ml of 2MHCl, 1 ml of 0.5% ammonium sulphamate, 1 ml of 0.02% sodium nitrite, and 1 ml of 0.25% 1-naphthol. Ethanol makes up the difference in the solution. The equivalent reagent blank was used to compare the green chromogen of dab absorbance at 449 nm. The calibration curve’s linearity (absorbance vs. concentration) for dab was examined in pure solution using concentration ranges of 8, 16, 24, 32, 40, 48, 56, and 62 µg/ml. Table 1 and 2 provides a summary of the analytical results from the calibration curves in fig 4, including standard deviations for the slope, intercept, and system suitability parameters. This data illustrates the calibration graphs’ linearity.
Limit of Detection and Limit of Quantification
These were independently calculated using the 3.3 σ/s and 10 σ/s formulas, respectively, based on a standard calibration curve, where s represents the calibration curve’s slope and σ denotes the regression equation’s y-intercept standard deviation. It was discovered that the LOD and LOQ were 0.1208µg/ml and 0.366µg/ml summarized in table 3.
Accuracy
Recovery of DAB was calculated to assess the method’s accuracy. The DAB results’ satisfactory recovery percentages show how accurate the procedure is. Table 4 summarises the recovery studies of accuracy.
Precision
The absorbance of six replicates of standard dabigatran solutions at a wavelength of 449 nm was measured using a standard solution of 32 µg/ml. The precise values are shown in table5 along with the proportion for the standard deviation relative (RSD) that was determined.
Robustness
Absorbance at a fixed wavelength of ±1 nm is used to measure robustness. At 448, 449, and 450 nm, the absorbance of the 32 µg/ml standard dabigatran solution has been recorded at least six times. %RSD was calculated, and robustness data was noted in Table6.
Ruggedness
The reproducibility of test results is assessed by analysing the same samples in various settings with different analysts is known as ruggedness. Several analysts measured the absorbance of the standard dabigatran solution at 449 nm to arrive at this conclusion. The percentage RSD was computed and table 7 summarises ruggedness data.
Assay
The proposed approach was used using DAB capsules that are sold commercially (Dabigat 75mg). After being weighed, ten capsules were finely ground into a powder.
In a 100 ml volumetric flask, 10 mg of DAB equivalent was weighed and dissolved with a few ml of ethanol. After 15 minutes of sonication, add ethanol to make up the difference. The solution obtained was determined to be 100µg/ml.
1.6 ml of the sample working solution was pipetted out, and the normal operating procedure was adhered to.The green chromogen’s absorbance was measured at a chosen wavelength in comparison to the matching reagent blank. The drug content was then examined, and the findings were computed.
Extraction of plasma with protein precipitation:
One method for concentrating and purifying proteins from different impurities is protein precipitation. By introducing a reagent, the procedure modifies the solvent’s solvation potential, reducing the solute’s solubility. The protein molecules consequently clump together and dissociate from the solvent.
1ml of plasma was pipetted out into a test tube and 1 ml of 10ppm drug was added to the above plasma sample. Then 2 ml of acetone was transferred to the test tube. The solution was vortexed for 1min. After vortexed the contents were transferred into a centrifugation tube at 14,000rpm for 10 minutes. The supernatant layer was collected into a 10-ml vol flask. The reagents and chemicals were added as 1ml HCl, 1ml sodium nitrite, 1ml ammonium sulphamate, and 1ml 1-naphthol and the remaining vol was made with water. The resultant solution was scanned in the 200–800 nm range using UV–visible spectroscopy against blank water. It has been found that the optimal wavelength, which corresponds to room temperature was 449 nm.27-39
Validation Parameters
Selectivity
The ability of a method of analysis to identify and measure an analyte while additional chemicals are present of any material that disrupts the biological matrix is known as selectivity.40
Specificity:
Specificity is the capacity of a bioanalytical method to differentiate and identify the manufactured from different materials, including its related compounds. Chemically similar substances, metabolites, isomers, contaminants, breakdown products produced during sample preparation, or concurrent drugs that are expected to be utilized in the treatment of patients with the intended indication are a few examples of specificity.
The effects of relevant chemicals should be assessed in the Predose research samples or during process validation if their presence in the biological matrix of interest is expected.
Matrix effect
A change in the analyte reaction caused by intervening and sometimes undetectable components in the sample matrix is known as a matrix effect. To evaluate the matrix effect, at least 3 copies of low and high QCs, each created using a matrix from at least 6 different sources or lots, should be examined.
Preparation of Low QC (5ppm) andHigh QC (40ppm)
0.5 ml of plasma was pipetted to the 0.5 ml and 4.0 ml of standard drug solution that had been pipetted into a 10 ml volumetric flask. 1 ml of 2M HCL and 1 ml of sodium nitrite (0.025%) were added to a 10ml volumetric flask containing the supernatant layer. 1ml of ammonium sulfamate (0.5%) was added after two minutes, and three minutes later, 1ml of 1-naphthol was added. Water was added to make up the difference in the remaining solution. Using UV-visible spectroscopy, the resulting solution of green-colored chromogen was scanned against blank water at 449nm. Results are illustrated in table 11.
Linearity:
The calibration curve illustrates the relationship between an analyte’s real concentration and the testing platform’s reaction to it.
Procedure for establishing of calibration curve
A series of 10 ml volumetric flasks were filled with aliquots of the standard drug solution of DAB in the following sizes: 0.5, 1.0, 1.5, 2.0, 2.5, 3.0, 3.5, 4.0, and 4.5 ml. Each 10ml vol flask received a spike of 0.5ml plasma. They added 1 ml of 2MHCl, 1 ml of 0.5% ammonium sulfamate, 1 ml of 0.02% sodium nitrite, and 1 ml of 0.25% 1-naphthol. Ethanol makes up the difference in the solution. The equivalent reagent blank was used to compare the green chromogen of dab absorbance at 449 nm. The calibration curve’s linearity (absorbance vs. concentration) for dab was examined in pure solution using concentration ranges of 5, 10, 15, 20, 25, 30, 35, 40, and 45 µg/ml in table 8 and fig.5. The mean ± standard deviation for the slope, intercept, and correlation coefficient was determined for each of the six standard curves.
Accuracy and Precision
Accuracy and precision should be assessed using identical runs and data. Not include the LLOQ, when at each concentration level, accuracy should fall within ±15% and the nominal concentration within ±20%. A concentration’s accuracy (%CV) at any given level cannot go above 15%. except for the LLOQ, when it should not be greater than 20%. Three-thirds of all QCs and at least 50% of each concentration level must fall within ±15% of the nominal values for both precision and non-accuracy validation runs. Results are summarized in table9 and 10.
Stability studies
Stability studies must be conducted to make sure that choices regarding sample preparation, production, analysis, and storage conditions do not affect the analyte concentration. The material’s endurance in the matrix is evaluated using QCs at both low and high concentrations.
Freeze-thaw, benchtop, and long-term stability studies are studied and results are summarized in table 12.
Preparation of low QC (5µg/ml) and High QC (40µg/ml) sample
A 10 ml vol flask that had been previously spiked with plasma was filled with 0.5 ml and 4.0 ml of the standard drug sol (100µg/ml). The remaining volume was filled with water to reach the mark. For a longer period, the three low-concentration replicas were created and kept in a freezer at -20°C. A UV scan of the solution at 449 nm was performed after a specific amount of time to document any changes.
Reinjection reproducibility
Following storage, a run that includes a minimum of five replicas of all medium, low, and high QCs as well as calibration standards is reinjected to evaluate injection repeatability. The viability of the treated samples is determined by the reinjected QCs’ accuracy as well as precision and reults are determined in table 13.
Results
Method validation:The method was validated according to the ICH guidelines.
Linearity
Table 1: System suitability parameters
| Parameters | DAB |
| Absorption wavelength (nm) | 449 |
| Beers law range (µg/ml) | 8-62 |
| Limit of Detection (µg/ml) | 0.1208 |
| Limit of Quantification (µg/ml) | 0.366 |
| Correlation coefficient (r2) | 0.9997 |
| Slope (m) | 0.0243 |
| Intercept (c) | 0.0098 |
| Regression equation (y) | Y= 0.0243x+0.0098 |
Table 2: Concentration Vs Absorbance of Standard Drug
| Concentration | Absorbance |
| 8 | 0.1937 |
| 16 | 0.3998 |
| 24 | 0.5987 |
| 32 | 0.7954 |
| 40 | 0.9871 |
| 48 | 1.1845 |
| 56 | 1.3781 |
| 62 | 1.5038 |
Limit of Detection and Limit of Quantification
Table 3: LOD and LOQ of 5ppm DAB
| Limit of Detection | 0.1208µg/ml |
| Limit of Quantification | 0.366µg/ml |
Accuracy: *Three replicas of each concentration
Table 4: Recovery Study of DAB formulation (Dabigat 75mg)
| % Level | Sample amount(µg/ml) | Standard amount (µg/ml) | Mean Absorbance | Recovery Absorbance | % Recovery | Mean Recovery |
| 50% | 16µg/ml | 8 µg/ml | 0.5851 | 0.1903 | 98.24% | 100.26% |
| 100% | 16µg/ml | 16 µg/ml | 0.7375 | 0.3427 | 100.72% | |
| 150% | 16 µg/ml | 24 µg/ml | 1.0045 | 0.6097 | 101.83% |
Precision
Table 5: Precision Method concerning Intra and inter-day
| Concentration | Intra-day(Morning) | Intra-day(Evening) | Inter-day(Day-1) | Inter-day(Day-2) | Precision |
| 32 µg/ml | 0.7536 | 0.7532 | 0.7535 | 0.7540 | 0.7994 |
| 32 µg/ml | 0.7539 | 0.7536 | 0.7531 | 0.7541 | 0.7991 |
| 32 µg/ml | 0.7534 | 0.7539 | 0.7533 | 0.7542 | 0.7994 |
| 32 µg/ml | 0.7533 | 0.7531 | 0.7536 | 0.7539 | 0.7991 |
| 32 µg/ml | 0.7531 | 0.7534 | 0.7538 | 0.7543 | 0.7993 |
| 32 µg/ml | 0.7535 | 0.7533 | 0.7532 | 0.7542 | 0.7994 |
| Average | 0.7534 | 0.7534 | 0.7534 | 0.7541 | 0.799283 |
| SD | 0.00028 | 0.00029 | 0.00026 | 0.00014 | 0.000147 |
| %RSD | 0.03 | 0.038 | 0.03 | 0.018 | 0.018416 |
Robustness
Table 6: Robustness studies at 1nm
| S. No | Concentration | 448nm | 449nm | 450nm |
| 1. | 32 µg/ml | 0.7858 | 0.7994 | 0.8156 |
| 2. | 32 µg/ml | 0.7859 | 0.7998 | 0.8162 |
| 3. | 32 µg/ml | 0.7861 | 0.7996 | 0.8169 |
| 4. | 32 µg/ml | 0.7565 | 0.7995 | 0.8165 |
| 5. | 32 µg/ml | 0.7869 | 0.7996 | 0.8168 |
| 6. | 32 µg/ml | 0.7861 | 0.7997 | 0.8167 |
| Average | 0.7862 | 0.7996 | 0.8165 | |
| SD | 0.00041 | 0.0001 | 0.00048 | |
| %RSD | 0.052 | 0.017 | 0.058 |
Ruggedness
Table 7: Ruggedness studies with different analysts and instruments were studied
| S. No | concentration | Analyst-1 | Analyst-2 | UV-1 | UV-2 |
| 1. | 32 µg/ml | 0.7982 | 0.7963 | 0.7970 | 0.7974 |
| 2. | 32 µg/ml | 0.7985 | 0.7942 | 0.7969 | 0.7975 |
| 3. | 32 µg/ml | 0.7981 | 0.7956 | 0.7967 | 0.7976 |
| 4. | 32 µg/ml | 0.7984 | 0.7948 | 0.7965 | 0.7973 |
| 5. | 32 µg/ml | 0.7986 | 0.7960 | 0.7971 | 0.7978 |
| 6. | 32 µg/ml | 0.7981 | 0.7951 | 0.7968 | 0.7979 |
| Average | 0.7983 | 0.7953 | 0.7968 | 0.7975 | |
| SD | 0.00021 | 0.000784 | 0.000219 | 0.000310 | |
| %RSD | 0.026 | 0.098 | 0.0274 | 0.0310 |
Assay: The percentage assay was found to be 100.62%
Total weight of 10 capsules = 6.1658g
Average weight of capsules = 0.6165g
10mg equivalent was weighed for assay as follow:
75mg → 0.6165g
10mg → ?
= 10*0.6165/75
= 0.0822g
y = mx + c
x = y-c/m
y = 0.4060 m = 0.0245 c = 0.0098
= 0.4060-0.0098/0.0245
= 0.3962/0.0245
= 16.1 µg/ml
16µg/ml → 100%
16.1µg/ml → ?
= 16.1*100/16
= 100.62%
*The percentage assay was found to be within limits i.e, 98-102%
Quantification of DAB in spiked plasma and validation
Linearity
Table 8: Calibration range of DAB with ethanol in spiked plasma
| S. No | Concentration | Absorbance |
| 1. | 5 | 0.1347 |
| 2. | 10 | 0.2916 |
| 3. | 15 | 0.4391 |
| 4. | 20 | 0.6093 |
| 5. | 25 | 0.7697 |
| 6. | 30 | 0.9206 |
| 7. | 35 | 1.0843 |
| 8. | 40 | 1.2125 |
| 9. | 45 | 1.4226 |
Precision
Table 9: Between-run precision data of dabigatran for the day – 1 &2
| B/W the run (Day-1) | 5ppm (LLQC) | 15ppm (LQC) | 30ppm (MQC) | 45ppm (HQC) |
| 0.5809 | 0.9514 | 1.5348 | 1.4226 | |
| 0.5425 | 0.9521 | 1.5317 | 1.4351 | |
| 0.5401 | 0.9401 | 1.7336 | 1.4215 | |
| Average | 0.141166667 | 0.347866667 | 0.733366667 | 1.4264 |
| SD | 0.00122202 | 0.016735231 | 0.001563117 | 0.007554469 |
| %RSD | 12.865657746 | 11.936152958 | 11.213142568 | 12.52961784 |
| B/W the run (Day-2) | 5ppm (LLQC) | 15ppm (LQC) | 30ppm (MQC) | 45ppm (HQC) |
| 0.1453 | 0.3641 | 0.7421 | 1.5281 | |
| 0.1445 | 0.3635 | 0.7426 | 1.5091 | |
| 0.1439 | 0.3659 | 0.7428 | 1.5164 | |
| Average | 0.144566667 | 0.3645 | 0.7425 | 1.517866667 |
| SD | 0.010702377 | 0.0101249 | 0.010360555 | 0.01095836 |
| %RSD | 13.485849839 | 11.34266107 | 11.048559613 | 11.631447832 |
Accuracy
Table 10: Within-run precision data of dabigatran for each run
| within the run | 5ppm (LLQC) | 15ppm (LQC) | 30ppm (MQC) | 45ppm (HQC) |
| 0.1429 | 0.3514 | 0.7368 | 1.1159 | |
| 0.1425 | 0.3598 | 0.7397 | 1.1067 | |
| 0.1421 | 0.3541 | 0.7308 | 1.0681 | |
| 0.1448 | 0.3562 | 0.7361 | 1.0982 | |
| 0.1437 | 0.3572 | 0.7379 | 1.0734 | |
| 0.1457 | 0.3527 | 0.7374 | 1.0956 | |
| Average | 0.14361667 | 0.355233333 | 0.73645 | 1.092983333 |
| SD | 0.0014006 | 0.003100108 | 0.003024401 | 0.018708652 |
| %RSD | 12.9752316 | 11.872696122 | 10.410672926 | 12.711705167 |
Matrix effect
Table 11: Matrix effect of dabigatran with low and high QC samples
| LQC | Matrix-1 | Matrix-2 | Matrix-3 |
| 5ppm | 0.1496 | 0.1509 | 0.1295 |
| 5ppm | 0.1459 | 0.1549 | 0.1263 |
| 5ppm | 0.1489 | 0.1526 | 0.1284 |
| Mean | 0.1481 | 0.1528 | 0.128066667 |
| SD | 0.001965 | 0.002007486 | 0.001625833 |
| %RSD | 10.3268 | 13.313799732 | 12.269520916 |
| HQC | Matrix-1 | Matrix-2 | Matrix-3 |
| 45ppm | 1.2046 | 1.2284 | 1.1985 |
| 45ppm | 1.2094 | 1.2293 | 1.1992 |
| 45ppm | 1.2051 | 1.2308 | 1.2057 |
| Mean | 1.2063 | 1.2295 | 1.201133333 |
| SD | 0.00263 | 0.001212 | 0.003970306 |
| %RSD | 12.21874 | 11.098612 | 10.330546688 |
Bench top stability studies
Table 12: Stability study of dabigatran LQC (5ppm) and HQC (45ppm)
| 0 hours low QC | 2hours | 4hours | 6hours | 8hours |
| 88.23% | 89.24% | 92.74% | 94.61% | 96.34% |
| 88.94% | 90.12% | 92.84% | 94.76% | 96.71% |
| 89.23% | 90.85% | 92.54% | 95.02% | 97.24% |
| Mean: 88.80% | 90.07% | 92.71% | 94.80% | 96.76% |
| Standard deviation: 0.005145 | 0.008062 | 0.001528 | 0.002074 | 0.004524 |
| 0 hours high QC | 2hours | 4hours | 6hours | 8hours |
| 90.42% | 92.84% | 93.84% | 94.81% | 98.34% |
| 91.24% | 93.04% | 94.28% | 95.21% | 98.42% |
| 91.67% | 93.62% | 94.51% | 95.63% | 99.17% |
| Mean: 91.11% | 93.17% | 94.21% | 95.22% | 98.64% |
| Standard deviation: 0.006351 | 0.004051 | 0.003404 | 0.0041 | 0.004579 |
Reinjection reproducibility
Table 13: Reinjection reproducibility data
| Reinjection reproducibility | |
| Low QC (5ppm) | High QC (45ppm) |
| 0.1359 | 1.2828 |
| 0.1355 | 1.2638 |
| 0.1361 | 1.2525 |
| 0.1348 | 1.2527 |
| 0.1357 | 1.2906 |
| Average: 0.1356 | 1.26848 |
| Standard deviation: 0.0105 | 0.017469 |
| %RSD: 12.368732 | 10.37714 |
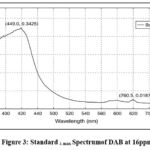 |
Figure 3: Standard λ max Spectrumof DAB at 16ppm. |
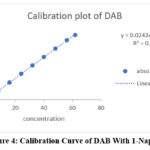 |
Figure.4: Calibration Curve of DAB With 1-Napthol |
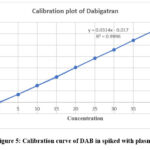 |
Figure 5: Calibration curve of DAB in spiked with plasma |
Discussion
Dabigatran has previously been quantified using UV spectroscopy with NQS and MBTH reagents. The MBTH method relies on an oxidative coupling reaction, while NQS is used for determining primary and secondary amines via a derivatization process. These methods were validated across specific concentration ranges: 1–10 µg/mL for NQS and 1–6 µg/mL for MBTH, with both achieving correlation coefficients of 0.999, indicating strong linearity. The percentage assay of dabigatran was calculated as 101% with NQS and 100.9% with MBTH.
For NQS, the limits of detection (LOD) and quantification (LOQ) were determined as 0.048 µg/mL and 0.147 µg/mL, respectively. For MBTH, the LOD and LOQ were found to be 0.0578 µg/mL and 0.298 µg/mL. Dabigatran obeyed Beer’s law in the concentration range of 8–62 µg/mL when analyzed with 1-naphthol, achieving a correlation coefficient of 0.999. The LOD and LOQ for dabigatran with 1-naphthol were calculated as 0.120 µg/mL and 0.366 µg/mL, respectively. Recovery studies demonstrated an accuracy rate of 100.0%.
Plasma was extracted by protein precipitation with acetonitrile. The calibration range for dabigatran in plasma was established as 5–100 µg/mL. Stability studies confirmed that results remained within acceptable limits. Furthermore, recovery studies for accuracy and precision yielded consistent and reliable results.The validation parameters for the method were performed as per ICH Q2R1 and M10 guidelines, and results were found to be within limits.
Conclusion
The proposed spectrophotometric approach for quantifying DAB in pharmaceutical dosage forms has proven to be simple, sensitive, accurate, and precise. The assay results demonstrated a strong agreement with the label claims, affirming the method’s reliability. The spectrophotometric technique stands out due to its minimal solvent use, elimination of extraction steps, high specificity, and exceptional sensitivity. These attributes make it particularly advantageous for routine application in quality control of DAB in pharmaceutical formulations.
Additionally, a UV-visible method was developed and validated for the quantification of DAB in human plasma. This method is cost-effective, user-friendly, and meets all regulatory requirements for selectivity, sensitivity, linearity, accuracy, precision, and stability. The successful validation underscores its potential for consistent use in quality control laboratories, ensuring accurate and reliable analysis of DAB across various applications.
Acknowledgement
I need to recognize our cherished Principal and the staff of the Department of Pharmaceutical Analysis for giving me the chance.
Funding Sources
The author(s) received no financial support for the research, authorship, and/or publication of this article.
Conflicts of Interest
The authors do not have any conflicts of interest.
Data availability
This statement does not apply to this article.
Ethics Statement
This research did not involve human participants, animal subjects, or any material that requires ethical approval.
Informed consent statement
This study did not involve human participants, and therefore, informed consent was not required.
Clinical Trial Registration
This research does not involve any clinical trials.
Permission to reproduce material from other sources
Not Applicable
Author Contributions
- Khagga bhavyasri: Funding Acquisition, Visualization, Supervision, resources, Project Administration.
- Thandra Ambika: Methodology, Writing- Original Draft.
- Mogilli Sumakanth: Funding Acquisition.
- Dhilli Rao Gorja: Supervision.
References
- Hankey, Graeme J.; Eikelboom, John W. “Dabigatran etexilate: A new oral thrombin inhibitor”. Circulation. 2011; 123: 1436–50.
CrossRef - Panikumar Durga Anumolu, Sunitha Gurrala, Archana Gellaboina, Divya Gayathri Mangipudi, Sahitya Menkana, Rajesh Chakka. Spectrophotometric Quantification of Anti-inflammatory Drugs by Application of Chromogenic Reagents. Turkish journal of pharmaceutical sciences. 2019; 16(4):410–415.
CrossRef - Shah, R.S., Shah, R.R., Pawar, R.B. and Gayakar, P.P. UV-Visible spectrophotometry-a review. International journal of institutional pharmacy and life sciences. 2015; 5(5): 490-505.
- Basima Arous and Mohammad Amer al-mardini. LC-MS Method for analysis of dabigatran and its impurities. Acta scientific pharmaceutical sciences. 2019; 3(5): 121-127.
- A. Srinivas, K. Sridhar Reddy, G. Sai. Method development and validation of dabigatran etexilate mesylate by RP-HPLC method and its degradation studies. International journal of trends in pharmacy and life sciences.2016; 2(1): 769-777.
- J. Nagadeep, P. Kamaraj, M. Arthanareeswari. Gradient RP-HPLC method for the determination of potential impurities in dabigatran etexilate in bulk drug and capsule formulations. Arabian journal of chemistry. 2015; 3431-3443.
CrossRef - Dare M, Jain R and Pandey A. Method validation for stability indicating method of related substance in active pharmaceutical ingredients dabigatran etexilate mesylate by reverse phase chromatography. Journal of Chromatography Separation Techniques. 2015; 6(2): 1-10.
- Pintu b. Prajapati arti, j. Rakholiya, Kunjan B. Bodiwala, Bhavin P. Marolia, Mindia Shailesh A. Shah. Stability indicating HPTLC method for estimation of dabigatran etexilate mesylate in its pharmaceutical dosage form. Eurasian journal of analytical chemistry. 2017; 12(2):75-86.
CrossRef - Sanjay s shetgar, K Basavaiah and B. MR Rao. Development and validation of the reversed phase UPLC method for the quantitative estimation of dabigatran etexilate in dabigatran etexilate capsules. International journal of pharmacy and biological sciences- IJPBSTM. 2021; 11(2): 54-62.
- Barla karuna devi, Manasa somireddy, Swathi naraparaju, Pani kumar d anumolu , Soujanya chaganti. Spectrophotometric determination of dabigatran etexilate mesylate using 1, 2-napthoquinone-4-sulfonate (NQS) reagent in bulk and capsules. International journal of pharmaceutical research and applications. 2023; 8(3):1275-1284.
- Pani Kumar da, Archana g, Sunitha g, Rachel Paul K, Harika r, and Sowndarya. Simplistic application of 3-methy-2-benzothiazoline hydrazone (MBTH), an oxidative coupling chromogenic reagent for quantification of metaxalone and dabigatran etexilate mesylate bulk drug and their dosage forms.Pharmaceutica analytica acta. 2015; 6(5);1-5.
CrossRef - International conference on harmonization (ICH) of technical requirements for the registration of pharmaceuticals for human use, validation of analytical procedure: methodology (ICH – Q 2B), November, 1996, 1-8.
- Dr. Khagga Bhavyasri. Samreen begum, D. Suchitra, V. Narmad. Estimation of repaglinide and metformin HCls from pharmaceutical formulation by q-absorbance ratio method using UV spectrophotometer. International journal of pharma and bio sciences. 2024; 15(1):64-72.
CrossRef - R. Swetha sri, G. Sowmya, K. Bhavyasri, mogilisumakanth. Review on derivative UV spectroscopy. International research journal of pharmacy. 2022; 13(2):1-3.
CrossRef - K. Bhavyasri. Method development, validation and stress studies of dapagliflozin and metformin hydrochloride using ultraviolet-visible spectroscopy in bulk and combined pharmaceutical formulations. Bioscience biotechnology research communications. 2020; 13(4):1986-1992.
CrossRef - Khagga bhavyasri, cheiati mounika, M. Sumakanth. Method development, validation, and forced degradation studies for determination of tigecycline in bulk and pharmaceutical dosage form using UV spectroscopy. Journal of Young Pharmacists. 2020; 12(2s): s63-s66.
CrossRef - Dr. Bhavyasri khagga, kavya. Parelli, Dr.Sumakanth.Mogili. Development and validation of UV method for identification and qualification of betamethazone in API and drug formulation, including stability studies. Journal of pharmaceutical sciences & research. 2021; 13(8): 452-456.
- K. Bhavyasri, R. Sai Chandana, M. Sumakanth, R. Swethasri. Analytical method development and validation for the estimation of pioglitazone hydrochloride in bulk and formulation by UV spectrophotometry. American journal of pharm tech research. 2019; 9(4): 2249-3387.
CrossRef - K. Bhavyasri, M. Manisha. Uv-spectrophotometric estimation and forced degradation studies of tenofovir alafenamide fumarate (TAF) in its bulk and tablet dosage form. Research journal of pharmacy and technology. 2020; 13(3): 1231-1235.
CrossRef - Chatwal G.R, Anand S.K. Instrumental methods of chemical analysis, (analytical chemistry). 5th revised and expanded edition. Published by Himalya Publishing House. 2005.
- Conners K.A. A textbook of pharmaceutical analysis. 3rd edition.New York: Published by Wiley and sons; 2002.
- Kemp william. Organic spectroscopy. 3rd edition reprint. New York: Published by Palgrave Publication; 2005.
- Finar I.C. Organic chemistry. 5th edition. New York: Published by john wiley and sons; 1973.
- Sharma B.K.Instrumental methods of chemical analysis. Meerut: Published by Goel Publishing House; 1981.
- Dr. K. Bhavyasri, B. Anila, S. Saileela, dr. Mogili sumakanth. Method development of niacin in bulk and dosage form by UV visible spectrophotometer. International journal of modern pharmaceutical research. 2022; 6(9), 41-43.
- Mrinalini C. Damle, Rupesh A. Bagwe. Development and validation of stability-indicating RP-HPLC method for estimation of dabigatran etexilate. Journal of Advanced Scientific Research. 2014; 5(3): 39-44.
- Li Di, Edward H. Kerns. Biological assay challenges from compound solubility: strategies for bioassay optimization. Drug Discovery Today. 2006; 11: 446-451.
CrossRef - Panikumar Durga Anumolu, Sunitha Gurrala, Archana Gellaboina, Divya Gayathri Mangipudi, Sahitya Menkana, Rajesh Chakka. Spectrophotometric Quantification of Anti-inflammatory Drugs by Application of Chromogenic Reagents. Turkish journal of pharmaceutical sciences.2019; 16(4):410–415.
CrossRef - Dr. Khagga Bhavyasri. Samreen begum, D. Suchitra, V. Narmad. Estimation of repaglinide and metformin HCls from pharmaceutical formulation by q-absorbance ratio method using UV spectrophotometer. International journal of pharma and bio sciences. 2024; 15(1):64-72.
CrossRef - K. Bhavyasri. Method development, validation and stress studies of dapagliflozin and metformin hydrochloride using ultraviolet-visible spectroscopy in bulk and combined pharmaceutical formulations. Bioscience biotechnology research communications. 2020; 13(4):1986-1992.
CrossRef - Khagga bhavyasri, cheiati mounika, M. Sumakanth. Method development, validation, and forced degradation studies for determination of tigecycline in bulk and pharmaceutical dosage form using UV spectroscopy. Journal of Young Pharmacists. 2020; 12(2s): s63-s66.
CrossRef - Dr. Bhavyasri khagga, kavya. Parelli, Dr.Sumakanth.Mogili. Development and validation of UV method for identification and qualification of betamethazone in API and drug formulation, including stability studies. Journal of pharmaceutical sciences & research. 2021; 13(8): 452-456.
- K. Bhavyasri, R. Sai Chandana, M. Sumakanth, R. Swethasri. Analytical method development and validation for the estimation of pioglitazone hydrochloride in bulk and formulation by UV spectrophotometry. American journal of pharm tech research. 2019; 9(4): 2249-3387.
CrossRef - K. Bhavyasri, M. Manisha. Uv-spectrophotometric estimation and forced degradation studies of tenofovir alafenamide fumarate (TAF) in its bulk and tablet dosage form. Research journal of pharmacy and technology. 2020; 13(3): 1231-1235.
CrossRef - Dr. K. Bhavyasri, B. Anila, S. Saileela, dr. Mogili sumakanth. Method development of niacin in bulk and dosage form by UV visible spectrophotometer. International journal of modern pharmaceutical research. 2022; 6(9), 41-43.
- Dr. K. Bhavyasri, B. Aishwarya, D. Suchitra, M. Sumakanth. Spectrometric Bioanalytical Method Development and Validation of Tolvaptan in Spiked Human plasma Followed by Forced Degradation Studies. Research journal of pharmacy and technology. 2023; DOI:10.52711/0974-360X.2023.00973.
CrossRef - Maria Elena Marson, Diego Dante Dana, Jaime Altcheh, Facundo Garcia-Bournissen, Guido Mastrantonio. Development of UV/HPLC Methods for Quantitative Analysis of Benznidazole in Human Plasma and Urine for Application in Pediatric Clinical Studies. Journal of Clinical Laboratory Analysis.2013; 27(5): 384-390.
CrossRef - Sultan, Mohamed; Stecher, Gunther; Stoggl, Wolfgang M.; Bakry, Raina; Zaborski, P.; Huck, C. W.; El Kousy, Nagla M; Bonn, Gunther K.Sample Pretreatment and Determination of Non-Steroidal Anti-Inflammatory Drugs (NSAIDs) in Pharmaceutical Formulations and Biological Samples (Blood, Plasma, Erythrocytes) by HPLC-UV-MS and μ-HPLC. Current Medical Chemistry. 2005; 15(5): 573-588.
CrossRef - Shahlaei, Mohsen, Andisheh, Hadi, Derakhshandeh, Katayoun, Sadrjavadi, Komail, Azami, Mahsa. A novel method for simultaneous determination of codeine and acetaminophen in plasma by combination of UV-vis spectroscopy and artificial neural network. Journal of Reports in Pharmaceutical Sciences. 2014;3(2): 141-158.
CrossRef - International Council for Harmonisation of Technical Requirements for Pharmaceuticals for Human Use, Bioanalytical Method Validation And Study Sample Analysis (M10), Final version Adopted on 24 May 2022.
Abbreviations List
Dabigatran etexilate mesylate (DAB),
Ultra violet visible (UV) spectroscopy,
Hydrochloric acid (HCl),
Standard Deviation Relative (RSD),
Quality control (QC),
Limit of Quantification (LOQ),
Limit of Detection (LOD).

