
Manuscript accepted on :14-11-2022
Published online on: --
Plagiarism Check: Yes
Reviewed by: Dr. Imtiaz Wani
Second Review by: Dr. Nagham Aljamali
Final Approval by: Dr. Patorn Promchai
Dhuha A. Alshammaa1* , Zainab A. A. Alshamma2and Ammar Amer3
1University of Baghdad/ College of Pharmacy/ Department of Pharmacognosy and medicinal plants. Iraq
2Baghdad College of Medical Science/ Department of Pharmacy/Clinical Chemistry. Iraq
3University of Baghdad/College of Pharmacy/ Department of Pharmacology. Iraq
Corresponding Author E-mail: drdhuha2010@yahoo.com
DOI : https://dx.doi.org/10.13005/bpj/2580
Abstract
Hypercholesterolemia is a predominant risk factor for atherosclerosis and cardiovascular disease (CVD). The World Health Organization (WHO), ) recommended reducing the intake of cholesterol and saturated fats. On the other hand, limited evidence is available on the benefits of vegetables in the diet to reduce these risk factors, so this research was conducted to compare the hypolipidemic effect between the extracts of two different types of Iraqi peppers, the fruit of the genus Capsicum traditionally known as red pepper extract (RPE), and Piper nigrum as black pepper extract (BPE), respectively, in different parameters and histology of the liver of the experimental animals. The red pepper was extracted by ethyl acetate, while the black pepper was extracted by 90% ethanol, then each extract was concentrated for further analysis. Reversed-phase high-performance liquid chromatography (RP-HPLC) results confirm the presence of a high percentage of alkaloids responsible for hypolipidemic activity studied against hypercholesterolemic rats divided into five rats into six groups for ten weeks. We measured different parameters such as the lipid profile, the oxidized low-density lipoprotein (LDL), and the serum level of the most important parameters of the kidney and liver function tests. We also compared body weight after ten weeks. This study showed a slight or nonsignificant decrease in cholesterol, TG, very low-density lipoprotein VLDL, low-density lipoprotein LDL, and oxidized LDL with a considerable increase in high-density lipoprotein HDL in group V (high-fat diet + black pepper extract). Study results were improved by histological changes induced in liver tissue. In conclusion, the results focused on consuming these vegetables and reducing cholesterol levels, as it is considered a risk factor for cardiovascular disease (CVD).
Keywords
Hypercholesterolemia; Histopathology; Lipid profile; Pepper extract; RP-HPLC
Download this article as:| Copy the following to cite this article: Alshammaa D. A, Alshamma Z. A, Amer A. Phytochemical Comparison Study for Evaluating the Hypolipidemic Effect Between Two Iraqi Pepper Spp in the Rats Model. Biomed Pharmacol J 2022;15(4). |
| Copy the following to cite this URL: Alshammaa D. A, Alshamma Z. A, Amer A. Phytochemical Comparison Study for Evaluating the Hypolipidemic Effect Between Two Iraqi Pepper Spp in the Rats Model. Biomed Pharmacol J 2022;15(4). Available from: https://bit.ly/3VU60e2 |
Introduction
Hypercholesterolemia and hypertriglyceridemia are of great interest since they are associated with atherosclerosis and CVD cardiovascular disease. The first step in the primary treatment strategy is a combination of lifestyle changes, diet, and other natural regimens 1. These have a greater potential to lower the cost than drug therapy to decrease the cholesterol level and reduce hypercholesteremia as a risk factor for CVD. As a result, researchers are returning to traditional medicine as these drugs are safe and easily available at less cost. More clinical studies must approve this to confirm its safety and meet the world population’s demand 2. Therefore, developing new and cost-effective herbal medications, such as cholesterol-lowering drugs, is preferable 3.
The fruit of the genus Capsicum has beneficial phytochemical compounds, including Capsaicinoids in red pepper as aromatic components [Fig.1]. Among them, capsaicin (8-methyl-N-vanillyl-trans-6-none amid) and dihydrocapsaicin are the main pungent components; these compounds are now widely used in health foods and medical products 4. In addition, black pepper (Piper nigrum Linn. Piperaceae), known as the ‘King of spices’ in folklore, is used worldwide. Traditionally, black pepper was used to treat hyperlipidemia and coronary heart disease 5. Black pepper contains essential oils, piperine, chavicine, piperidine, and piperidine [fig.2] Piperine (1‐piperoyl piperidine) is the main active constituent as an alkaloid containing nitrogen present in the fruits of many species of piper such as long pepper (Piper longum), black pepper (Piper nigrum), and others. In general, Piperine is considered safe by the United States Food and Drug Administration (FDA) 6.
This research aimed to study the hypolipidemic effect of the main active constituents in two varieties of pepper red and black pepper extracts on the lipid profile, serum urea, creatinine, and aspartate transaminase (AST) and alanine transaminase (ALT), in addition to body weight.
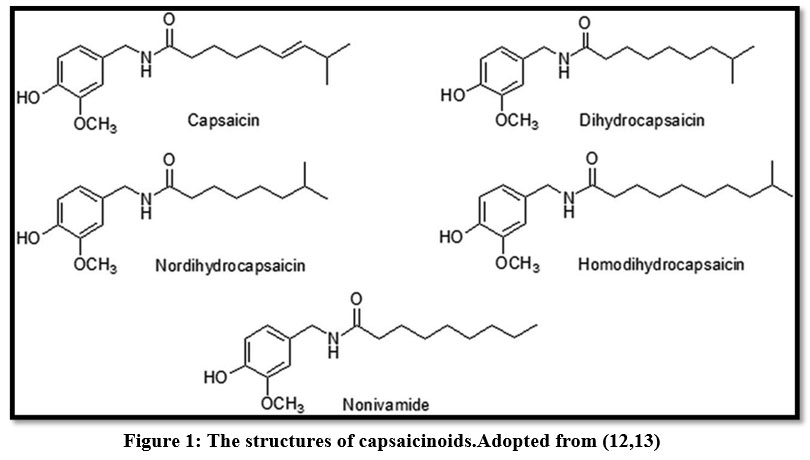 |
Figure 1: The structures of capsaicinoids. Adopted from (12,13) |
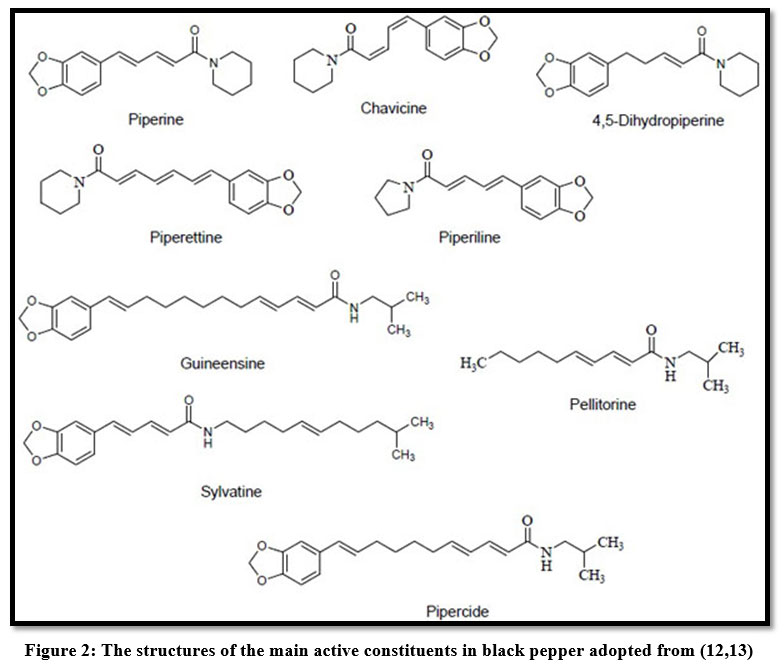 |
Figure 2: The structures of the main active constituents in black pepper adopted from (12,13) |
Materials and Methods
Materials
Plant materials and collection
Two varieties of pepper: one is the fresh red chili pepper (Capsicum annum, L.), and the second is the black pepper seeds (Piper nigrum Linn.). The red pepper was harvested from a green farm in the city of Youssoufia, June-July 2020, at full maturity, washed with tap water, and dried at room temperature in a shaded area for two weeks. At the same time, black pepper was bought from the market. Each was mixed to a fine powder with a blender, packed in perforated plastic bags stored in a dry, cool place until extraction.
Chemicals
Cholesterol powder 500 mg (biochemical) BDH Chemicals Ltd Poole England, 10 mg tablet (micro–Labs Limited, India), All chemicals and reagents used were high quality. The diagnostic kits used were obtained from (Randox Laboratories Ltd) for the estimation of cholesterol, HDL, LDL, and VLDL, while the Rat Oxidized Low-Density Lipoprotein (Ox-LDL) ELISA Kit from (Cusabio -chain).
Experimental animals
Thirty adults, Wister Albino rats of both sexes weighing 200–250 g, were purchased from the laboratory animal house at Baghdad’s pharmacy college/ university. Kept under specific pathogen-free conditions, provided with water and food ad libitum during a 12-hour light-dark cycle, and kept during the study at regular room temperature (18 -21 Co). Animals were handled throughout this process following the Declaration of Helsinki, which the University approved by Baghdad’s ethics committee for using animals in research. The Institutional Animal Ethics Committee accepted the experiment protocol.
Methods
Preparation of Plant Extract
About 2 kg of mature Capsicum annum (bird’s eye chili) gives 160 g of ry powder extracted by cold maceration with 100% ethyl acetate for 5 days, twice. After filtration, the clear filtrate is concentrated by a rotary evaporator for complete dryness to give 4 g of red pepper crude extract(7). At the same time, 150g of dry black pepper seeds were extracted with 90% ethanol using the Soxhlet apparatus until exhausted. After filtration, the clear filtrate was concentrated by a rotary evaporator to give about 20.7 g of black pepper crude extract.
RP- HPLC condition:
HPLC conditions for Capsaicin: C18 column (150 mm × 4.6 mm, 5 μm).
Gradient Elution:
A: 1% Acetic acid: Acetonitrile (50:50);
B: Acetonitrile;
The program: (A/B), (100/0) from 0 min to 15 min; then (0/100) from 15.05 min to 20.00 min; 20.05 min (100/0) to 35.5 min; the injection volume 20 uL, at flow rate 1.0 ml/min, column temp 40°C; at wavelength 280 nm;8
HPLC conditions for piperine: RP-HPLC was performed using methanol and water as mobile phase. The detection and quantification were performed at a wavelength of 345 nm 9.
Animals and diet
Thirty healthy rats weighing up (to 200-250 g) were used in the present study between March and May 2021. The animals were placed in cages and exposed to constant environmental conditions, and a high-fat diet was prepared by adding 1.5 g/kg to the daily animal diet. The plant extract was given by oral gavage to the animals, each one alone or in combination with two combinations of plant extracts.
The animals were divided into six groups, each of five animals:
(I): Control group either D.W. or normal saline only.
(II): (HCD) 1500 mg of cholesterol/kg of body weight /day
(III): 10mg/kg/day Atorvastatin+ HCD
(IV): 100mg/kg/day of red pepper extract + HCD
(V): 500mg/kg/day of black pepper extract +HCD
(VI): 250mg/kg/day of black pepper plus 50 mg/ kg/day of red pepper extract +HCD.
Blood samples
Under control conditions, the analysis was performed at about 250C. Two milliliters (2mL) of blood were drawn by heart puncture from each rat in the experiment after two weeks and ten weeks. The sample was collected in a plain tube, left for 15 min. for clotting at room temperature, then centrifuged for 15 min. at 3000 rpm for serum separation and kept at -20 c refrigerated for further analysis.
Biochemical analysis
Oxidized LDL was determined by enzyme-linked immunosorbent assay (ELISA) (Cusabio, China). At the same time, blood lipid profile, urea, creatinine, ALT, and AST were performed simultaneously after serum separation using the spectrophotometric method SPEC ORD 40 (Analytic Jena, Germany) at the Baghdad College of Medical Sciences labs.
Statistical analysis
Statistical analysis depended on mean± standard deviation (mean ±SD) and the Social Sciences statistical package (SPSS version 23. 0). In contrast, the difference between the two means was assessed using an independent student t-test.
Histological Examination
The animals were anesthetized by cervical dislocation. Liver tissues were quickly removed from rats, fixed in a 4% paraformaldehyde solution, and then embedded in paraffin. Sections were obtained and stained with hematoxylin and eosin (H&E) for histological examination under a microscope. The samples were treated with an ultrathin microtome and stained with uranyl citrate-lead citrate. Finally, the ultrastructure of the hepatocytes was observed and photographed with a transmission electron microscope.
Results
Chromatographic results
Optimal chromatographic conditions should be used to obtain a good resolution of adjacent peaks within a short analysis time. Using the reversed-phase column, various mobile phases have been used to analyze capsaicinoids and piperine 10. For qualitative and quantitative analysis of the main active constituents in the plant extract, the high-performance liquid chromatography (HPLC) technique depends on the tR of the peak. The area under the peak depends on the concentration of the active phytochemical constituents in the sample, as shown in Figure (3) for the analysis of capsaicinoids using the reversed-phase column under optimal conditions, both capsaicin (tR 6.5 min) and dihydrocapsaicin (tR 7.7 min) were separated. Since capsaicin and dihydrocapsaicin are very similar in molecular structures, the maximum absorption wavelengths determined are nearly the same and are found to be 280.8 and 279.6 nm, respectively. Figure (4) HPLC chromatogram of the Piper nigrum Linn seed extract at 345nm, the standard piperine peak (tR 7.19 min).
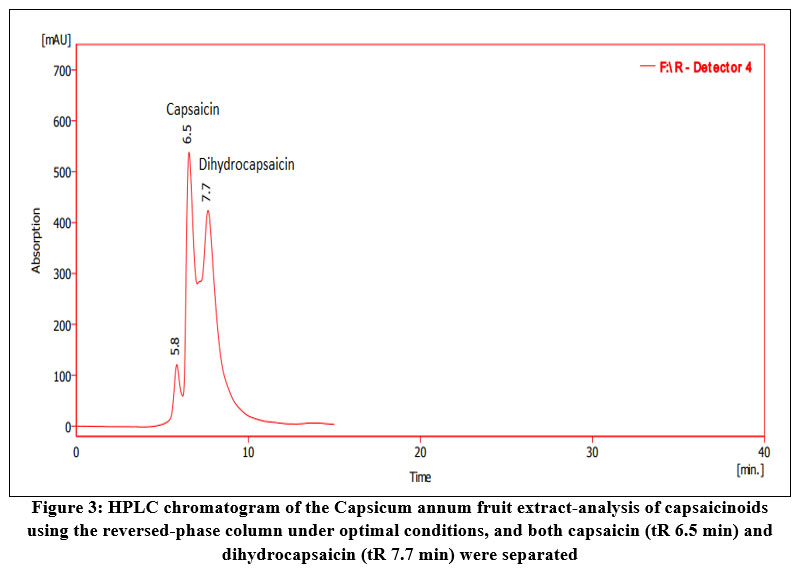 |
Figure 3: HPLC chromatogram of the Capsicum annum fruit extract-analysis of capsaicinoids using the reversed-phase column under optimal conditions, and both capsaicin (tR 6.5 min) and dihydrocapsaicin (tR 7.7 min) were separated |
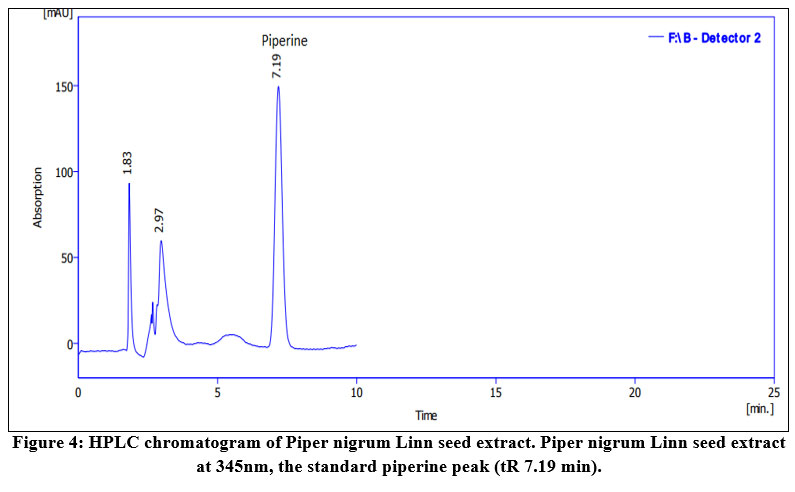 |
Figure 4: HPLC chromatogram of Piper nigrum Linn seed extract. Piper nigrum Linn seed extract at 345nm, the standard piperine peak (tR 7.19 min). |
Effects on Serum Lipid Profiles
Table (1) of the present study did not show significant differences in serum levels of (TG, VLDL, LDL, cholesterol, and oxidized LDL ) s.TG level s. VLDL, s. LDL s. cholesterol and s. oxidized LDL between the HCD group and all other animal groups. However, there is a significant increase in s. cholesterol and HDL in the (HCD +BP) and (HCD +statin) groups, compared to the HCD group (p < 0.05) after the second week of feeding.
At the end of the research, the serum level of lipid profiles (s.TG, s. cholesterol, s. LDL, s. VLDL, oxidized LDL) of the group (HCD + RP) and the group (HCD combination of BP&RP) group (p< 0.05) significantly decreased in comparison to HCD group.
In addition, there is a significant decrease in the serum level of lipid profiles (s.TG, s. cholesterol, s. LDL, s. VLDL) and a highly significant decrease in the serum level of oxidized LDL of the group (HFD +BP) group as compared to the HFD group as shown in Table (2).
Table 1: Comparison between serum lipid profiles of animal groups after the second week
| Parameters (mg/dl) | Control | HFD | HFD+ATVS | HFD +BP | HFD +RP | HFD +comb |
| TG | 104± 13.7 | 104 ± 10.2 | 110± 17.4 | 107±22.5 | 116 ±13.8 | 114 ±12.8 |
| Cholesterol. | 74.3 ±7.6 | 88 ± 7.9 | 92.7±4.7H* | 104.5±9.5 | 96.2±10.5 | 96.7± 8.1 |
| VLDL | 21.0±2.7 | 21.0±3.0 | 22.0±3.5 | 21.3±4.5 | 23.8±2.3 | 22.7±2.5 |
| HDL-c | 37.2±5.3 | 48.9 ± 11.1 | 47.1±5.7 C * | 36.3 ±4.2 | 50.1±11.9 | 45.8±2.8 |
| LDL-c | 16.1±5.8 | 31.2 ± 1.5 | 29.0 ± 2.0 | 37.7±11.1 | 22.8±4.5 | 28.2±10.1 |
| Oxidized LDL-c | 113.5 E-7 ± 6.2E-7 | 132.5 E-7 ± 18.1 E-7 | 183.1 E-7 ±72.7 E-7 | 128.5 E-7 ±19.9 E-7 | 116 E-7 ±3.6 E-7 | 132.8 E-7 ±69.7 E-7 |
| C compared to control rats; H compared to rats fed a high-fat diet. *P < 0.05, **P < 0.01 and ***P < 0.001. E The expected value is the arithmetic mean of a large number of independently selected outcomes of a random variable. [Pre-test] | ||||||
Table 2: Comparison between serum lipid profiles of animal groups after the 10th week.
| Parameters (mg/dl) | Control | HFD | HFD+ atorvastatin | HFD + black pepper | HFD + red pepper | HFD +comb |
| TG | 104.9 ± 12.9 | 164.1 ± 19.3 | 97.0 ± 18.6 H*** | 125 ± 21.9 H* | 81.6 ±13.1H*** | 92.8 ±13.6 H*** |
| cholesterol. | 80.5 ± 6.2 | 102.6 ± 13.5 | 74.5 ± 12.5 H** | 90.3 ± 6.2 H* | 74.2 ± 9.5H** | 78.8 ± 6.3 H* |
| VLDL | 21.0 ± 2.7 | 32.8 ± 3.9 | 18.2 ± 2.9 H*** | 25.1±4.4 H* | 16.7 ± 1.7H*** | 18.5± 2.8 H*** |
| HDL-c | 42.6 ± 6.4 | 36.9 ± 5.6 | 33.2 ± 8.3 | 42.4 ±2.6 | 52.8 ± 11.1H* | 50.1 ± 3.3 H** |
| LDL-c | 16.1 ± 5.8 | 33.2 ± 8.7 | 22.4 ± 5.7 H* | 27.6 ± 5.8 | 5.5 ± 0.28 H** | 9.8 ± 3.2*** |
| Oxidized LDL-c | 117.7 E-7 ± 3.5E-7 | 159.8 E-7 ± 12.1 E-7 | 123.1 E-7 ± 24.6 E-7 H* | 93.0 E-7 ±13.7 E-7 | 93.6 E-7 ±3.6 E-7 H ** | 70.7 E-7 ±46.1 E-7 H** |
| C compared to control rats; H compared to rats fed a high-fat diet. *P < 0.05, **P < 0.01 and ***P < 0.001. E The expected value is the arithmetic mean of a large number of independently selected outcomes of a random variable. [Pre-test] | ||||||
In Table (2), the HDL level is significantly increased in both groups (the HFD +RP), and (the HFD +combination of BP&RP) groups (p< 0.05) after the 10th week of feeding compared to the HFD group. At the same time, there is no significant increase in the group (HFD +BP) group (p > 0.05) as compared to the HFD group. Furthermore, there is a significant decrease in serum lipid profiles (s.TG, s. cholesterol, LDL-c, s. VLDL, s. HDL) and oxidized LDL of the group (HFD +statin) group (p < 0.001), with a nonsignificant decrease in HDL-c level (p > 0.05) as compared to the HFD group after 10 weeks of feeding.
Table 3: Kidney Function Test (KFT) & Liver Function Test(LFT) parameters of the animal groups after the second week feeding.
| Parameters | Control | HFD | HFD +atorvastatin | HFD+black pepper | HFD+ red pepper | HFD+ comb |
| Urea (mg /dl) | 35.6 ± 5.9 | 19.2 ± 4.1 | 16.0 ± 3.7 | 32.8 ± 5.1H* | 29.1± 2.8H* | 45.4 ± 4.7H* |
| Creatinine (mg/dl) | 0.4 ± 0.06 | 0.4 ± 0.05 | 0.4 ± 0.05 | 0.4 ± 0.05 | 0.3 ± 0.04 | 0.4 ± 0.05 |
| ALT (U/L ) | 41.0± 2.9 | 39.5 ± 2.8 | 50.0 ± 13.8 | 43.2 ± 4.7 | 40.0 ± 3.9 | 39.5± 2.8 |
| AST (U/L) | 115.6 ± 5.1 | 121.5± 11.4 | 156.4 ± 33.5 | 127.0±10.9 | 158.1± 48.8 | 121.0± 11.3 |
| C compared to control rats; H compared to rats fed a high-fat diet. *P < 0.05, **P < 0.01 and ***P < 0.001
|
||||||
After the second feeding, there was a significant increase in the KFT parameter (serum urea) in all animal groups (p < 0.05), except the group (HCF +statin) group, which showed no significant change in serum urea (p > 0.05) as compared to the HCF group, as shown in Table 3.
Table 4: Kidney Function Test(KFT) & Liver Function Test(LFT) parameters of the animal groups after the 10th week of feeding.
| Parameters | Control | HFD | HFD +atorvastatin | HFD+ black pepper | HFD+ red pepper | HFD+ comb |
| Urea (mg /dl) | 41.6 ± 6.5 | 41.8 ± 3.4 | 31.8 ± 5.1 H** | 22.0 ± 5.4 H*** | 18.0 ± 2.1 H*** | 21.9 ± 3.7 H*** |
| Creatinine (mg/dl) | 0.34 ± 0.05 | 0.34 ± 0.05 | 0.36 ± 0.05 | 0.36 ± 0.05 | 0.28 ± 0.04 | 0.3 ± 0.07 |
| ALT (U/L ) | 45.2 ± 3.6 | 43.2 ± 3.6 | 36.5 ± 3.00 | 35.2 ± 11.7 | 42.5 ± 7.7 | 43.7 ± 11 |
| AST (U/L) | 113.5 ± 10.3 | 136.9 ± 17.3 | 163.6 ± 44.5 | 135.7 ± 25.3 | 98.1 ± 20.0 | 127. 9 ± 28.6 |
| C compared to control rats; H compared to rats fed a high-fat diet. *P < 0.05, **P < 0.01 and ***P < 0.001
|
||||||
After the 10th week of feeding, there is a highly significant decrease in the KFT parameter (serum urea) in all animal groups (p < 0.001) except between the control group and HCF, as shown in Table 4
There are no significant changes in the KFT parameter (serum creatinine) (p > 0.05) in all animal groups after the second and 10th week of feeding, as shown in Tables 3 and 4, respectively.
The present study did not show significant changes in LFT (Serum levels of AST and ALT) of the animal groups compared to the HFD group (p > 0.05) after the second and 10th weeks of feeding, as shown in Tables 3 and 4. Only the group (HFD +atorvastatin) group showed a significant decrease in serum ALT levels (p < 0.05), and the (HFD+ RB) group showed a significant decrease in serum AST levels (p < 0.05) as compared to the group HFD after 10th week of feeding, as shown in Table 4.
Table 5: Reduced body weight of animal groups after 10 weeks of feeding:
| Animal groups | Body weight (Kg) (Mean ± STD) | P-value |
| Control vs HFD | 269.8 ± 11.4 Vs 310.3± 27.2 | P < 0.001 |
| HFD vs atorvastatin | 310.3± 27.2 Vs 274.9 ± 13.7 | P < 0.001 |
| HFD vs. black pepper | 310.3± 27.2 Vs. 242.5 ± 4.3 | P < 0.001 |
| HFD versus red pepper | 310.3± 27.2 Vs. 260.4± 7.8 | P < 0.001 |
| HFD vs. combination | 310.3± 27.2 Vs. 244.6 ± 7.0 |
P < 0.001 |
The body weight in all animal groups is significantly reduced after the 10th week of feeding compared to the HFD group (p<0.001), as shown in Table 5.
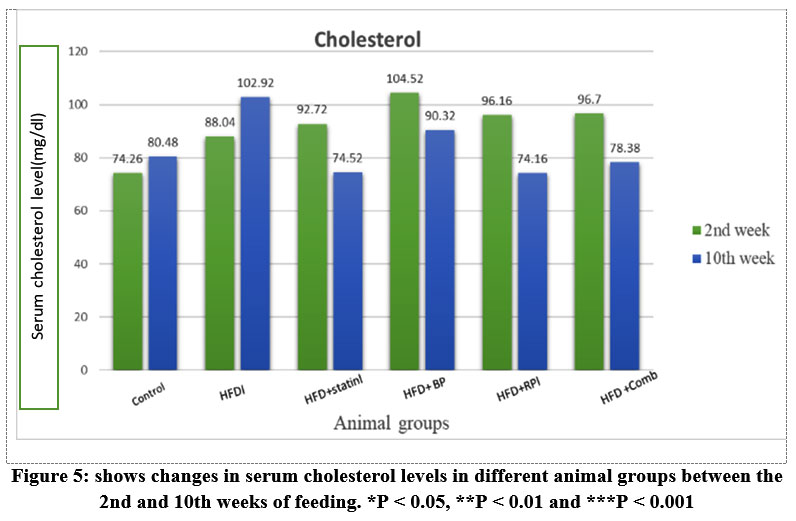 |
Figure 5: shows changes in serum cholesterol levels in different animal groups between the 2nd and 10th weeks of feeding. *P < 0.05, **P < 0.01 and ***P < 0.001. |
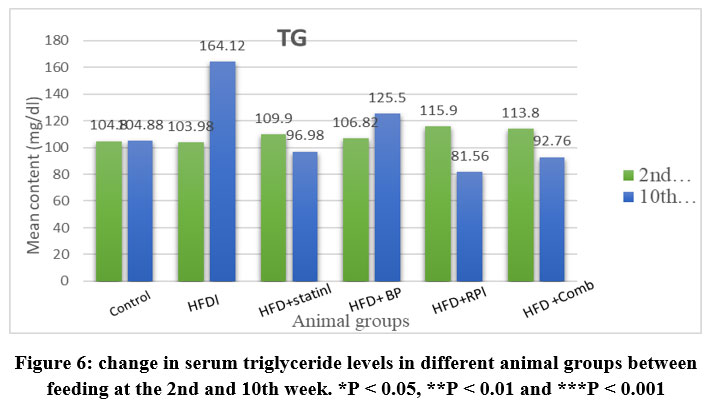 |
Figure 6: change in serum triglyceride levels in different animal groups between feeding at the 2nd and 10th week. *P < 0.05, **P < 0.01 and ***P < 0.001 |
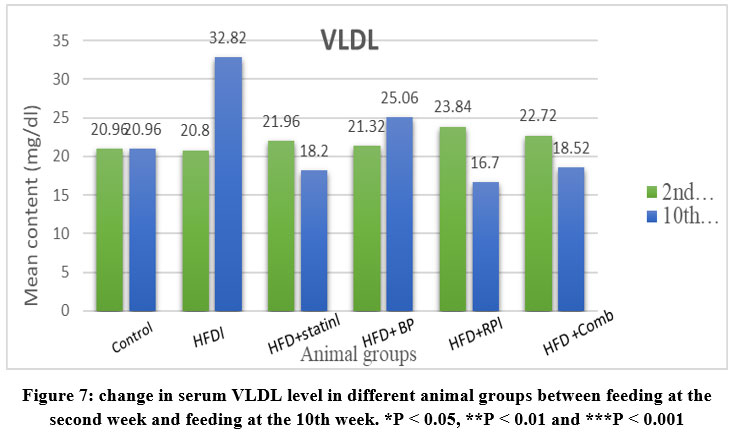 |
Figure 7: change in serum VLDL level in different animal groups between feeding at the second week and feeding at the 10th week. *P < 0.05, **P < 0.01 and ***P < 0.001 |
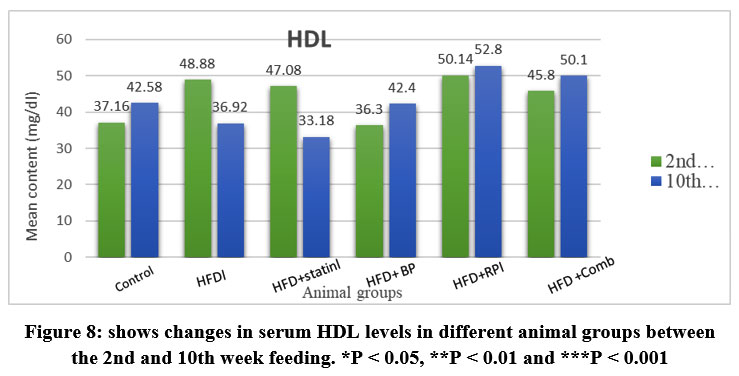 |
Figure 8: shows changes in serum HDL levels in different animal groups between the 2nd and 10th week feeding. *P < 0.05, **P < 0.01 and ***P < 0.001 |
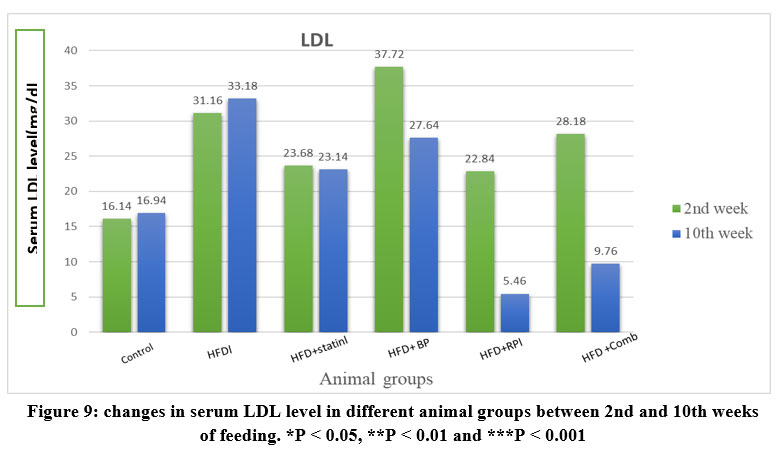 |
Figure 9: changes in serum LDL level in different animal groups between 2nd and 10th weeks of feeding. *P < 0.05, **P < 0.01 and ***P < 0.001 |
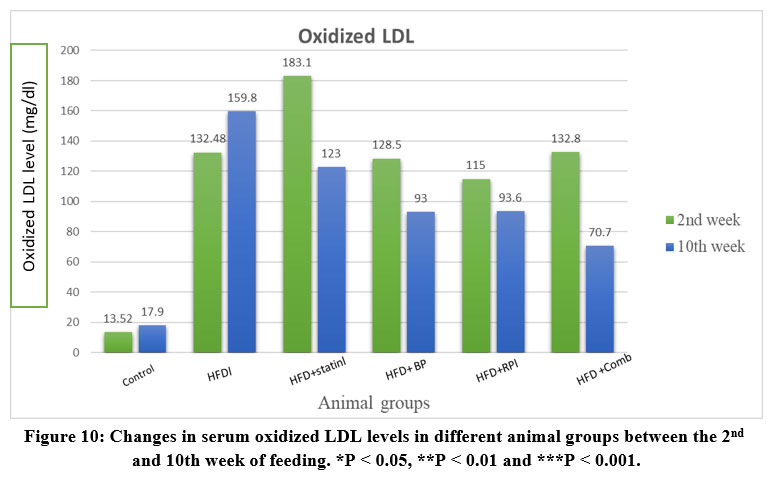 |
Figure 10: Changes in serum oxidized LDL levels in different animal groups between the 2nd and 10th week of feeding. *P < 0.05, **P < 0.01 and ***P < 0.001. |
There is a highly significant decrease in serum cholesterol and serum between the 2nd and 10th week of the feeding of the group (HFD + BR) group, (HFD + RP) group, and group (HFD + Combination) group (p < 0.01). Furthermore, there is a significant decrease in serum cholesterol between the second and tenth weeks of the feeding of the (HFD + statin) group (p<0.05), as shown in figure (5).
Although serum TG & serum VLDL were a highly significant decrease between the second week and 10th week of the feeding of the (HFD + RP) group (p< 0.001) & a significant decrease in serum levels (p< 0.05) between the second week and 10th week of feeding of the (HFD + combination) group (p < 0.01) as shown in figure (6) &figure (7) respectively.
The present study showed a significant increase in serum HDL between the 2nd week and the 10th week feeding of the group (HFD + BP) group and (HFD + statin) (p<0.05), as shown in figure (8).
Both serum LDL and serum oxidized LDL levels showed a highly significant decrease between the second week and 10th-week feeding of the group (HFD + RP) group (p< 0.001), while the (HFD+ combination) group showed a significant decrease in serum LDL between the second week and 10th-week feeding, in addition, the group (HFD + BP) group showed a significant decrease in serum oxidized LDL (p<0.05) as shown in figure (9) & (10) respectively.
Histopathological examination
The effects of the plant extract on the ultrastructure of liver tissue and the analysis of the surface area of the lipid droplets by microscopically examining the histopathological sections of liver tissue are shown in Figs. (11-16). In the control group, the hepatic lobular structure was intact and clear. There was a hepatic cord of arranged hepatocytes. In the cytoplasm, the endoplasmic reticulum (ER) was dense and clear, while in the hepatocytes, a few lipid droplets with a large number of mitochondria did not show swelling. (Fig.11). While in the HFD group, liver cells had partly necrosis, liver tissues were disordered, and there were a large number of lipid droplets but a small number of mitochondria in the cytoplasm. The mitochondria were swelling and few ER or glycogen granules were found in the liver cells. After treatment with pepper extract, liver tissues returned to normal status. In the cytoplasm, the lipid droplets reduced significantly, and the mitochondria were rich but still swelling. At the same time, the number of ER and glycogen granules in the cytoplasm increased clearly (Figs.12-16). The results suggested that the plant extract reduced fatty liver and lipid droplets, repaired liver damage caused by a high-fat diet, and increased the number of mitochondria and ER in the cytoplasm.
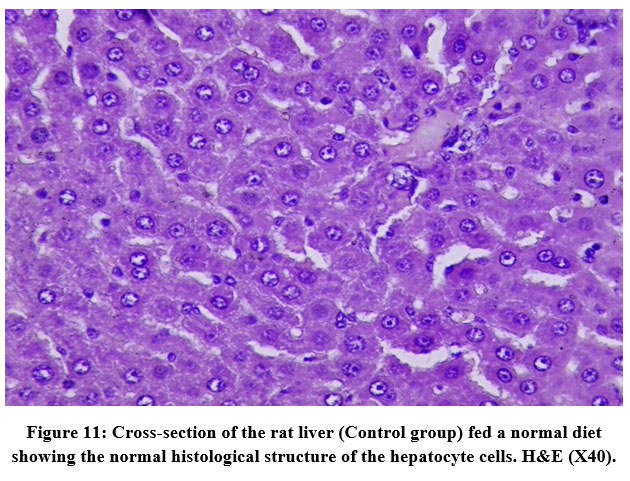 |
Figure 11: Cross-section of the rat liver (Control group) fed a normal diet showing the normal histological structure of the hepatocyte cells. H&E (X40). |
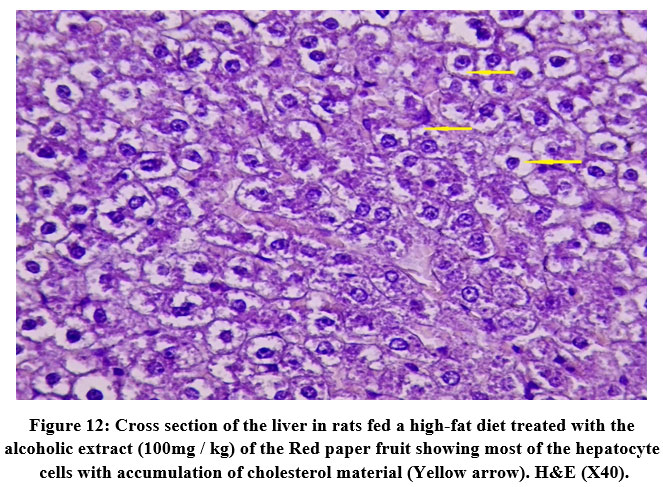 |
Figure 12: Cross section of the liver in rats fed a high-fat diet treated with the alcoholic extract (100mg / kg) of the Red paper fruit showing most of the hepatocyte cells with accumulation of cholesterol material (Yellow arrow). H&E (X40). |
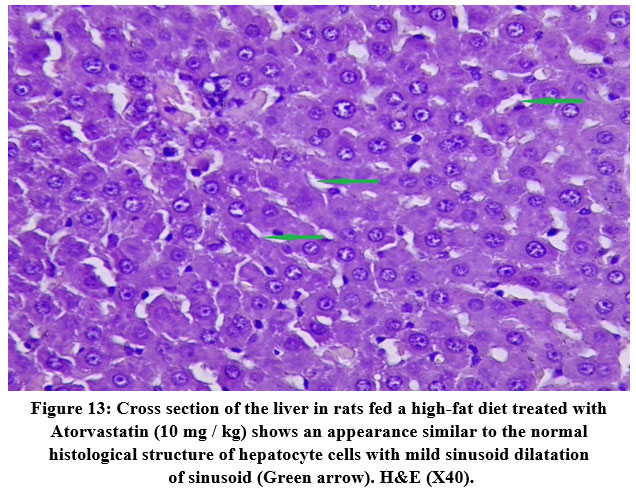 |
Figure 13: Cross section of the liver in rats fed a high-fat diet treated with Atorvastatin (10 mg / kg) shows an appearance similar to the normal histological structure of hepatocyte cells with mild sinusoid dilatation of sinusoid (Green arrow). H&E (X40). |
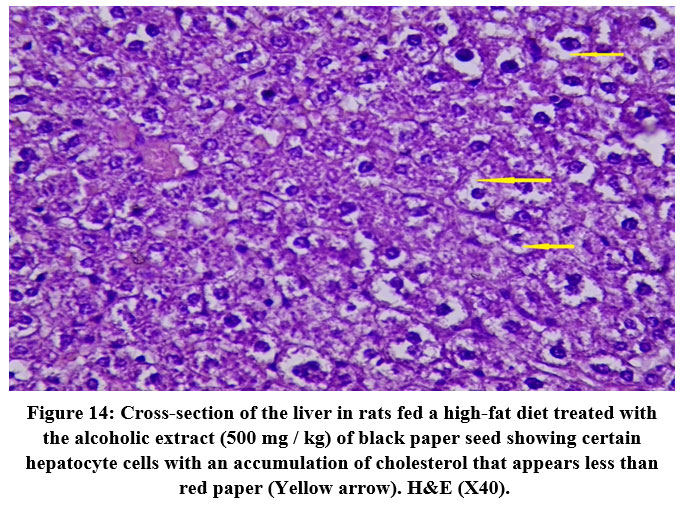 |
Figure 14: Cross-section of the liver in rats fed a high-fat diet treated with the alcoholic extract (500 mg / kg) of black paper seed showing certain hepatocyte cells with an accumulation of cholesterol that appears less than red paper (Yellow arrow). H&E (X40). |
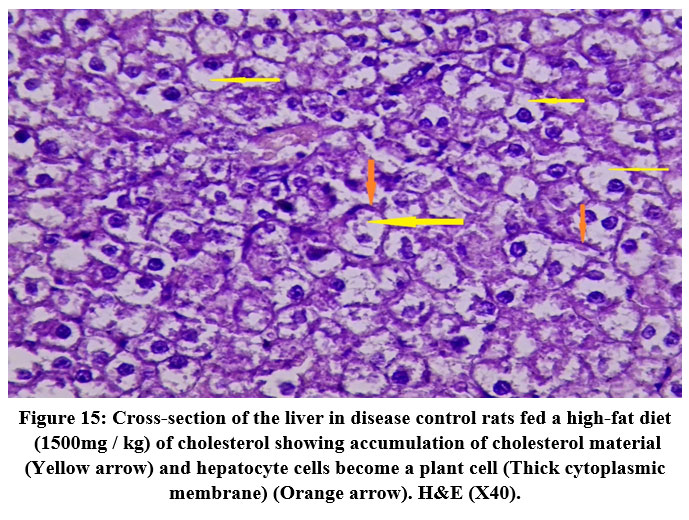 |
Figure 15: Cross-section of the liver in disease control rats fed a high-fat diet (1500mg / kg) of cholesterol showing accumulation of cholesterol material (Yellow arrow) and hepatocyte cells become a plant cell (Thick cytoplasmic membrane) (Orange arrow). H&E (X40). |
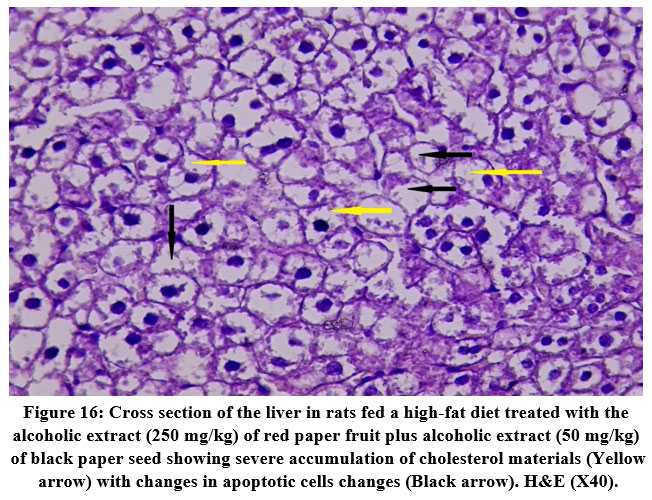 |
Figure 16: Cross section of the liver in rats fed a high-fat diet treated with the alcoholic extract (250 mg/kg) of red paper fruit plus alcoholic extract (50 mg/kg) of black paper seed showing severe accumulation of cholesterol materials (Yellow arrow) with changes in apoptotic cells changes (Black arrow). |
Discussion and Conclusion
Plant extract is usually a mixture of different classes of organic compounds soluble in the solvents used 11. Since many factors play an important role in the extraction of capsaicinoids and piperine in Capsicum and piper plants, such as the extraction method, its chemical nature, the size of the sample particles, the storage time, and the presence of impurities 12. The medicinal effects of chilies and peppers are related to different constituents such as capsaicin, fixed oil, thiamine, and others 13 which are responsible for a hot sensation in the tongue 14 and are used for the treatment of many disorders such as hyperlipidemia and obesity 15.
The main reason for dyslipidemia during the HFD period is that hepatic tissue increases TG formation by the conversion of glucose to FFA, then transported by the bloodstream as VLDL-C and stored as fat in adipose tissue. In experimental animal studies, long-term exposure to HFD resulted in hyperlipidemia, leading to increased visceral fat deposition by facilitating the development of a positive energy balance, leading to abdominal obesity 16.
According to the Hwan-Hee Jang et al. 2020 study, the first two weeks included in this study are considered an acclimatization period. Therefore, there were no significant differences in serum s.TG level s. VLDL, s. LDL s. cholesterol and s. oxidized LDL between the (HFD) group, and all other animal groups except the (HFD +BP) group showed a significant increase in s. cholesterol, compared to the HFD group (p < 0.05). HDL increased significantly in the group (HFD +statin) group only after the second week of feeding compared to the control group, as shown in table (1)17.
As shown in Table (2) of the present study, the effect of red pepper consumption on lipid profile after the 10th week of feeding was observed may be due to capsaicinoids, which are a group of pungent compounds found in chilies, contain capsaicin, dihydrocapsaicin, nor-dihydrocapsaicin, homodihydrocapsaicin, and homocapsaicin. Furthermore, the hypocholesterolemia effect of red pepper may be due to a combined effect of capsaicinoids with other phytochemicals such as vitamins (ascorbic acid, tocopherol, carotenoids) and phenolic compounds present in chili 18. A previous animal study demonstrating the hypolipidemic effect of red pepper in rats on a high-fat diet for 8 weeks showed a significant decrease in serum TG level 19.
Another two previous animal studies in Wistar rats showed a significant decrease in serum total cholesterol, TG, LDL-c, and significantly elevated serum HDL-c20-21.
Recently 2020, Al-Jumayi et al. The results of their study introduced scientific evidence that red chili pepper ethanol extract possesses antiobesity potentials and hypolipidemic effects through decreased levels of TG, total cholesterol, LDL, and VLDL with increased HDL levels and weight loss of high-fat dieted female albino Wistar rats16.
Furthermore, there was a highly significant decrease in serum cholesterol and serum between the 2nd and 10th weeks of the feeding of the group (HFD + BR) group, (HFD + RP) group, and group (HFD + Combination) group (p < 0.01). Furthermore, there is a significant decrease in serum cholesterol between the second and tenth weeks of the feeding of the (HFD + statin) group (p<0.05), as shown in figure (5).
The possible explanation for the hypolipidemic effect of capsaicin, which is the active component of red pepper, may be related to reduced intestinal absorption of cholesterol and increased excretion of cholesterol and bile acid in the feces or due to activation of the peroxisome proliferator-activated receptor α (PPARα) 22. It was also known that lecithin, one of the components of chili seeds, is a natural fat emulsifier that prevents it from settling in the arteries by keeping cholesterol suspended in the blood 23.
Another study revealed the efficacy of capsaicinoids in decreasing total plasma cholesterol and improving the lipid profile by decreasing cholesterol absorption and reducing aortic plaque under high-cholesterol-fed conditions 24
According to the results of the study mentioned in Table (2), the possible explanation for the hypolipidemic effect of pepper extracts is that the lipolytic enzymes and the up-regulated mRNA expressions increased significantly by Piperine. Additionally, the anti-obesity effect of Piperine is related to the regulation of lipogenic and lipolytic genes, which is more effective in visceral fat than in subcutaneous fat 25.
A previous study by Nogaraa L, Naberb N, Pate E, et al., 2016 concluded that pepper extracts suppressed the increase in plasma lipids that might result from inhibition of pancreatic lipase activity that reduced fat and cholesterol absorption 26.
As shown in Table (2) there is a highly significant decrease in the serum level of oxidized LDL of the (HFD +BP) (HFD + Combination of BP&RP) group compared to the HFD group.
Agbor et al. 2012 in their study had been reported that Piper species must prevent oxidation of LDL-c and enhance an antioxidant protection mechanism in the progression to prevent atherosclerosis in diet-fed hamsters. The phytochemicals, such as alkaloids, tannins, and polyphenols, which are the main constituents of Piper species, can be responsible for their therapeutic efficacy 21.
The present study showed a highly significant decrease in body weight of the animal groups compared to the HFD group, as shown in Table (5)
Due to the side effects of synthetic antioxidants and anti-obesity drugs, scientists are now focusing on natural products that produce similar effects to synthetic chemicals 27.
Possible mechanisms of the antiobesity effect of capsaicin by a reduction in body weight, induction of lipolysis in adipocytes, satiety, and reduction of energy and fat intake 28. In their study, Tremblay et al. 2018 reported that capsaicinoids accentuate the impact of caloric restriction on body weight loss; Capsaicin supplemented in diets attenuated increased hunger and decreased fullness, energy expenditure, and fat oxidation 23.
The previous study showed that capsaicin in C. annuum contributed to thermogenesis, increasing energy expenditure29. When capsaicin application was tested on 3T3-L1 adipocytes, it decreased intracellular lipid content and was involved in thermogenesis 30.
The possible explanation for the anti-obesity effect of Piperine is that the number of calories burned by muscle isolated from rabbits increased after adding Piperine to their diet. 31. The previous study explained another possible mechanism of the antiobesity effect of Piperine by preventing and slowing fat cell production 32.
Enzymes, in general, are the most important suitable diagnostic tools for tissue damage, and their levels alter in the bloodstream under diseased conditions. Many reports showed that the effect of HFD on liver damage in rats could be diagnosed by elevated AST, ALT, and ALP activities in blood during liver damage 33.
Sharma et al.,2012 showed a reduction in AST, ALT and ALP activities compared to the HFD control group, which could diminish the hepatotoxic effect caused by HFD-induced obesity 28.
Preclinical studies showed a direct correlation between a high-fat diet and overweight and obesity among different animal groups 34, 35. But these studies do not often discuss the relationship between overweight and obesity caused by a high-fat diet on kidney function, which is an important aspect of such studies. Ridwan R et al. 2019 observed the alteration in renal cellular morphology caused by a high-fat diet that induced overweight and obesity without any changes in blood levels of urea and creatinine 32.
The previous study showed that red chili pepper did not cause significant changes in the functional biochemical parameters of the liver and kidney. However, excessive consumption of red pepper can induce liver and kidney damage that can be diagnosed by histological examination of both 36.
In conclusion, the (HFD + RP) group and the (HFD + Combination) group showed the best hypolipidemic and antiobesity effects compared to the HFD group after 10 weeks of feeding. After observing the ultrastructure of liver tissue, lipid droplets were significantly reduced after treatment with pepper extracts, and the number of ER in the cytoplasm increased. These results suggested that the pepper extract exerted hypolipidemic effects and may have a protective effect against atherosclerosis, similar to a statin, the positive drug. Furthermore, after 10 weeks of gavage, the weight gain of the treated group was significantly lower than that of the HFD group, indicating that pepper extracts may have anti-obesity effects.
Conflict of Interest
There are no conflict of interest.
References
- Mohammed A. Taher, Dhuha A. Abdul- Hussain, Huda F. Hasan et , Hypolipidemic Effect of Caffeic Acid Isolated From Arctium Lappa Cultivated In Iraq, in Hyperlipidemic Rat Model, Iraqi J Pharm Sci, 2015; 24(1): 18-24.
- Bao L., Bai S. & Borijihan G., Hypolipidemic effects of a new piperine derivative GB-N from Piper longum in high-fat diet-fed rats, Pharmaceutical Biology, 2012; 50(8): 962-967.
- Abdel Magied M., Salama N., Ali M., Hypoglycemic and Hypocholesterolemia Effects of Intragastric Administration of Dried Red Chili Pepper (Capsicum Annum) in Alloxan-Induced Diabetic Male Albino Rats Fed with High-Fat-Diet, Journal of Food and Nutrition Research, 2014; 2(11): 850-856.
- Keharom, S., Techawongstien, S., Mahachai, R., & Chanthai, S. (2015). Analysis of Capsaicin and dihydrocapsaicin from sweet-to-very hot chilli peppers using an ultrasound-assisted extraction followed by RP-HPLC-PDA. Asia-Pacific Journal of Science and Technology, 2015; 20(1): 54–65.
- Dua Y., Chenb Y., Fuc X., et al, Effects of Piperine on lipid metabolism in high-fat diet-induced obese mice, Journal of Functional Foods.jff., 2020; 71(32): 104011.
- Muhammad Aleem Abbas, Naila Boby, Eon-Bee Lee, et al. Anti-Obesity Effects of Ecklonia cavaExtract in High-Fat Diet-Induced Obese Rats. Antioxidants, 2022; 11(2):310.
- Jolayemi AT, Ojewole JAO. Comparative anti-inflammatory properties of Capsaicin and ethyl acetate extract of Capsicum frutescens linn [Solanaceae] in rats, African Health Sciences 2013; 13(2): 357 – 361.
- Juangsamoot, J., Ruangviriyachai, C., Techawongstien, S., et al. Determination of Capsaicin and dihydrocapsaicin in some hot chili varieties by RP-HPLC-PDA after magnetic stirring extraction and clean up with C18 cartridge, International Food Research Journal, (2012); 9 (3): 1217-1226.
- Setareh Sanati , Bibi Marjan Razavi , Hossein Hosseinzadeh. A review of the effects of Capsicum annuum L. and its constituent, Capsaicin, in metabolic syndrome. Iran J Basic Med Sci, 2018; 21(5).
- Otunola G, Oloyede O, Oladiji A, et al. Hypolipidemic effect of aqueous extracts of selected spices and their mixture on diet-induced hypercholesterolemia in Wistar rats. Can J Pure Appl Sci.2012; 6:2063–2071.
- Sridhara Babu , M.Guravaiah, . Hatti and K.Srikanth. Qualitative Analysis of Capsaicin from chilies and chili powder by HPLC method. Int.J.Curr.Res. Chem.Pharma.Sci., 2014; 1(6):184-194.
- Ana Garceä S-Claver, Mariäa S. Arnedo-Andreä S, et al, Determination of Capsaicin and Dihydrocapsaicin in Capsicum Fruits by Liquid Chromatography−Electrospray/Time-of-Flight Mass Spectrometry, Agric. Food Chem. 2006, 54, 9303−9311
- Zhang, L, Zhou, M, Fang, G, et al. Hypocholesterolemia effect of capsaicinoids by increased bile acids excretion in ovariectomized rats. Mol Nutr Food Res, 2013; 57: 1080–1088.
- Manjunatha H, Srinivasan K. Hypolipidemic and antioxidant effects of dietary curcumin and Capsaicin in induced hypercholesterolemic rats. Lipids. 2007; 42:1133–1142.
- Pande S, Srinivasan K. Potentiation of hypolipidemic and weight-reducing influence of dietary tender cluster bean (Cyamopsis tetragonoloba) when combined with Capsaicin in high-fat-fed rats. J Agric Food Chem. 2012; 60:8155–8162.
- Al-Jumayi, H. A., Elhendy, H. A. & Darwish, A. M. Biological effects of red chili pepper (Capsicum annuum) consumption on high-fat diet female Albino Rats. Pak. J. Biol. Sci. PJBS 2020; 23: 150–158.
- .Hwan-Hee Jang , Jounghee Lee, Sung-Hyen Lee , Young-Min Lee, Effects of Capsicum annuum supplementation on the components of metabolic syndrome: a systematic review and meta-analysis. Sci Rep. 2020; 10(1):20912.
- Badia, A.D.; Spina, A.A.; Vassalotti, G. Capsicum annuum L.: An Overview of Biological Activities and Potential Nutraceutical Properties in Humans and Animals. J. Nutr. Ecol. Food Res. 2017; 4: 167–177.
- Srinivasan, K. Biological activities of red pepper (Capsicum annuum) and its pungent principal Capsaicin: A review. Crit. Rev. Food Sci. Nutr. 2016; 56: 1488–1500.
- Yafang Du, Yuzhong Chen, Xiaoya Fu, et al. Effects of Piperine on lipid metabolism in high-fat diet-induced obese mice. Journal of Functional Foods, 2020; 71: 104011.
- Yongqi G, Guanzhong W, Xin S, et al. Antiobesity action of a daidzein derivative on male obese mice induced by a high-fat diet. Nutr Res 2009; 29:656–63.
- Agbor GA, Luli A, Julianne S. Piper species protect the cardiac, hepatic, and renal antioxidant status of atherogenic diet-fed hamsters. Food Chem 2012; 134:1354–9.
- Zhang R., Humphreys I., Sahu R. et al.In vitro and in vivo induction of apoptosis by Capsaicin in pancreatic cancer cells is mediated through ROS generation and mitochondrial death pathway. Apoptosis, 2008; 13(12), 1465–1478.
- Tremblay, Arguin, and Panahi. Capsaicinoids a spicy solution to the management of Obesity, Int.J .Obes, 2018; 40:1198-1204.
- Brito, J.P.; Ramada, M.H.; de Magalhães, M.T. et al. Peptaibols from Trichoderma asperellum TR356 strain isolated from Brazilian soil. Springer Plus 2014; 3: 600.
- Nogaraa L, Naberb N, Pate E et al . Piperine’s mitigation of obesity and diabetes can be explained by its up-regulation of the metabolic rate of resting muscle. PNAS, 2016; 113: 13009-13014.
- Hyun Park Ui , Jeong HS ,Young JoE . Piperine, a Component of Black Pepper, Inhibits Adipogenesis by Antagonizing PPARγ Activity in 3T3-L1 cells. J. Agric. Food Chem. 2012; 60, 3853–3860.
- Seoyoon C, Youngshim C, Yeji C. Piperine reverses high fat diet-induced hepatic steatosis and insulin resistance in mice. Food Chem .2013; 141:3627–35.
- Sharma AK, Bharti S, Bhatia J. Sesamol alleviates diet-induced cardiometabolic syndrome in rats via upregulating PPARγ, PPARα, and e-NOS. J Nutr Biochem .2012; 23:1482–9.
- Al-Kuraishy HM, Al-Hussaniy HA, Al-Gareeb AI, et al. Combination of Panax ginseng C. A. Mey and Febuxostat Boasted Cardioprotective Effects Against Doxorubicin-Induced Acute Cardiotoxicity in Rats. Front Pharmacol. 2022;13:905828. DOI:10.3389/fphar.2022.905828
- Garcia IJP, Cézar JS, Lemos BS et al. Effects of high-fat diet on kidney lipid content and the Na, K-ATPase activity. Braz. J. Pharm. Sci. 2018; 54(1): e17165
- Ridwan R, Nazir R, Rasyid H et al. Decreased Renal Function Induced by High-Fat Diet in Wistar Rat: The Role of Plasma Angiotensin-Converting Enzyme 2 (ACE2) . Biomedical & Pharmacology Journal, 2019; 12: 1279-1287
- Zhang W, Zheng Q, Song M, et al. A review on the bioavailability, bio-efficacies and novel delivery systems for Piperine. Food Funct. 2021; 12(19):8867-8881.
- Crescenzo R, Bianco F, Mazzoli A, et al. Fat quality influences the obesogenic effect of high fat diets. Nutrients. 2015; 7(11):9475-9491.
- El-Zein O, Usta J, El Moussawi L, Kreydiyyeh SI. Leptin inhibits the Na (+) /K(+) ATPase in Caco-2 cells via PKC and p38MAPK. Cell Signal. 2015; 27(3):416-423.
- Guyton, AC., and Hall, J.E.14ed 2021: Lipid metabolism, in Textbook of Medical Physiology, W.B. Saunders Company, Philadelphia, 873 pp.

