
Gurprit Grover and Anurag Sharma*
Department of Statistics, University of Delhi, Delhi- 110007, India
Corresponding Author E-mail : anuragsharma532@gmail.com
DOI : https://dx.doi.org/10.13005/bpj/1932
Abstract
A number of techniques have been developed for variable reduction in the survival analysis. However, none of those techniques take into consideration the correlation among the predictors. This paper focuses on the reducing the number of predictors using the concept of partial correlation/ association and then estimating the survival time of HIV/ AIDS patients while. Partial correlation is preferred over pairwise correlation & multiple correlation as pairwise correlation takes into account only the linear relationship between two predictors at a time and multiple correlation may give misleading results if one variable is numerically related to other variable and both the variables again are taken simultaneously to find the association/ correlation. This can be avoided by controlling the confounding variable using partial correlation coefficient. Partial correlation is used to assess the correlation between a continuous predictor and a categorical predictor when the controlling variable is also categorical. ANCOVA is used to determine the association between two categorical predictors when the controlling variable is also categorical. AFT models are used to estimate survival times with/ without reduction in the number of predictors. It is observed that the estimated survival times are not affected by the reduction of predictors from 11 to 4. Also, the estimates obtained by the new proposed technique are found to be more efficient than the existing methods.
Keywords
AIDS; AFT; ANCOVA; HIV
Download this article as:| Copy the following to cite this article: Grover Gurprit, Sharma A. Estimation of Survival Time of HIV/ AIDS s While Reducing the Number of Predictors Using a Partial Correlation/ Association Technique. Biomed Pharmacol J 2020;13(2). |
| Copy the following to cite this URL: Grover Gurprit, Sharma A. Estimation of Survival Time of HIV/ AIDS s While Reducing the Number of Predictors Using a Partial Correlation/ Association Technique. Biomed Pharmacol J 2020;13(2). Available from: https://bit.ly/2ApaqVW |
Introduction
Presently, Human Immuno deficiency virus (HIV) has been assumed to have a measure of an international epidemic [1, 2] and it’s notably most striking in Asia [3]. Worldwide about 36 Million persons have been estimated to be infected with HIV. It has also resulted in death of 1.2 million people globally [4]. Of all HIV infected people, 90% live in developing countries [1]. India has third largest HIV epidemic in the world. In India, 2.5 million individuals were estimated to have been living with HIV infection till 2014 [4]. All the above mentioned figures designate the enormous measure of HIV and as a result validate a crucial requirement to conduct a depth research of the calamity of various prognostic factors to which the HIV patients are left unprotected to.
Anti-retroviral therapy (ART) plays a crucial role in treating the patients infected with HIV/AIDS. It has the capability to reduce mortality as well as morbidity rates among HIV patients, and as a result help in improving the life quality of patients. This treatment (ART) has been available freely for patients since 2004 in India. At ART clinics, HIV patients have access to nutritional advice, testing and counselling (HTC) by experts. They are needed to go through a CD4 count test half yearly [5]. Moreover, the government is also rolling out several campaigns to aware people about their appointments to increase the overall attendance [6].
With the use of ART and vast improvements in preventive facilities , HIV epidemic in India has slowed down considerably with a 19% reduction in new HIV infections (130,000 in 2013), and a reduction of 38% in deaths contributed by AIDS between 2005 and 2013 [4]. By the end of 2013, more than 700,000 people were receiving ART which is a great achievement in itself considering that it is the second largest number of people on treatment in any single country.
To check the intensity of HIV virus in the AIDS patients, one of the most important predictors is the CD4 cell counts. A healthy person is estimated to have 1200 CD4 cells per mm3 in blood. CD4 cells are deteriorated as immune system is attacked by HIV virus.
Center for Disease Control (CDC) recommended initiating Anti-retroviral therapy (ART) when the CD4 cells goes down 200 cells per . and Various observational studies and Two randomized controlled trials (RCTs) showed that initiation of ART at CD4 < 350 cells/mm3 results in significantly reduction of disease progression, mortality and the incidence of opportunistic diseases, especially TB and non-AIDS-defining conditions [6].
Various studies have been proposed to estimate the survival and effects of underlying covariates on the survival among HIV patients by using Cox PH model (Ghate et al., 2011 [7]; Rai et al., 2013 [8]; Kee et al., 2009 [9]; Jerene et al., 2006) [10]. Markus Abigo Erango. (2017) predicted and compared the survival time of HIV/AIDS patients in three hospitals in Ethiopia. Three parametric accelerated failure time distributions: lognormal, log logistic and Weibull are used to analyze, predict and compare survival probabilities of the patients. The results indicated that the empirical hazard rates of the three data sets reveal maximal peaks [11]. Jaya Chakravarty et al. (2013) analyzed the factors affecting the survival of patients under routine programme conditions in an ART centre in India five years after its initiation. She found poor survival in the first half year of therapy mainly in patients with severe immunosuppression. Thus, she emphasized the requirement for early enrolment into the programme [12]. Performance of Cox Proportional Hazard Model and the Accelerated Failure Time Model was compared by Derek Ngbandor Nawumbeni et al. (2014) using HIV/TB Co-infection Survival data. They concluded that the Accelerated Failure Time model has better predictive power as compared to the Cox model. [13]. Emeka E. Orisakwe et al., (2012) determined whether knowledge of HIV and the attitude of patients referred for HCT correlated with a willingness to test for HIV. [14]. Colins Kingoum Nubed (2016) assessed the KAPs of senior secondary school students in Fako Division, Cameroon, on HIV/AIDS. This cross-sectional study was conducted on 464 students between 13 to 25 years of age. Participants were selected by systematic quota random sampling from secondary schools in Fako, from April to June 2014 [15]. Hanhui Ye et al., (2016) conducted an analysis to analyze the correlation between AIDS restriction and metabolic pathway gene expression. They showed that HIV-1 postentry cellular viral from AIDS restriction genes can be coexpressed in human transcriptome microarray datasets [16].Grover and Swain (2013) tried to estimate the survival time of HIV/ AIDS patients who underwent Antiretroviral Therapy in Delhi. They used Non- Parametric Maximum Likelihood Estimation method (NPMLE) for interval censored data and KM survival time for left, right and mid-point imputation to estimate the survival of these patients [17]. Richard Hafner et. al (1999) studied the linear relationship between Mycobacterium avium complex (MAC) infection of blood and bone marrow in human immunodeficiency virus—infected patients before and during treatment [18]. Sergio Rueda (2016) conducted a systematic review and
series of meta-analyses on the association between HIV related stigma and health among people living with HIV. They conducted a structured search on 6 electronic databases for journal articles reporting associations between HIV-related stigma and health related outcomes published between 1996 and 2013. [19]. Ravi et al (2018) determined highly positively correlated predictors and reduced the number of predictors using pairwise correlation / association and then estimated the survival time patients on ART [20].Grover G et al. (2018) examined the effect of reduction of predictors affecting the survival of patients using a multiple correlation/technique. They observed that the estimated survival times are not affected by the reduction of predictors from 11 to 4 [21].
In this paper, we have proposed a partial correlation/association screening procedure for reducing the number of predictors to be included in the model without affecting the estimated survival time and also resulting in lower Standard error. So, this research paper aims at
Estimating the survival time of patients on ART by taking all the prognostic factors by using AFTM;
Determining the significantly partially correlated/associated predictors in the model by using suitable technique;
Determining the effect of partially correlated predictors on the survival time of HIV/AIDS patients under ART;
Estimating the survival times of HIV/AIDS patients on ART in the presence of reduced number of predictors
Compare the two models (One having all the available prognostic factors and other with the reduced number of prognostic factors) on the basis of their AIC values.
Comparing the proposed method with the methods discussed in [20] and [21] and existing variable reduction methods [22], [23].
We have used SPSS and R software to fit the models and to compute the associations/correlations among predictors.
Methods and Materials
Methods Used
Assuming that number of HIV/AIDS patients under ART as and survival time of patient as with survival function . Then assuming a linear relationship between and predictors, we have
![]()
Where
βois the intercept
βi are the coefficients of “p”explanatory variables for ith patient.
σ is the scale parameter
εi is a random variable used to model the deviation of values of loge (Ti) from the linear part of model.
It may be possible that two or more predictors are associated with a single predictor; we can replace these predictors with a single predictor with which they are associated. However, it may be possible that this correlation will give misleading results if one variable is numerically related to other variable and both the variables are taken simultaneously to find the association/ correlation. This bias can be avoided by controlling the confounding variable which is done by partial correlation. Partial correlation helps in measuring the strength of a relationship between two variables when controlling the effect of other variables. As a result, we can reduce the number of predictors included in the original model by excluding any spurious predictor which will lead in estimating the survival time of HIV/AIDS patients by AFTM.
ANCOVA is used to test the association between two categorical predictors with the controlling variable being also categorical predictor.
To test the independence among two categorical predictors while the controlling predictor is also categorical, ANCOVA is used and then on the basis of p- value, we rejected or accepted null hypothesis that these variables are partially independent or not.
Model Comparison
Akaike’s Information Criteria (AIC) is used to compare the different models where AIC is given by :-
![]()
where k be the number of estimated parameters in the model and be the maximum value of the likelihood function for the model. The model with smaller value of AIC can be considered as a better model compared to other models under consideration.
Data Sources and Results
Data of 767 HIV/AIDS patients undergoing ART in Dr. Ram Manohar Lohia Hospital, New Delhi, India, during the period of January 2004 to December 2014 were collected in this retrospective follow-up study and an Accelerated Failure time model, taking all the possible predictors, is fitted. Different AFT models are fitted to determine the best fitted model. Logistic model is found to be the best model. Results are shown in Table 1 and 2 below:-
Table 1: Log- Likelihood to compare different AFT models
| Distribution | Log- Likelihood | Degrees of Freedom |
| Exponential | -1086.9 | 18 |
| Weibull | -798.3 | 18 |
| Log- Normal | -918 | 18 |
| Logistic | -662.7 | 18 |
| Log- logistic | -836 | 18 |
Table 2: Akaike Information Criterion (AIC) values for AFT models
|
Distribution |
Log-Likelihood |
DF | C |
AIC |
| Exponential | -1086.9 | 18 | 1 | 2210.4 |
| Weibull | -798.3 | 18 | 2 | 1636.6 |
| Log- Normal | -918 | 18 | 2 | 1876 |
| Logistic | -662.7 | 18 | 2 | 1349.4 |
| Log- Logistic | -836 | 18 | 2 |
1712 |
Two statistical criterion (likelihood ratio test and AIC) are used to compare these models. Gamma model nested exponential model, the Weibull model and the log-normal model (Table 1).
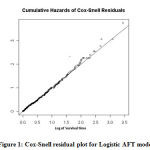 |
Figure 1: Cox-Snell residual plot for Logistic AFT model |
It is observed that the AIC for logistic model in the presence of all predictors is least among all the fitted models. Also, LR test showed that the logistic model fits best as compared to other models (Table1). Also, Cox-Snell residual fits good to the Logistic Accelerated Failure Time model (Figure 1).So, we fit the survival data using Logistic AFT model and results are shown in the table 3 below:-
Table 3: Results of Logistic AFTM model for HIV/ AIDS patients
| Predictors | Std. Error | TR | 95% C.I | |
| Age | -0.0118 | 0.00804 | 0.98827 | (1.30, 3.98) |
| Male | 1 | |||
| Female | -0.7025 | 0.34583 | 0.49536 | (-0.027 ,0.003) |
| Eunuch | -1.0992 | 0.00000 | 0.333142 | (-1.099, 0.065) |
| North India | 1 | |||
| Central India | 6.8151 | 0.00000 | 1.513 | (6.815, 7.086) |
| East India | 0.1864 | 0.77448 | 1.204925 | (-1.331 ,1.704) |
| Smoking- Yes | 1 | |||
| Smoking- No | 0.1252 | 0.22841 | 1.133381 | (-0.322, 0.572) |
| ALCOHOL- Yes | 1 | |||
| ALCOHOL- No | 0.1433 | 0.16252 | 1.154103 | (-0.175,0.461) |
| DRUGS- Never | 1 | |||
| DRUGS- Past | 5.8478 | 0.18161 | 1.474 | (5.491, 6.203) |
| DRUGS- Yes | 0.7756 | 1.0675 | 0.571879 | (-1.295,2.847) |
| Opportunistic Infection- Viral | 1 | |||
| Opportunistic Infection- Bacterial | -0.6424 | 0.14163 | 0.526036 | (-0.919,-0.365) |
| Opportunistic Infection- Fungal | 0.6009 | 0.26871 | 1.823728 | (0.074,1.127) |
| Urban | 1 | |||
| Rural | -0.5271 | 0.18308 | 0.59031 | (-0.885,-0.168) |
| Government Employee | 1 | |||
| Non- Working | 0.5102 | 0.35621 | 1.665702 | (-0.187,1.208) |
| Agricultural Labor | 0.1055 | 0.18550 | 1.111221 | (-0.258,0.469) |
| Regular Employee | 0.529 | 0.21158 | 1.697212 | (0.114,0.943) |
| Business Man | -0.5673 | 0.32049 | 0.56704 | (-1.195,0.060) |
| Un Married | 1 | |||
| Married | 0.3221 | 0.54588 | 1.379957 | (-0.747 ,1.391) |
| Spouse- Positive | 1 |
From the results of the table 3, males are supposed to have longer survival time than females and Eunuchs as the time ratio for both of these genders are less than 1 (0.495 for females and 0.333 for eunuchs). Similarly, patients living in North India are expected to have shorter survival time than the patients living in Central and East India as their time ratios are greater than 1. Again, patients who were smokers or were alcoholic are observed to have shorter survival time than the ones who never smoked or non- alcoholic in their lives. Unmarried patients are expected to have shorter survival patients than the married patients. Patients who have bacterial infection are observed to have shorter survival time than the patients who have viral infection where those having fungal infection have longer survival time than the ones who have viral infection. Patients living in rural areas are expected to have shorter survival time than the ones who live in urban areas.
Then, in the first step, we have tried to determine the predictors which are jointly associated/ correlated with each other. We have used MANOVA to test the joint independence among two or more continuous and two or more categorical predictors and Log- linear models are used to test the joint independence among categorical predictors only. Predictors which are found to be jointly significantly correlated/ associated are listed below in the Table 4 below:-
Table 4: Result of the tests of the joint dependence among significantly associated/ correlated pairs of predictors
| Predictor | Jointly dependent predictors | Model used | p- value |
| Age | Sex, Alcohol, Occupation and Spouse | MANOVA | 0.015 |
| Sex | Opportunistic infection, Marital Status and Spouse | Log- linear | 0.000 |
| Smoking | Alcohol, living Status, Occupation and Opportunistic infection | Log- linear | 0.000 |
| Drugs | Occupation and Spouse | Log- linear | 0.000 |
Since p-value for each group is less than 0.05, alternative hypothesis can be accepted and can be concluded that these predictors are jointly dependent. After this partial correlation/ association between each possible pair are determined using suitable methods. The results are shown in the Table 5 below. The italic values are p- values and bold values are the significant values of correlation (Correlation coefficient > .50 and p- values less than 0.05).
Table 5: Significant values of Correlation and p- values for partial correlation/ association
| Controlling variable | Variables | Correlation coefficient or p- value |
| Spouse | Age, Sex | -0.109 |
| Spouse | Age. Alcohol | 0.045 |
| Spouse | Age, Occupation | 0.141 |
| Spouse | Sex, Alcohol | 0.502 |
| Spouse | Sex, Occupation | -0.152 |
| Spouse | Alcohol, Occupation | 0.93 |
| Marital Status | Sex, Opportunistic Infections | 0.000 |
| Sex | Age, Alcohol | -0.019 |
| Sex | Age, Occupation | 0.135 |
| Sex | Age, Spouse | -0.170 |
| Sex | Alcohol, Occupation | 0.56 |
| Sex | Alcohol, Spouse | 0.51 |
| Sex | Spouse, Occupation | -0.059 |
| Alcohol | Age, Occupation | 0.157 |
| Alcohol | Age, Spouse | -0.216 |
| Alcohol | Age, Sex | 0.68 |
| Alcohol | Spouse, Occupation | -0.11 |
| Alcohol | Sex, Occupation | 0.53 |
| Alcohol | Spouse, Sex | 0.35 |
| Occupation | Age, Spouse | -0.209 |
| Occupation | Age, Sex | -0.158 |
| Occupation | Age, Alcohol | 0.62 |
| Occupation | Spouse, Sex | 0.69 |
| Occupation | Spouse, Alcohol | -0.147 |
| Occupation | Sex, alcohol | 0.510 |
| Spouse | Sex, Opportunistic Infections | 0.000 |
| Opportunistic Infections | Sex, Spouse | 0.000 |
| Opportunistic Infections | Sex, Marital Status | 0.51 |
| Spouse | Sex, Marital Status | 0.000 |
| Marital Status | Sex, Spouse | 0.000 |
| Opportunistic Infections | Sex, Spouse | 0.000 |
| Opportunistic Infections | Marital Status, Spouse | 0.66 |
| Spouse | Marital Status, Opportunistic Infections | 0.810 |
| Marital Status | Spouse, Opportunistic Infections | 0.207 |
| Occupation | Smoking, Living Status | 0.000 |
| Occupation | Smoking, Alcohol Status | 0.000 |
| Occupation | Smoking, Opportunistic Infections | 0.004 |
| Alcohol | Smoking, Opportunistic Infections | 0.000 |
| Alcohol | Smoking, Occupations | 0.000 |
| Alcohol | Smoking, Living status | 0.610 |
| Opportunistic Infections | Smoking, Living status | 0.000 |
| Opportunistic Infections | Smoking, Alcohol | 0.06 |
| Opportunistic Infections | Smoking, Living Status | 0.243 |
| Opportunistic Infections | Smoking, Occupations | 0.000 |
| Living Status | Smoking, Occupations | 0.083 |
| Living Status | Smoking, Opportunistic Infections | 0.000 |
| Living Status | Smoking, Alcohol | 0.753 |
| Living Status | Alcohol, Opportunistic Infections | 0.000 |
| Living Status | Alcohol, Occupations | 0.040 |
| Occupation | Living Status, Opportunistic Infections | 0.000 |
| Spouse | Drugs, Occupations | 0.159 |
Using this procedure, 4 predictors are selected. In the next step, survival times are estimated using AFTM with only these selected predictors. Again, for this model, Logistic model is found to be the best AFT model by LR test and AIC values. Again, Cox-Snell residual was plotted and it fits well as shown in figure 2. Results are presented below in Table 6:-
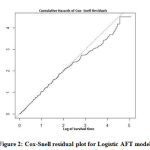 |
Figure 2: Cox-Snell residual plot for Logistic AFT model |
Table 6: Results of modified Logistic AFTM model for HIV/ AIDS patients
| Predictors | Std. Error | TR | 95% C.I | |
| Age | -0.00818 | 0.00796 | 0.9918568 | -0.0242,0.008 |
| DRUGS- Never | 1 | |||
| DRUGS- Past | 6.26359 | 0.16436 | 0.0980558 | |
| DRUGS- Yes | 0.96137 | 1.05338 | 0.6152831 | -1.240,3.163 |
| Male | 1 | |||
| Female | -1.76615 | 0.1548 | 0.1709898 | -2.0695,-1.462 |
| Eunuch | -1.62039 | 0.0125 | 0.1978218 | -1.620,0.624 |
| Smoking- Yes | 1 | |||
| Smoking- No | 0.3776 | 0.19208 | 1.4587837 | -0.077,0.832 |
To compare the proposed method with the existing ones, variables are also selected using LASSO and elastic-net variable selection methods. LASSO method selected Six variables, viz, Age, Occupation, Opportunistic Infections, State, Sex and drugs whereas Elastic- net method selects Age, Alcohol status, Smoking Status, Spouse, and Occupation. Also, the standard errors of the coefficients of predictors in the models fitted by different methods are compared. It is observed that the standard error of the coefficients chosen by the proposed method is less than the standard error of the coefficients in the true model and with the standard errors of the coefficients chosen by LASSO and Elastic- net methods as shown in the Table 7 below:-
Table 7: Comparison of the Standard Error of the coefficients of the predictors selected using different variable selection methods
| Predictors | S.E (True model) | S.E (Proposed Method) | S.E (LASSO Method) | S.E (Net- Elastic Method) | S.E (Pairwise Correlation technique) | S.E (Multiple Correlation technique) |
| Age | 0.00804 | 0.00796 | 0.00799 | 0.00801 | 0.00796 | 0.00708 |
| Male | ||||||
| Female | 0.34583 | 0.1548 | 0.32554 | 0.33493 | ||
| Eunuch | 0 | 0.0125 | 0 | 0 | ||
| North India | ||||||
| Central India | 0 | -0.001 | ||||
| East India | 0.77448 | 0.75256 | ||||
| Smoking- Yes | ||||||
| Smoking- No | 0.22841 | 0.19208 | 0.20144 | 0.21578 | ||
| ALCOHOL- Yes | ||||||
| ALCOHOL- No | 0.16252 | 0.12564 | ||||
| DRUGS- Never | ||||||
| DRUGS- Past | 0.18161 | 0.16436 | 0.17512 | 0.16881 | 0.16728 | |
| DRUGS- Yes | 1.0675 | 1.05338 | 1.06114 | 1.05695 | 1.03011 | |
| Opportunistic Infection- Viral | ||||||
| Opportunistic Infection- Bacterial | 0.14163 | 0.14256 | 0.14144 | |||
| Opportunistic Infection- Fungal | 0.26871 | 0.16852 | 0.26792 | |||
| Urban | ||||||
| Rural | 0.18308 | 0.18111 | ||||
| Government Employee | ||||||
| Non- Working | 0.35621 | 0.1725 | 0.25879 | 0.1747 | 0.16578 | |
| Agricultural Labor | 0.1855 | 0.1810 | 0.1829 | 0.1829 | 0.17885 | |
| Regular Employee | 0.21158 | 0.22147 | 0.22346 | 0.21123 | 0.20152 | |
| Business Man | 0.32049 | 0.32247 | 0.31862 | 0.31784 | 0.30557 | |
| Un Married | ||||||
| Married | 0.54588 | |||||
| Spouse- Positive | ||||||
| Spouse- Negative | 0.14234 | 0.13596 |
From table 8, it can be observed that AIC value is least for proposed method when compared with the AIC values for True, LASSO and Elastic- Net models and the methods discussed in [20] and [21].
Table 8: Comparison of proposed and existing variable selection methods on basis of AIC values
| Model | No. of predictors | AIC |
| True | 11 | 1349.4 |
| Proposed Method | 4 | 1295.2 |
| LASSO method | 6 | 1320.8 |
| Net-Elastic method | 5 | 1325.6 |
| Pairwise Correlation technique | 5 | 1316.4 |
| Multiple Correlation technique | 4 | 1313.2 |
Data of 767 patients diagnosed with HIV/ AIDS were collected in this analysis. The AFT modelling of the survival rates of patients from the prognostic factors selected Logistic as the best fitted model based on AIC. The Cox-Snell residual plot further confirmed the Logistic model as well fitted for evaluating the survival time of these 767 HIV/AIDS patients. Then, number of predictors have been tried to reduce by determining partial correlated/ associated variables/predictors using partial correlation/ ANCOVA. Using this technique, 4 predictors have been selected. It was disclosed that the model fitted with proposed technique is a good fit than the models fitted with all other methods. Therefore, from this study it can be concluded that it is not necessary to take all the predictors are not needed to take in the model to estimate the survival time of the patients as many prognostic factors may be partially correlated/ associated with each other and taking only one of them may satisfy the need of all of the remaining correlated/ associated predictors.
Acknowledment
We sincerely acknowledge and thank Dr. Ram Manohar Lohia hospital for permitting us to use the HIV/AIDS database.
Conflict of Interest
The authors declare no conflict of interest.
Funding Source
This study is not funded by any funding agency.
References
- Quinn, T.C. (1996): Global burden of the HIV pandemic. Lancet ; 348: 99-104.
- Mann, J.M., Tarantola, D.J.M. (1998): HIV- The global picture. Sci Am. 279:82-83.
- Islam, A., Zaffar and Tahir, M.(2002): Health sector reform in South Asia: New challenges and constraints., Health Policy ; 60: 151-69
- UNAIDS (2014): a GAP report 2014.
- NACO (2013) ‘India: Annual Report 2012-13.
- WHO (2013): Global update on HIV treatment 2013: Results, Impact and Opportunities.
- Ghate, M., S. Deshpande, S. Tripathy, S. Godbole and M. Nene et al., 2011. Mortality in HIV infected individuals in Pune, India. Ind. J. Med. Res., 133: 414-420.
- Rai, S., B. Mahapatra, S. Sircar, P.Y. Raj and S. Venkatesh et al., 2013. Adherence to antiretroviral therapy and its effect on survival of HIV-infected individuals in Jharkhand, India. PloS One. DOI: 10.1371/journal.pone.0066860
- Kee, M.K., J.H. Lee, E.J. Kim, J. Lee and J.G. Nam et al., 2009. Improvement in survival among HIV-infected individuals in the Republic of Korea: Need for an early HIV diagnosis. BMC Infect. Dis., 9: 128-128. DOI: 10.1186/1471-2334-9-128
- Jerene, D., A. Endale, Y. Hailu and B. Lindtjørn, 2006. Predictors of early death in a cohort of Ethiopian patients treated with HAART. BMC Infect. Dis., 6: 136-136. DOI: 10.1186/1471-2334-6-136
- Erango, M. A., & Goshu, A. T. Prediction of Survival of HIV/AIDS Patients from Various Sources of Data Using AFT Models.
- Chakravarty, J., Tiwary, N. K., Prasad, S. R., Shukla, S., Tiwari, A., Mishra, R. N., & Sundar, S. (2014). Determinants of survival in adult HIV patients on antiretroviral therapy in Eastern Uttar Pradesh: A prospective study. The Indian Journal of Medical Research, 140(4), 491.
- Performance of Cox Proportional Hazard and Accelerated Failure Time Models in the Analysis of HIV/TB Co-infection Survival DataND Nawumbeni, A Luguterah, T AdampahResearch on Humanities and Social Sciences 4 (21), 94-102, 2014
- Orisakwe, E. E., Ross, A. J., & Ocholla, P. O. (2012). Correlation between knowledge of HIV, attitudes and perceptions of HIV and a willingness to test for HIV at a regional hospital in KwaZulu-Natal, South Africa. African Journal of Primary Health Care and Family Medicine, 4(1), 1-8.
- Nubed, C. K., & Akoachere, J. F. T. K. (2016). Knowledge, attitudes and practices regarding HIV/AIDS among senior secondary school students in Fako Division, South West Region, Cameroon. BMC public health, 16(1), 847.
- Ye, H., Yuan, J., Wang, Z., Huang, A., Liu, X., Han, X., & Chen, Y. (2016). A Canonical Correlation Analysis of AIDS Restriction Genes and Metabolic Pathways Identifies Purine Metabolism as a Key Cooperator. Computational and mathematical methods in medicine, 2016.
- Grover, G., Das, R., Swain, P. K., & Deka, B. (2013). On the estimation of survival of HIV/AIDS patients on antiretroviral therapy using NPMLE method: an application to interval censored data. American Journal of Mathematics and Statistics, 3(4), 213-219.
- Hafner, R., Inderlied, C. B., Peterson, D. M., Wright, D. J., Standiford, H. C., Drusano, G., & Muth, K. (1999). Correlation of quantitative bone marrow and blood cultures in AIDS patients with disseminated Mycobacterium avium complex infection. The Journal of infectious diseases, 180(2), 438-447.
- Rueda, S., Mitra, S., Chen, S., Gogolishvili, D., Globerman, J., Chambers, L., … & Rourke, S. B. (2016). Examining the associations between HIV-related stigma and health outcomes in people living with HIV/AIDS: a series of meta-analyses. BMJ open, 6(7), e011453.

