Athira B kaimal1* and Priestly Shan B2
1Shri Venkateshwara University, Uttar Pradesh,Rajabpur Gajraula, India.
2School of Electrical, Electronics and Communication Engineering, Galgotias University,Greater Noida, India.
Corresponding Author E-mail: athirabk90@gmail.comDOI : https://dx.doi.org/10.13005/bpj/1768
Abstract
Development of post-processing algorithms which cannot be detected by forensic tools is an active area of research in image processing. Median Filter (MF) is one among the denoising schemes which is specifically targeted by the forensic toolsbecause of its wide application in commercial raster graphic editors, simplicity, fast computation and detail preserving characteristics. Methodsbased on Convolutional Neural Networks (CNN) and Variational Deconvolution (VD), meant for reducing the forensic detectability of MF by removing the traces of filtering from the output images are computationally intense. A simple and computationally feasible approach for removing the traces of median filtering from the output images, thereby to reduce the forensic detectability of MF is proposed in this paper. In the proposed approach, blurred edges in the output of MF are restored with the help of Unsharp Masking (UM). Optimum value of the amount which controls the degree of sharpening in the UM algorithm is determined via minimum error sense criterion by making use of Peak Signal to Noise Ratio (PSNR) between input and processed images as objective function. Values of PSNR and Structural Similarity Index Metric (SSIM) between input and output images exhibited by the proposed algorithm are found to be higher than those exhibited by methods based on CNN, VD and combined framework of VD and Total Variation (TV) minimisation.
Keywords
Anti-Image Forensics; Image Denoising; Median Filter; Medical Image
Download this article as:| Copy the following to cite this article: kaimal A. B, Shan P. Removing the Traces of Median Filtering via Unsharp Masking as an Anti-forensic Approach in Medical Imaging. Biomed Pharmacol J 2019;12(3). |
| Copy the following to cite this URL: kaimal A. B, Shan P. Removing the Traces of Median Filtering via Unsharp Masking as an Anti-forensic Approach in Medical Imaging. Biomed Pharmacol J 2019;12(3). Available from: http://biomedpharmajournal.org/?p=28611 |
Introduction
Development of post-processing algorithms which cannot be detected by forensic tools is an active area of research in image processing. Such anti-forensic post-processing techniques comprise algorithms for image denoising, compression, contrast enhancement and sharpening. Reliable anti-forensic algorithms for JPEG compression [1-2] and contrast enhancement [3-4] which cannot be caught by forensic tools are available in literature.
As already mentioned, image denoising is one of the very important post-processing steps. Median filter is a popular denoising algorithm widely used in commercial raster graphic tools because of its simplicity, computational feasibility and detail preserving characteristics. In fact, median filter is the one among denoising algorithms which is specifically targeted by the forensic tools because of the merits said above.
A wide class of methods [5-9] like deterministic algorithms [5], non-parametric Auto Regressive (AR) models [6], deep learning approaches [7], etc. are available in the literature for the detection of median filtering.Some of the features used in literature for the detection of median filtering, include gradient between neighbouring pixels in the denoised image, local values of Fourier Transform (FT) coefficients [8], singular values of the denoised image obtained via Singular Value Decomposition (SVD) [9].
Review of Literature
A few anti-forensics modifications of median filter [10-12] are available in literature. Kim et al. [10] used deep Convolutional Neural Networks (CNN) to remove the traces of filtering in the output images of median filter. A framework of generative adversarial networks was adopted to produce images which are close to the original images in terms of the grey level statistics. Fan et al. [11] used Variational Deconvolution(VD) to improve the quality of median filtered image for reducing the forensic detectability. In the framework proposed by Singh et al. [12], VD had been utilised for generating a median filtered forgery. The forgery was further refined in a second step with the help of Total Variation (TV) minimization to remove the artefacts caused during VD.
Lacuna Drawn and Gaps Identified
Methods for reducing the forensic detectability of median filter by removing its traces from the output images, involving CNN [10] and VD [11-12] are computationally heavy. This hampers the simplicity and computational feasibility of the median filter. What is necessary is a simple and computationally feasible approach for removing the traces of median filtering from the output images thereby to reducethe forensic detectability of median filter
Contribution, Novelty and Highlights
A simple and computationally feasible approach for removing the traces of median filtering from the output images thereby to reduce the forensic detectability of MF is proposed in this paper. In the proposed approach, blurred edges in the output of MF are restored with the help of Unsharp Masking (UM). Optimum value of amount which controls the degree of sharpening in the UM algorithm is determined via minimum error sense criterion by making use of Peak Signal to Noise Ratio (PSNR) between input and output images as objective function.
Content of the Paper
Strategy for removing the traces left by median filtering from the output images, analytics of the UM algorithm, algorithm for determining operational parameter of UM algorithm, method of computing the Image Quality Analysis (IQA) metrics like PSNR and Structural Similarity Index Metric (SSIM) used for validating the performance of the proposed framework and particulars of High Resolution Computed Tomography (HRCT) images used as test images are discussed in section 2 of this paper. The pattern of variation of the objective function which is PSNR between input and processed images with respect to the variation of ‘Amount’ in UM and corresponding variation of the perceptual quality of the processed images are analysed in section 3. In section 4, the performance of the proposed algorithm is compared against methods based on CNN, VD and combined framework of VD and Total Variation minimisation in terms of PSNR and SSIM between input and processed images and computational speed.
Materials and Methods
Generally, median filtering is detected by the forensic tools [5-9] from the unnatural blur at edges caused by the filtering process. The straight forward method to reduce forensic detectability of MF is to correct the unnatural blur at edges caused by the filtering process. In this paper, blurred edges in the output of the MF is restored with the help of UM algorithm.
Unsharp Masking
In UM, a fraction of the high-frequency content obtained by subtracting the Gaussian filtered image from the original one is added back to the original image itself. In our context, input to the UM is the output of MF. The difference between input image ‘X’ and its Gaussian filtered output is computed as,
D=X – (X**HG) (1)
where‘HG’ is the Gaussian filter mask. For the easiness of calculation, (1) is generally implemented as [13],
The generic form of the Gaussian filter mask ‘HG’ is,

where‘σ’, is the standard deviation of Gaussian. ‘w’ is the radius of the mask. The identity convolution mask, ‘H0’ in (2) is,

In UM, a fraction of the difference between the input image and its Gaussian filtered image is added back to the input image itself. The operation is mathematically expressed as [13],
![]()
The fraction of difference between the input and Gaussian filtered images added back to the input image is a manually selected parameter. This parameter is usually called as scale or amount notated by ‘λ’. The mathematical transformation involved in UM described in (5) can be schematically represented as illustrated in figure 1.
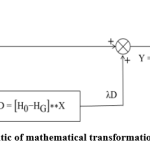 |
Figure. 1: Schematic of mathematical transformation involved in UM |
Determination of Optimum Value of Amount
Optimum value of amount in the UM algorithm is determined via minimum error sense criterion by making use of Peak Signal to Noise Ratio (PSNR) between input and processed images as objective function. Schematic of the proposed framework for removing the traces of filtering from the output of MF is shown in fig. 2.
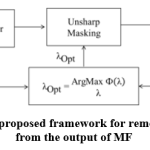 |
Figure 2: Schematic of the proposed framework for removing the traces of filtering from the output of MF |
The value of amount which offers maximum value of the PSNR between input and processed images is considered as optimum as expressed mathematically in (6) below.

In (6), ‘Ф’ stands for the target function which is the PSNR between input and processed images. Optimum value of the amount, ‘λ’ is determined via an iterative search. In the iterative search for the optimum value of amount, the value of amount is increased by small steps from 0 towards 2. At each value of the amount, the value of objective function, ‘Ф’ which is the PSNR between input and processed images is computed. It is hypothesized that with respect to increase in the amount, PSNR between input and processed imageswill increase monotonically as the edges in the output of MF get slowly restored back. At a particular value of the amount, PSNR reaches it maximum when the edges in the output of MF get perfectly restored. When the value of the amount is increased further, PSNR comes down as the edges in the processed image become sharper than the edges in the input image. The iterative search for optimum value of the amount can be terminated when ΔФ < 0. ΔФ is the difference between the values of the objective function computed during two consecutive iterations.
Image Quality Analysis (IQA) Metrics
Two IQA metrics are used in this paper. As already mentioned, PSNR between input and processed images is used as objective function for determining optimum value of amount in the UM algorithm. Both PSNR and SSIM between the input and processed images are used for comparing the performance of the proposed framework with methods based on CNN, VD and combined framework of VD and TV minimisation, quantitatively. SSIM objectively measures statistical similarity between the input and processed images [14-15]. Whereas, PSNR indicates the degree of one to one correspondence between grey levels in the input and processed images [16-17]. PSNR between input image, ‘X’ and processed image, ‘Y’ is,

SSIM shows the statistical resemblance between the input and contrast-enhanced images. In general, SSIM between the input image ‘X’ and the processed image ‘Y’ is,

where Q1 = [q1(L-1)]2 & Q2 = [q2(L-1)]2, q1, q2 ≪ 1. q1 and q2 are two user-defined parameters. Values of q1 and q2 are fixed as 0.01 and 0.03, respectively as per the recommendations in [18]. ‘μx’ mean illumination of the input image. ‘μy’ is the mean illumination of the processed image. ‘σx2’ is the variance of grey levels in the input image. ‘σy2’ is the variance of grey levels in the processed image. ‘σxy’ is the covariance between input image and processed images.
Test Images
The specimen images (30 Nos.) used in this paper belong to Axial Plane HRCT images of temporal bone studies acquired with Philips ingenuity CT. The specifications of the acquisition are; tube voltage equal to 120kVP, tube current equal to 209 mA, 1 mm slice thickness, zero tilt, for an acquisition time of 1437 milli-seconds and Display Field of View (DFOV) equal to 193 mm with 70% zoom. The experimental study is performed in Matlab®.
Results
The pattern of variation of the objective function which is the PSNR between input and processed images with respect to the variation of ‘Amount’ in UM and corresponding variation of the perceptual quality of the processed image are analysed in this section. Pattern of variation of PSNR between input and processed images with respect to the variation of ‘Amount’ for two HRCT test images is shown in fig. 3.
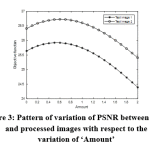 |
Figure 3: Pattern of variation of PSNR between input and processed images with respect to the variation of ‘Amount’ |
As hypothesized in the methodology, with respect to increase in the amount, PSNR between input and processed images increases monotonically as the edges in the output of MF get slowly restored back. At a particular value of the amount, λ = 0.5 for test image 1 and λ = 0.6 for test image 2, PSNR reaches it maximum when the edges in the output of MF get perfectly restored. When the value of the amount is increased further, PSNR comes down as the edges in the processed image become sharper than the edges in the input image. The input image, output image of MF, output of UM at the optimum value of amount, output of UM below the optimum value of amount and output of UM above the optimum value of amount for test image 1 and test image 2 are shown in figure 4 and figure 5. Radius of Gaussian mask in UM is fixed as 2 and dimension of the median filter is kept as 7×7 during the experiment.
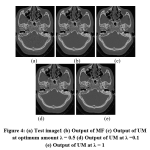 |
Figure 4: (a) Test image1 (b) Output of MF (c) Output of UM at optimum amount λ = 0.5 (d) Output of UM at λ = 0.1 (e) Output of UM at λ = 1 |
It can be noted in fig. 4(b) and fig. 5 (b) that edges in the output image of MF are blurred. At optimum value of the amount, strength of edges in the output of UM (fig. 4(c) and fig. 5(c)) is in par with that in the input images in fig. 4(a) and fig. 5(a), respectively. Below the optimum value of amount, edges in the output of UM (fig. 4(d) and fig. 5(d)) remain blurred and not restored faithfully. When the amount is above its optimum value, edges in the output of UM (fig. 4(e) and fig. 5(e)) become slightly sharper compared to the input image. PSNR and SSIM between input and processed images at the optimum value of amount, below the optimum value of amount and above the optimum value of amount, for test image 1 and test image 2 are given in table 1. It can be noted in table 1 that values of both PSNR and SSIM are higher at the optimum value of amount.
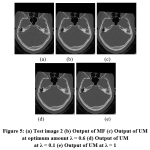 |
Figure 5: (a) Test image 2 (b) Output of MF (c) Output of UM at optimum amount λ = 0.6 (d) Output of UM at λ = 0.1 (e) Output of UM at λ = 1 |
Table 1: PSNR and SSIM between input and processed images at the optimum value of amount, below the optimum value of amount and above the optimum value of amount for test image 1 and test image 2
| Test image | Amount | PSNR | SSIM |
| 1 | 0.1 | 25.74 | 0.643 |
| 0.5 | 25.92 | 0.645 | |
| 1 | 25.73 | 0.635 | |
| 2 | 0.1 | 26.51 | 0.665 |
| 0.6 | 26.72 | 0.683 | |
| 1 | 26.60 | 0.671 |
Discussions
In this section, the performance of the proposed algorithm is compared against methods based on CNN, VD and combined framework of VD and Total Variation minimisation, in terms of PSNR and SSIM between input and processed images as well as computational time. Output images of different schemes meant for removing the traces of filtering from the output of MF for test image are tested. In the output of VD, noise-like annoying grey level disturbances can be seen especially at the homogenous regions of the images. This is because of the processing induced artefacts in VD. The combination of VD and TV minimisation is able to suppress these artefacts to a great extent as seen. But the combination of VD and TV minimisation causes widening of edges. From the output images of CNN it is clear that CNN fails to restore the edge strength in the output of MF in par with the quality of edges in the input images. The proposed framework is able to restore the edge strength in the output of MF to a level equal to the quality of edges in the input images, without causing any edge widening or processing induced artefacts. Qualitative inspection of the output images of different schemes meant for removing the traces of filtering from the output of MF reveals that the proposed framework is superior to VD, the combination of VD as well was TV minimisation and CNN based approaches.
PSNR, SSIM and the computational time exhibited by different schemes for removing the traces of filtering in the output of MF on 30 test images are shown in table 2. The proposed framework shows highest values of PSNR and SSIM compared to its alternatives. This is a quantitative conformation that output of the proposed framework is comparatively close to the input image in terms of one to one correspondence of the grey levels and statistical moments of grey levels. Increased similarity with the input image, especially in terms of the edge strength, helps to fool the forensic tools. Proposed framework is computationally faster than, approaches based on VD, the combination of VD as well was TV minimisation and CNN. Both qualitative evaluation of the output images and objective evaluation point out the merits of the proposed framework over the methods in literature.
Table 2: PSNR and SSIM exhibited by different schemes for removing the traces of filtering from the output of MF, on 30 test images
| Method | PSNR | SSIM | Computational
Time (S) |
| VD | 25.3 ± 0.11 | 0.631 ± 0.059 | 69 ± 9.57 |
| VD + TV | 25.9 ± 0.05 | 0.643 ± 0.061 | 127 ± 11.35 |
| CNN | 26.3 ± 0.16 | 0.659 ± 0.073 | 1289 ± 58 |
| Proposed | 26.5 ± 0.21 | 0.664 ± 0.052 | 3.12 ± 0.58 |
Conclusion
A simple and computationally feasible approach for removing the traces of median filtering from the output images thereby to reduce the forensic detectability of MF is proposed in this paper. Values of PSNR and SSIM between input and output images exhibited by the proposed algorithm were found to be higher than those exhibited by methods based on CNN, VD and combined framework of VD and TV minimisation. The proposed algorithm was found to faster than methods based on CNN, VD and combined framework of VD and TV minimisation.
References
- C. Stamm and K. J. R. Liu, “Anti-forensics of digital image compression,” in IEEE Transactions on Information Forensics and Security, vol. 6, no. 3, pp. 1050-1065, Sept. 2011.
- Fan, K. Wang, F. Cayre and Z. Xiong, “JPEG Anti-Forensics With Improved Trade-off Between Forensic Undetectability and Image Quality,” in IEEE Transactions on Information Forensics and Security, vol. 9, no. 8, pp. 1211-1226, Aug. 2014.
- Mehrish, A. V. Subramanyam and S. Emmanuel, “Joint Spatial and Discrete Cosine Transform Domain-Based Counter Forensics for Adaptive Contrast Enhancement,” in IEEE Access, vol. 7, pp. 27183-27195, 2019.
- Ravi, A. V. Subramanyam and S. Emmanuel, “ACE–An Effective Anti-forensic Contrast Enhancement Technique,” in IEEE Signal Processing Letters, vol. 23, no. 2, pp. 212-216, Feb. 2016.
- Pasquini, G. Boato, N. Alajlan and F. G. B. De Natale, “A Deterministic Approach to Detect Median Filtering in 1D Data,” in IEEE Transactions on Information Forensics and Security, vol. 11, no. 7, pp. 1425-1437, July 2016.
- Kang, M. C. Stamm, A. Peng and K. J. R. Liu, “Robust Median Filtering Forensics Using an Autoregressive Model,” in IEEE Transactions on Information Forensics and Security, vol. 8, no. 9, pp. 1456-1468, Sept. 2013.
- Chen, X. Kang, Y. Liu and Z. J. Wang, “Median Filtering Forensics Based on Convolutional Neural Networks,” in IEEE Signal Processing Letters, vol. 22, no. 11, pp. 1849-1853, Nov. 2015.
- H. Rhee, “Median filtering detection using variation of neighbouring line pairs for image forensics,” Journal of Electronic Imaging, vol. 25, issue 5, 2016.
- Amanipour and S. Ghaemmaghami, “Median Filtering Forensics in Compressed Video,” in IEEE Signal Processing Letters, vol. 26, no. 2, pp. 287-291, Feb. 2019.
- Kim, H. Jang, S. Mun, S. Choi and H. Lee, “Median Filtered Image Restoration and Anti-Forensics Using Adversarial Networks,” in IEEE Signal Processing Letters, vol. 25, no. 2, pp. 278-282, Feb. 2018.
- Fan, K. Wang, F. Cayre and Z. Xiong, “Median Filtered Image Quality Enhancement and Anti-Forensics via Variational Deconvolution,” in IEEE Transactions on Information Forensics and Security, vol. 10, no. 5, pp. 1076-1091, May 2015.
- Singh, A. Kansal and G. Singh, “An improved median filtering anti-forensics with better image quality and forensic detectability,” Multidimensional Systems and Signal Processing, 2019, (In press), https://doi.org/10.1007/s11045-019-00637-8.
- Joseph, B.N. Anoop BN, and J. Williams, “A Modified Unsharp Masking with Adaptive Threshold and Objectively Defined ‘Amount’ Based on Saturation Constraints for MR Images,” Multimedia Tools and Applications, vol. 78, issue 8, 2019, pp. 11073 –11089.
- G. Kuppusamy P.G., J. Joseph and J. Sivaraman, A customized nonlocal restoration scheme with adaptive strength of smoothening for MR images, Biomedical Signal Processing and Control, vol. 49, 2019, pp. 160-172.
- Simi V.R., D.R. Edla and J. Joseph, A Fuzzy Sharpness Metric for Magnetic Resonance Images, Journal of Computational Science, vol. 29, November 2018, pp. 1-8.
- R. Simi, D.R. Edla, J. Joseph and V. Kuppili, Analysis of Controversies in the Formulation and Evaluation of Restoration Algorithms for MR Images, Expert Systems with Applications, https://doi.org/10.1016/j.eswa.2019.06.003. (http://www.sciencedirect.com/science/article/pii/S0957417419303975) Elsevier, SCI Indexed, Impact factor: 3.768 (In Press).
- Joseph and R. Periyasamy, A fully customized enhancement scheme for controlling brightness error and contrast in magnetic resonance images, Biomedical Signal Processing and Control, vol. 39, 2018, pp. 271-283.
- Wang, A.C. Bovik, H.R. Sheikh and E.P. Simoncelli, “Image quality assessment: from error visibility to structural similarity,” in IEEE Transactions on Image Processing, vol. 13, 2004, pp. 600-612.


