Fahim Faisal and Mirza Muntasir Nishat*
Department of Electrical and Electronic Engineering Islamic University of Technology (IUT) Boar Bazar, Gazipur-1704 Bangladesh
Corresponding Author’s Email: mirzamuntasir@iut-dhaka.edu
DOI : https://dx.doi.org/10.13005/bpj/1754
Abstract
This paper presents a novel approach of investigating registration performance of different Multiple Sclerosis (MS) affected brain tissues with brain atlas by image inpainting technique. MS is an immune-mediated disorder that develops from an interaction of the individual's genetics and unidentified environmental causes. In order to carry out medical diagnosis in proper time image registration plays a vital role. In this work, different MS lesions are introduced in healthy brain tissue in order to analyse and characterize according to their characteristics (T1 weighted image, T2 weighted image) because MS lesions create a strong bias in image registration process. Thus, image inpainting technique appears to be a handy tool to reduce the bias efficiently. It is evident that the proposed inpainting algorithm performs satisfactorily with a view to reducing the bias in the registration step. The overall performance of the technique is evaluated by utilizing Dice and Jaccard scores. MATLAB and FSL software are used to perform the simulation.
Keywords
Multiple Sclerosis; Image registration; BET; lesions; MRI; CNS; Dice and Jaccard Score
Download this article as:| Copy the following to cite this article: Faisal F, Nishat M. M. An Investigation for Enhancing Registration Performance with Brain Atlas by Novel Image Inpainting Technique using Dice and Jaccard Score on Multiple Sclerosis (MS) Tissue. Biomed Pharmacol J 2019;12(3). |
| Copy the following to cite this URL: Faisal F, Nishat M. M. An Investigation for Enhancing Registration Performance with Brain Atlas by Novel Image Inpainting Technique using Dice and Jaccard Score on Multiple Sclerosis (MS) Tissue. Biomed Pharmacol J 2019;12(3). Available from: https://bit.ly/2pvuEYp |
Introduction
Multiple Sclerosis (MS) is an unpredictable, often disabling disease of the Central Nervous System (CNS) that disrupts the flow of information within the brain, and between the brain and body.1 It is the most common auto immune disorder affecting CNS.2 and it affects the brain and spinal cord alike.
When any part of the myelin sheath or nerve fibre is damaged or destroyed, nerve impulses traveling to and from the brain and spinal cord are distorted or interrupted, producing a wide variety of symptoms.3 The MSF (Multiple Sclerosis Foundation) estimates that more than 400,000 people in the USA, around 100,000 people in the UK have MS and about 2.5 million people around the world have MS.4 In 2013, about 2.3 million people were affected globally with rates varying widely in different regions and among different populations.5, 6 The disease usually begins between the ages of 20 and 50 and is twice as common in women as in men.7
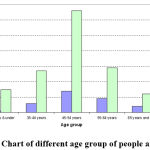 |
Figure 1: Bar Chart of different age group of people affected by MS |
While the cause is not clear, the underlying mechanism is thought to be either destruction by the immune system or failure of the myelin-producing cells.6 Proposed causes for this include genetics and environmental factors such as being triggered by a viral infection.2 MS is usually diagnosed based on the presenting signs and symptoms and the results of supporting medical tests.6 The three main characteristics of MS are the formation of lesions in the central nervous system (also called plaques), inflammation, and the destruction of myelin sheaths of neurons. These features interact in a complex and not yet fully understood manner to produce the breakdown of nerve tissue and in turn the signs and symptoms of the disease.2
To diagnose and treat patients with MS and other neurological diseases, it is a common practice to use brain atlas.8 A brain atlas is composed of serial sections along different anatomical planes of the healthy or diseased developing brain where each relevant brain structure is assigned a number of coordinates to define its outline or volume. Registering a patient brain with brain atlas is the most common way to build it. One of the objectives of image registration is to allow the characterization of the morphology of different subjects’ brains helps to make anatomical comparison among different populations.9
Objective of this study can be stated as investigation of a new inpainting technique as this can be used to reduce the distortion in the registration process. Another one is characterizing its performance with numerous patients MRI images so that more robust detection is possible in near future to treat this disease.
Section 2 of this paper presents the idea of the Multiple Sclerosis disease. Section 3 deals with working procedure with different brain tissues which includes numerous patients’ data. Section 4 portrays the comparative analysis of the method which includes both qualitative and quantitative approach. Finally, in section 5 conclusion and future works are portrayed.
Multiple Sclerosis
Multiple sclerosis (MS) is a demyelinating disease in which the insulating covers of nerve cells in the brain and spinal cord are damaged.10 This damage disrupts the ability of parts of the nervous system to communicate, resulting in a range of signs and symptoms, including physical, mental, and sometimes psychiatric problems. MS takes several forms, with new symptoms either occurring in isolated attacks (relapsing forms) or building up over time (progressive forms).11 In severe cases, the patient becomes paralyzed or blind while in milder cases there may be numbness in the limbs and other several parts or organs of the body. This damage disrupts the ability of parts of the nervous system to communicate resulting in a range of signs and symptoms including physical, mental and sometimes psychological problems as well.
Signs and symptoms of MS
Signs and symptoms are not mandatory for an MS patient. It is possible that it may not show any signs until a certain stage. And the exact cause is still unknown to the researchers. But still some early symptoms can be identified by researches oriented through it. Early symptoms may include total weakness, fatigue, vertigo, tingling, numbness, blurred vision and even problem with balance and coordination.
Cause and Cure of MS
While the cause is not clear, the underlying mechanism is thought to be either destruction by the immune system or failure of the myelin-producing cells.12 Proposed causes for this include genetics and environmental factors such as being triggered by a viral infection.13, 14 MS is usually diagnosed based on the presenting signs and symptoms and the results of supporting medical tests.15 There is no known cure for multiple sclerosis. Physical therapy can help with people’s ability to function.10 Medications used to treat MS, while modestly effective, can have side effects and be poorly tolerated. Many people pursue alternative treatments, despite a lack of evidence.16 Treatments attempt to improve function after an attack and prevent new attacks.17 The long-term outcome is difficult to predict, with good outcomes more often seen in women, those who develop the disease early in life, those with a relapsing course, and those who initially experienced few attacks.18 Life expectancy is on average 5 to 10 years lower than that of an unaffected population.19
Role of MRI to diagnose MS
MRI is the investigative tool of choice for neurological cancers, as it has better resolution than CT and offers better visualization of the posterior fossa. The contrast provided between grey and white matter makes it the best choice for many conditions of the central nervous system, including demyelinating diseases, dementia, cerebrovascular disease, infectious diseases and epilepsy.7 MRI allows doctors to see lesions in the central nervous system. It’s important to note, however, that not all lesions are due to MS and not all people with MS have lesions.
Methodology
For MS patients, lesions can be found at White Matter (WM) and Grey Matter (GM). WM lesions are more common, prominent and can easily be detected by traditional imaging technique. Such MS lesions create distortion in the registration step in the brain atlas. This is because, WM lesions look like GM and as registration techniques use mutual information like brightness, color, shape, relative position; these lesions can be mistaken as GM in WM creating distortion in the registration step. To reduce such unwanted distortion, many researchers have used different techniques.
One is spatial normalization20 where the subject brain is deformed to correspond to the same location in the target brain (i.e. the atlas). It is often performed in research-based functional neuroimaging where one wants to find common brain activation across multiple human subjects. But, the problem is comparisons of group activation data for patients with brain lesions with data from controls must still be treated with severe caution.21 Second way to deal with MS lesion bias is to use seed points. Seed points can be processed with intuitive heuristics which provide improved segmentation accuracy while facilitating quick and natural point placement. But, the method does not account for normal variations in intensity.22
Finally, another method is Image Inpainting technique. Image inpainting is the process of reconstructing lost or deteriorated parts of images.23 It is mathematically highly ill posed process. There are many inpainting algorithms available for traditional structural 2D images such as harmonic inpainting technique,24 Mumford shah algorithm,25 and Transport inpainting algorithm26 and so on.
To get raw brain data, we used Human Connectome Project (HCP)27 open source data of healthy brains. The dataset was provided by HCP database which was composed of numerous sets of patient’s data. To extract the brain matter from the whole brain scan, Brain Extraction Tool (BET)28 is used. It deletes non-brain tissues like skull, tongue from an MRI image and extracts the brain matters from it. After that SUSAN29 is used for noise reduction. For these operations, FMRIB Software Library (FSL)30 is used. After adding mask over the healthy brain, the conventional inpainting algorithms are utilized to remove the artificial lesions. Then our proposed inpainting method will be utilized to inpaint the lesions in the brain. After that, image registration is done for linear characterization. We will use both qualitative as well as quantitative analysis with numerous brain data. Thus, an analysis is done with the proposed algorithm for further investigation.
Comparative Analysis and Results
To evaluate our results, we at first apply some image pre-processing using BET (Brain Extraction Tool) in our data. Then after this pre-processing we use (logical) mask to create artificial lesions and then apply our algorithm31 to test its feasibility. We will be conducting two different types of results. They are- Qualitative, Quantitative and Graphical Analysis.
Qualitative Analysis
For comparing our results, we use standard comparison method Jaccard and Dice with the other inpainting algorithm (Transport, Mumford Shah, Harmonic etc.) For our justification we also applied the same procedure in a normal image to see how it works on the real image. Firstly, utilizing only white lesions added artificially in 2D image and MRI image with artificial white lesion is done. These are shown in.31 After dealing with white lesions we have looked over the lesions being slightly greyish (both light grey and dark grey) as well as mixed type artificial lesion.
MRI Image with greyish lesions
There are lots of types of images can be formed through the MRI images. For simplicity we will be discussing about mainly three types of images. They are T1 weighted image, T2 weighted image and proton density weighted image. For Qualitative analysis, MRI T1 brain image of a healthy patient is taken and then artificially grey lesions are added which is depicted in Fig 2
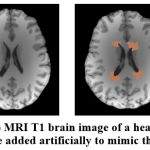 |
Figure 2: (a) MRI T1 brain image of a healthy patient, (b) lesions are added artificially to mimic the MS lesions. |
After getting the mimicking done, now we are going to use the traditional inpainting techniques (i.e. harmonic, Mumford shah, transport) to inpaint the lesioned image. Now, these techniques are used as they are the state-of-the-art methods for inpainting generally 2D images which are shown in Fig. 3(a), 3 (b) and 3 (c).
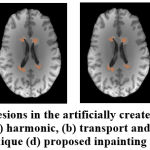 |
Figure 3: The lesions in the artificially created MS brain are inpainted using (a) harmonic, (b) transport and (c) Mumford and shah technique (d) proposed inpainting algorithm. |
Now that we have utilized the traditional methods, we can visually compare the effectiveness of these state-of-the-art methods. Our next task is to use our proposed inpainting algorithm of this thesis to inpaint the lesions which we artificially structured in the healthy patient brain beforehand. After using the inpainting technique proposed in our method, we will have something like the following shown in Fig. 3 (d).
MRI Image with mixed (white and grey) lesions (orientation type 1)
MRI T1 brain image of a healthy patient is taken again and now artificially mixed lesions are added which is depicted in Fig 4.
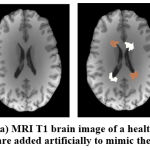 |
Figure 4: (a) MRI T1 brain image of a healthy patient, (b) lesions are added artificially to mimic the MS lesions |
After getting the mimicking done, now we are going to use the traditional inpainting techniques (i.e. harmonic, Mumford shah, transport) to inpaint the lesioned image which is shown in Fig. 5 (a), 5 (b) and 5 (c). Now that we have utilized the traditional methods, we can visually compare the effectiveness of these state-of-the-art methods.
Our next task is to use our proposed inpainting algorithm to inpaint the lesions which we artificially structured in the healthy patient brain beforehand. After using the inpainting technique proposed in our method, we will have something like the following shown in Fig. 5 (d)
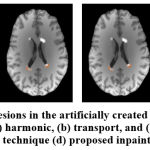 |
Figure 5: The lesions in the artificially created MS brain are inpainted using (a) harmonic, (b) transport, and (c) Mumford and shah inpainting technique (d) proposed inpainting algorithm |
MRI Image with mixed (white and grey) lesions (orientation type 2)
Now, again, if we apply different orientation of mixed lesions
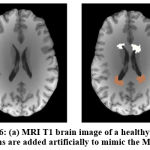 |
Figure 6: (a) MRI T1 brain image of a healthy patient, (b) lesions are added artificially to mimic the MS lesions. |
After getting the mimicking done, now we are going to use the traditional inpainting techniques (i.e. harmonic, Mumford shah, transport) to inpaint the lesioned image. Now, these techniques are used as they are the state-of-the-art methods for inpainting generally 2D images shown in Fig. 7 (a), 7 (b) and 7 (c).
But we will check the workability of those in MRI images by visual as well as dice and jaccard scores (dice and jaccard scores are used to compare the images quantitatively). So here also we will use conventional ones as well as our one. After using the inpainting technique proposed in our method, we will have something like the following in Fig. 7 (d).
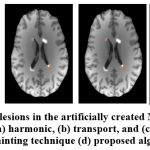 |
Figure 7: The lesions in the artificially created MS brain are inpainted using (a) harmonic, (b) transport, and (c) Mumford and shah inpainting technique (d) proposed algorithm |
Quantitative Analysis
First, we have used the traditional methods and finally we started to utilize our proposed method to work with. We have already used that in31 for 2D image. Now here 5 different patient’s brain T1 and T2 data are taken and inpainted with the state-of-the-art methods as well as our proposed algorithm. We intended to use the MRI images of the patient’s brain collected form human connectome project (HCP)27 database. To prove, dice and Jaccard scores are used (dice and jaccard scores are used to compare the images quantitatively). For Patient 1 MRI images of T1 weighted image is shown in Table 1.
Table 1: Dice and Jaccard Scores for Comparison among Different Inpainting Techniques in case of MRI Images (For Patient 1 T1WI).
| MRI Data | ||
| Methodology | Jaccard score | Dice Score |
| Harmnonic [24] | 0.9811 | 0.9905 |
| Mumford n Shah [25] | 0.9547 | 0.9978 |
| Transport [26] | 0.9687 | 0.9841 |
| Proposed | 0.9801 | 0.9854 |
In the similar way, we have used 5 patients both T1 weighted images as well as T2 weighted image (T2WI). For Patient 1, T2 weighted images are taken and the data are shown in Table 2.
Table 2: Dice and Jaccard Scores for Comparison among Different Inpainting Techniques in case of MRI Images (For Patient 1 T2WI)
| MRI Data | ||
| Methodology | Jaccard score | Dice Score |
| Harmnonic [24] | 0.9793 | 0.9705 |
| Mumford n Shah [25] | 0.9547 | 0.9778 |
| Transport [26] | 0.9587 | 0.9741 |
| Proposed | 0.9791 | 0.9804 |
Now, for Patient 2, MRI images of both T1 and T2 weighted image are taken and shown in Table 3 and Table 4 respectively.
Table 3: Dice and Jaccard Scores For Comparison Among Different Inpainting Techniques in case of MRI Images (For Patient 2 T1WI).
| MRI Data | ||
| Methodology | Jaccard score | Dice Score |
| Harmnonic [24] | 0.9654 | 0.9725 |
| Mumford n Shah [25] | 0.9689 | 0.9699 |
| Transport [26] | 0.9705 | 0.9856 |
| Proposed | 0.9742 | 0.9849 |
Table 4: Dice and Jaccard Scores For Comparison Among Different Inpainting Techniques in case of MRI Images (For Patient 2 T2WI)
| MRI Data | ||
| Methodology | Jaccard score | Dice Score |
| Harmnonic [24] | 0.9583 | 0.9589 |
| Mumford n Shah [25] | 0.9547 | 0.9609 |
| Transport [26] | 0.9687 | 0.9841 |
| Proposed | 0.9691 | 0.9854 |
Similarly, for Patient 3 MRI images of both T1 and T2 weighted image are taken. These are then compared with the proposed one which are shown in Table 5 and 6.
Table 5: Dice and Jaccard Scores for Comparison Among Different Inpainting Techniques in case of MRI Images (For Patient 3 T1WI).
| MRI Data | ||
| Methodology | Jaccard score | Dice Score |
| Harmnonic [24] | 0.9761 | 0.9804 |
| Mumford n Shah [25] | 0.9821 | 0.9874 |
| Transport [26] | 0.9701 | 0.9789 |
| Proposed | 0.9819 | 0.9880 |
Table 6: Dice and Jaccard Scores for Comparison Among Different Inpainting Techniques in case of MRI Images (For Patient 3 T2WI)
| MRI Data | ||
| Methodology | Jaccard score | Dice Score |
| Harmnonic [24] | 0.9699 | 0.9795 |
| Mumford n Shah [25] | 0.9801 | 0.9797 |
| Transport [26] | 0.9687 | 0.9697 |
| Proposed | 0.9803 | 0.9797 |
For Patient 4 and Patient 5, MRI images both T1 and T2 weighted image are taken which are depicted in Table 7, Table 8, Table 9 and Table 10.
Table 7: Dice and Jaccard Scores for Comparison Among Different Inpainting Techniques in case of MRI Images (For Patient 4 T1WI).
| MRI Data | ||
| Methodology | Jaccard score | Dice Score |
| Harmnonic [24] | 0.9418 | 0.9385 |
| Mumford n Shah [25] | 0.9401 | 0.9393 |
| Transport [26] | 0.9399 | 0.9302 |
| Proposed | 0.9421 | 0.9395 |
Table 8: Dice and Jaccard Scores for Comparison Among Different Inpainting Techniques in case of MRI Images (For Patient 4 T2WI)
| MRI Data | ||
| Methodology | Jaccard score | Dice Score |
| Harmnonic [24] | 0.9385 | 0.9336 |
| Mumford n Shah [25] | 0.9356 | 0.9299 |
| Transport [26] | 0.9287 | 0.9241 |
| Proposed | 0.9379 | 0.9340 |
Table 9: Dice and Jaccard Scores for Comparison Among Different Inpainting Techniques in case of MRI Images (For Patient 5 T1WI).
| MRI Data | ||
| Methodology | Jaccard score | Dice Score |
| Harmnonic [24] | 0.9602 | 0.9687 |
| Mumford n Shah [25] | 0.9612 | 0.9626 |
| Transport [26] | 0.9502 | 0.9584 |
| Proposed | 0.9610 | 0.9691 |
Table 10: Dice and Jaccard Scores for Comparison Among Different Inpainting Techniques in case of MRI Images (For Patient 5 T2WI)
| MRI Data | ||
| Methodology | Jaccard score | Dice Score |
| Harmnonic [24] | 0.9571 | 0.9597 |
| Mumford n Shah [25] | 0.9577 | 0.9595 |
| Transport [26] | 0.9487 | 0.9501 |
| Proposed | 0.9578 | 0.9598 |
Now, Patient 1 MRI images both T1 and T2 weighted image with greyish lesions are taken and evaluated which are shown in Table 11 and Table 12.
Table 11: Dice and Jaccard Scores for Comparison Among Different Inpainting Techniques in case of MRI Images (For Patient 1 T1WI).
| MRI Data | ||
| Methodology | Jaccard score | Dice Score |
| Harmnonic [24] | 0.9654 | 0.9725 |
| Mumford n Shah [25] | 0.9689 | 0.9699 |
| Transport [26] | 0.9705 | 0.9856 |
| Proposed | 0.9742 | 0.9849 |
Table 12: Dice and Jaccard Scores for Comparison Among Different Inpainting Techniques in case of MRI Images (For Patient 1 T2WI).
| MRI Data | ||
| Methodology | Jaccard score | Dice Score |
| Harmnonic [24] | 0.9583 | 0.9689 |
| Mumford n Shah [25] | 0.9547 | 0.9609 |
| Transport [26] | 0.9687 | 0.9841 |
| Proposed | 0.9691 | 0.9854 |
After that, mixed lesions are taken. First, Patient 1 MRI images of both T1 and T2 weighted images with mixed lesions orientation 1 and orientation 2 are given in Table 13, Table 14, Table 15 and Table 16
Table 13: Dice and Jaccard Scores for Comparison Among Different Inpainting Techniques in case of MRI Images (For Patient 1 T1WI).
| MRI Data | ||
| Methodology | Jaccard score | Dice Score |
| Harmnonic [24] | 0.9761 | 0.9804 |
| Mumford n Shah [25] | 0.9821 | 0.9874 |
| Transport [26] | 0.9701 | 0.9789 |
| Proposed | 0.9819 | 0.9880 |
Table 14: Dice and Jaccard Scores for Comparison Among Different Inpainting Techniques in case of MRI Images (For Patient 1 T2WI).
| MRI Data | ||
| Methodology | Jaccard score | Dice Score |
| Harmnonic [24] | 0.9699 | 0.9795 |
| Mumford n Shah [25] | 0.9801 | 0.9797 |
| Transport [26] | 0.9687 | 0.9697 |
| Proposed | 0.9803 | 0.9797 |
Table 15: Dice and Jaccard Scores for Comparison Among Different Inpainting Techniques in case of MRI Images (For Patient 1 T1WI).
| MRI Data | ||
| Methodology | Jaccard score | Dice Score |
| Harmnonic [24] | 0.9418 | 0.9385 |
| Mumford n Shah [25] | 0.9401 | 0.9393 |
| Transport [26] | 0.9399 | 0.9302 |
| Proposed | 0.9421 | 0.9395 |
Table 16: Dice and Jaccard Scores for Comparison Among Different Inpainting Techniques in case of MRI Images (For Patient 1 T2WI).
| MRI Data | ||
| Methodology | Jaccard score | Dice Score |
| Harmnonic [24] | 0.9385 | 0.9336 |
| Mumford n Shah [25] | 0.9356 | 0.9299 |
| Transport [26] | 0.9287 | 0.9241 |
| Proposed | 0.9379 | 0.9340 |
Further, we investigated the effect of inpainting the MS lesion in the registration step. To do that, we created the ground truth by registering the healthy brain to the brain atlas. We compared the distorted registration output generated by registering an MS brain with the brain atlas with the ground truth. We have found that the Dice and Jaccard value are 0.8566 and 0.8681 respectively. This proves that, lesions create distortion in registration by deviating from the ground truth and this effect can be refurbished through inpainting.
Graphical Analysis
Finally, MRI images are taken and comparison using graphical representation is shown. For Patient 1 to Patient 5, all the images are shown in Fig. 8, Fig. 9 and Fig. 10. These are all with white lesions artificially added with healthy brain tissue.
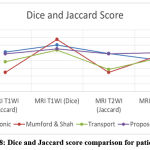 |
Figure 8: Dice and Jaccard score comparison for patient 1. |
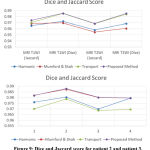 |
Figure 9: Dice and Jaccard score for patient 2 and patient 3. |
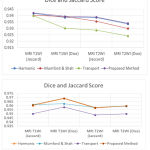 |
Figure 10: Dice and Jaccard score for patient 4 and patient 5. |
Now, Dice and Jaccard scores of Patient 1 with greyish lesions and mixed lesions (orientation 1) is shown in Fig. 11, mixed lesions (orientation 2) for Patient 1 and greyish lesions for patient 2 is depicted in Fig. 12 and mixed lesions (orientation 1 and orientation 2) for patient 2 is shown in Fig. 13.
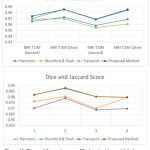 |
Figure 11: Dice and Jaccard scores of Patient 1 with greyish lesions and mixed lesions (orientation 1) |
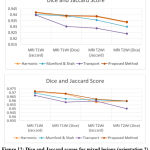 |
Figure 12: Dice and Jaccard scores for mixed lesions (orientation 2) for Patient 1 and greyish lesions for patient 2 |
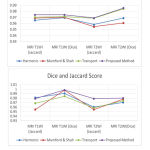 |
Figure 13: Dice and Jaccard scores for mixed lesions (orientation 1 and orientation 2) for patient 2 |
Conclusion
A study of the potential of using a novel inpainting technique for simple registration measurements has been performed in this study. The possibility to classify and quantify the samples is dependent on the complexity of the samples. For preliminary testing of the system several patients’ brain tissues were studied for the changes in jaccard and dice scores using our technique and differences observed were satisfactory. Some more experiments are to be carried out using more robust algorithm in order to increase the understanding of the results. Next images with good resolution will be studied using this algorithm to see if the results are reproducible and if significant differences can be obtained between different states of the same tissue. In future, MS lesions after inpainting, nonlinear registration will be used to perform similar studies and to compare with pathological diagnosis.
Acknowledgement
Data were provided [in part] by the Human Connectome Project, WU-Minn Consortium (Principal Investigators: David Van Essen and Kamil Ugurbil; 1U54MH091657) funded by the 16 NIH Institutes and Centers that support the NIH Blueprint for Neuroscience Research; and by the McDonnell Center for Systems Neuroscience at Washington University. There is no conflict of interest among the authors.
References
- Coles, Alasdair J., Amanda Cox, Emmanuelle Le Page, Joanne Jones, S. Anand Trip, Jackie Deans, Shaun Seaman et al. “The window of therapeutic opportunity in multiple sclerosis.” Journal of neurology 253, no. 1 (2006): 98-108.
- Berer, Kerstin, and Gurumoorthy Krishnamoorthy. “Microbial view of central nervous system autoimmunity.” FEBS letters 588, no. 22 (2014): 4207-4213.
- Nakahara, Jin, Michiko Maeda, Sadakazu Aiso, and Norihiro Suzuki. “Current concepts in multiple sclerosis: autoimmunity versus oligodendrogliopathy.” Clinical reviews in allergy & immunology 42, no. 1 (2012): 26-34.
- Fares, Jawad, Anwar H. Nassar, Souheil Gebeily, Firas Kobeissy, and Youssef Fares. “Pregnancy outcomes in Lebanese women with multiple sclerosis (the LeMS study): a prospective multicentre study.” BMJ open 6, no. 5 (2016): e011210.
- David Rodriguez G., Susan D “Global, regional, and national incidence, prevalence, and years lived with disability for 301 acute and chronic diseases and injuries in 188 countries, 1990-2013:” a systematic analysis for the Global Burden of Disease Study 2013.
- World Health Organization (2008). “Atlas: Multiple Sclerosis Resources in the World 2008 Geneva: World Health Organization.” pp. 15–16. ISBN 92-4-156375-3.
- Milo R, Kahana E (March 2010). “Multiple sclerosis: geoepidemiology, genetics and the environment”. Autoimmune Rev 9 (5): A387–94
- David Alexander Dickie, Dominic E. Job, David Rodriguez Gonzalez, Susan D. Shenkin, and Joanna M. Wardlaw “Use of Brain MRI Atlases to Determine Boundaries of Age-Related Pathology: The Importance of Statistical Method” (April 2014).
- Ashburner, John, Jesper LR Andersson, and Karl J. Friston. “High-dimensional image registration using symmetric priors.” NeuroImage 9, no. 6 (1999): 619-628.
- Lakowicz, Joseph R. “Principles of frequency-domain fluorescence Cai, Jian-Feng, Raymond H. Chan, and Zuowei Shen. “A framelet-based image inpainting algorithm.” Applied and Computational Harmonic Analysis 24, no. 2 (2008): 131-149.
- Esedoglu, Selim, and Jianhong Shen. “Digital inpainting based on the Mumford–Shah–Euler image model.” European Journal of Applied Mathematics 13, no. 4 (2002): 353-370.
- Bugeau, Aurélie, Marcelo Bertalmío, Vicent Caselles, and Guillermo Sapiro. “A comprehensive framework for image inpainting.” IEEE Transactions on Image Processing 19, no. 10 (2010): 2634-2645.
- Komori, Mika, Yen Chih Lin, Irene Cortese, Andrew Blake, Joan Ohayon, Jamie Cherup, Dragan Maric, Peter Kosa, Tianxia Wu, and Bibiana Bielekova. “Insufficient disease inhibition by intrathecal rituximab in progressive multiple sclerosis.” Annals of clinical and translational neurology 3, no. 3 (2016): 166-179.
- Lublin, Fred D., and Stephen C. Reingold. “Defining the clinical course of multiple sclerosis: results of an international survey.” Neurology 46, no. 4 (1996): 907-911.
- Nakahara, Jin, Michiko Maeda, Sadakazu Aiso, and Norihiro Suzuki. “Current concepts in multiple sclerosis: autoimmunity versus oligodendrogliopathy.” Clinical reviews in allergy & immunology 42, no. 1 (2012): 26-34.
- Ziemssen, Tjalf, Raimar Kempcke, Marco Eulitz, Lars Großmann, Alexander Suhrbier, Katja Thomas, and Thorsten Schultheiss. “Multiple sclerosis documentation system (MSDS): moving from documentation to management of MS patients.” Journal of Neural transmission 120, no. 1 (2013): 61-66.
- Ascherio, Alberto, and Kassandra L. Munger. “Environmental risk factors for multiple sclerosis. Part I: the role of infection.” Annals of neurology 61, no. 4 (2007): 288-299.
- Tsang, Benjamin KT, and Richard Macdonell. “Multiple sclerosis: diagnosis, management and prognosis.” Australian family physician 40, no. 12 (2011): 948.
- Huntley A (January 2006). “A review of the evidence for efficacy of complementary and alternative medicines in MS”. Int MS J 13 (1): 5–12, 4.
- Brett, Matthew, Alexander P. Leff, Chris Rorden, and John Ashburner. “Spatial normalization of brain images with focal lesions using cost function masking.” Neuroimage 14, no. 2 (2001): 486-500.
- Sdika, Michaël, and Daniel Pelletier. “Nonrigid registration of multiple sclerosis brain images using lesion inpainting for morphometry or lesion mapping.” Human brain mapping 30, no. 4 (2009): 1060-1067.
- McAusland, Jon, Roger C. Tam, Erick Wong, Andrew Riddehough, and David KB Li. “Optimizing the use of radiologist seed points for improved multiple sclerosis lesion segmentation.” IEEE Transactions on Biomedical Engineering 57, no. 11 (2010): 2689-2698.
- Ashburner, John, and Karl J. Friston. “Nonlinear spatial normalization using basis functions.” Human brain mapping 7, no. 4 (1999): 254-266.
- Feng, Changli, Jianxun Zhang, and Rui Liang. “A method for lung boundary correction using split Bregman method and geometric active contour model.” Computational and mathematical methods in medicine 2015 (2015).
- Chan, Tony F., and Jianhong Shen. “Non-texture inpainting by curvature-driven diffusions (CDD).” (2001).
- Mumford, David, and Jayant Shah. “Optimal approximations by piecewise smooth functions and associated variational problems.” Communications on pure and applied mathematics 42, no. 5 (1989): 577-685.
- C. Van Essen, K. Ugurbil, E. Auerbach, D. Barch, T. Behrens, R. Bucholz, A. Chang, L. Chen, M. Corbetta, S. W. Curtiss et al., “The human connectome project: a data acquisition perspective,” Neuroimage, vol. 62, no. 4, pp. 2222–2231, 2012.
- M. Smith, “Fast robust automated brain extraction,” Human brain mapping, vol. 17, no. 3, pp. 143–155, 2002.
- M. Smith and J. M. Brady, “Susana new approach to low level image processing,” International journal of computer vision, vol. 23, no. 1, pp. 45–78, 1997.
- W. Woolrich, S. Jbabdi, B. Patenaude, M. Chappell, S. Makni, T. Behrens, C. Beckmann, M. Jenkinson, and S. M. Smith, “Bayesian analysis of neuroimaging data in fsl,” Neuroimage, vol. 45, no. 1, pp. S173–S186, 2009.
- Farazi, Moshiur R., F. Faisal, Z. Zaman, and S. Farhan. “Inpainting multiple sclerosis lesions for improving registration performance with brain atlas.” In Medical Engineering, Health Informatics and Technology (MediTec), 2016 International Conference on, pp. 1-6. IEEE, 2016.


