Rana A. Hameed
Department of Biology, College of Science, University Al –Mustansiriyah.
Corresponding Author E-mail: dr.alkarkhi@gmail.com
DOI : https://dx.doi.org/10.13005/bpj/1652
Abstract
Thirty two isolates of aerobic gram-negative bacteria associated with Sesbania sesban grown in different saline Iraqi soils was identified according to morphological and physiological characteristics, cultured on yeast-mannitol agar medium (YEMA) supplemented with different NaCl concentrations. It was indicated that 53.12% of isolates were highly tolerant to salinity, tolerated from 4.0 to 5.0 w/v NaCl. All thirty two Rhizobia isolates performed positive strong reaction to Catalase enzyme except for three were negative to this enzyme. Concerning exo-polysaccharide (EPS) production the isolates displayed a significant difference between them and that salt tolerance isolates gave a high amount of EPS production in compare to the sensitive ones. As for antibiotic sensitivity of Sesbania isolates data revealed that 83% of isolates were highly resistant to Ampicilin at 50 µgml-1, the cluster analysis based on all phenotypical and physiological characters divided the isolates into two major groups, the first group included one isolate Ses10, which was salt moderate tolerant. The second group included the rest of isolates which splits into two subgroups with 6% similarity, the first subgroup comprised all sensitive isolates plus one salt moderate tolerant isolate (Ses9).The assumption that district environmental conditions plays a vital role on field survival of bacteria, give rise to the use of PCR methods to identify Rhizobia. In this study the genetic divergence of fast nodulating bacteria connected with Sesbania in Iraq was examined. A selection of Rhizobia isolates were characterized by RAPD –PCR. Amplification of genomic DNA using three random primers (RAPD) gave various bands, the results revealed that most efficient and highest discrimintory power primer was 35.4% and 37% respectively for primer OPA-10. The cluster analysis based on RAPD-PCR amplification results showed two divergent groups with 15% similarity, the first group included two salt sensitive Ses17 and Ses28, and the second major group comprised all salt moderate and tolerant isolates.
Keywords
Molecular; Physiological; Root Nodules; Salt Tolerance; Sesbania
Download this article as:| Copy the following to cite this article: Hameed R. A. Physiological and Molecular Assessment of Sesbania Root Nodules Bacteria from Different Iraqi Areas for Salt Tolerance. Biomed Pharmacol J 2019;12(1). |
| Copy the following to cite this URL: Hameed R. A. Physiological and Molecular Assessment of Sesbania Root Nodules Bacteria from Different Iraqi Areas for Salt Tolerance. Biomed Pharmacol J 2019;12(1). Available from: https://bit.ly/2RWWutW |
Introduction
Nitrogen fixation using biological organisms is a powerful source of nitrogen in the biosphere (200-300 kg N/ha/year), it plays a significant role in nitrogen enhancement of the earth. Leguminous plants by their symbiotic association with certain gram-negative soil bacteria, commonly known as Rhizobia, promote to fix atmospheric nitrogen. Most of rhizobial strains isolated from wild legumes were classified as members of the genera Rhizobium.1
In corporation with rhizobia, Sesbania sesban is a plant growing in various environments, even in salinity areas, drought and arid infertility.2 Salinity influence the survival and multiplication of Rhizobium spp. In rhizosphere and soil, as well as reducing plant growth, photosynthesis, yet rhizobial populations are known to differ in their tolerance to important environment factors.3 In 2009 Ali and his coworker4 indicated that inoculation with salt tolerant strains would improve nitrogen fixing ability and nodulation of the leguminous plants subjected to saline conditions. Also in 2017 Yan and his coworker 5 reported that bacteria associated with Sesbania cannabina could grow weakly in the presence of 5.0% w/v NaCl. Ali (4) revealed that rhizobia isolated from tree legumes Leucaena leucocephala were tolerant up to 2.5-3.5% salinity.
Many Iraqi areas had under gone harmful environmental conditions in the last decades, such like salinity and drought due to miss usage of efficient irrigation systems and low rainfalls. In 2013 Sharma and his coworker6 pointed that the naturally occurring soil rhizobia nodulating legumes plants lived in the desert areas are expected to have higher tolerance to common adverse conditions such as salt stress. While N-fixing legumes tolerant of environmental stresses represent an important procedure to improve agricultural productivity, Rhizobia with genetic potentiality for stress tolerance are evenly vital for efficient nodulation and increase productivity of the host plants.1
Materials and Methods
Different geographical agricultural field sites of Iraqi regions of host plant Sesbania nodule sample were collected. Thirty two isolates were obtained from these regions, the isolates were isolated from nodules after surface sterilization according to Vincent7 and cultured on yeast extract mannitol agar (YEMA) media containing Congo-red dye, petri dish plates were incubated at 28°C in the dark. The bacterial isolates were examined for morphological characteristics and gram-staining reaction as described by Somasegaran and Hoben.8 Rhizobia authenticity for host specificity was studied as demonstrated by Engelke and his coworker.9 The effect of salt on isolates were studied by inoculating one loop full of each isolate on YEMA media in triplicate plates containing 1, 2, 3, 4, 5 w/v% NaCl, growth was compared with control(no NaCl) and evaluated qualitatively according to Somasegaran and Hoben.8 Enzymes activity were examined for Catalase, Urease and Gelatinase enzymes as displayed by Ronald and his coworkers,10 appearance of gas bubble indicate the presence of Catalase enzyme. Intrinsic antibiotics resistance (IAR) were examined by taking freshly prepared, filter sterilized (0.22 µm) solution of antibiotics and added to cooled, molten YEMA media to give the following concentration µg/ml: 10, 25 and 50 of Ampicillin, Erythromycin and Kanamycin. The control treatment was consisted of YEMA plates without antibiotics. Isolates showing growth were scored as positive. Triplicate plates for each antibiotic were incubated at 28°C for 7 days, and scored for growth. For the evaluation of exo polysaccharide production (EPS), a loop full of each Sesbania isolates were inoculated into conical flasks containing 100 ml of yeast extract mannitol broth media. The flasks were incubated at 28°C on revolving shaker at 200 rpm for 72h. After incubation, the broth was centrifuged 3500 xg and the supernatant was mixed with two volumes of chilled acetone. The crude polysaccharide developed was collected by centrifugation at 3500 xg for 30 min. EPS then Was washed with distilled water and acetone alternatively, then transferred to a filter paper and weighed after overnight drying at105°C.
DNA Extraction of Sesbania isolates was done using Wizard genomic DNA purification kit (promega), DNA purity was identified using Shimadzu spectrophotometer, DNA concentration was calculated using the following equation:
ds DNA con. = O.D 260 nm x dilution factor x 50µg /ml (Sambrook et al., 1989). DNA fingerprinting of Sesbania isolates by RAPD-PCR was applied using Master Mix reaction kit and three random primers from Bioneer Coporation (South Korea). Sequence of the primers and the reaction conditions were described in table-1. Amplification products were separated and electrophoresed on 1.5% w/v agarose gel. Total band number were calculated according to Sahi and his coworkers.11
Table 1: RAPD primers and PCR reaction conditions.
| Primer | Sequence from 5‘ to 3‘ end |
| OPA-10 | GTGATCGCAG |
| OPC-16 | CACACTCCAG |
| OPN-16 | AAGCGACCTG |
| PCR reaction condition | |
| Initial denaturizing | 5 min , 94°C |
| Denaturizing | 1 min , 94 °C—- |
| Annealing | 1 min , 32°C | 34cycle |
| Extension | 1 min , 72°C—- |
| Final extension | 1 min , 72°C |
Primer efficiency and primer discriminatory power was measured using the formulas:
Primer efficiency=total number of bands amplified by a primer / total number of bands amplified by all primers x 100.
Primer discriminatory power= the total of polymorphic bands amplified by a primer / total number of polymorphic bands amplified by all primers x 100.12
Statistical analysis for EPS production was done using ANOVA. Significant differences were identified by the least significant difference (L.S.D) multiple mean comparison test at p ≤0.05 (Genestat program software, 2008, VSN International Ltd), as for physiological traits, comparison was performed quantitavelly on the basis of growth + or no growth – for each isolate. PCR fingerprints pattern were converted into a two-dimensional binary matrix (1, presence of a band, 0, absence of a band) and analyzed using statistic software package (version 1.92; past software, Ohammer, 2009).
Results and Discussion
Morphological Characterization
All thirty two Sesbania isolates were comparable in form with translucent gummy glistening, entire margin and circular rounded with diameter of 2.5-3.5mm, except of the isolates (Ses4, Ses5, Ses30 and Ses23) which were little translucent, milky and about 1-2mm in diameter after two days growth. The isolates were tested on Congo red as indicator incorporated with YEMA media, the data showed that all isolates did not absorb Congo red under dark conditions except Ses8, Ses9 and Ses19 that appeared to be pink as a result of taking Congo red. Table- 2 shows the nomination and geographical origin and soil description. All isolates were examined under microscope and it revealed that the isolates were rod, motile and gram-negative cells.
Table 2: Nomination, Geographical origin and soil description of Sesbania isolates.
| Isolate Name | Geographical Origin | EC | Soil description | Isolate Name | Geographical Origin | EC | Soil description |
| Ses1 | Amryia-Fallujah 1 | 5.3 | Arid | Ses17 | Mustansiryia,1 Baghdad | 2.2 | g. irrigate |
| Ses 2 | Amryia-Fallujah 2 | 4.6 | Arid | Ses18 | Mustansiryia 2, Baghdad | 1.7 | g. irrigate |
| Ses 3 | Abu-ghreb 1 | 7.7 | Arid | Ses19 | Rashdiya, Baghdad | 1.2 | g. irrigate |
| Ses 4 | Abu-ghreb 2 | 7.1 | Arid | Ses20 | Zafrania 1, Baghdad | 6.1 | arid |
| Ses 5 | Abu-ghreb 3 | 5.8 | Semiarid | Ses21 | Zafrania 2, Baghdad | 5.7 | arid |
| Ses 6 | Khaluss 1, Diyala | 5.0 | Semiarid | Ses22 | Nasir, Nasiriyah | 3.0 | g. irrigate |
| Ses 7 | Khaluss 2, Diyala | 4.6 | g. irrigate | Ses23 | Fajir 1, Nasiriyah | 4.9 | Semiarid |
| Ses 8 | Khaluss 3, Diyala | 4.5 | g. irrigate | Ses24 | Fajir 2,Nasiriyah | 5.4 | Semiarid |
| Ses 9 | Baquba 1,Diyala | 3.8 | g. irrigate | Ses25 | Mahmodea1, Baghdad | 5.2 | Semiarid |
| Ses 10 | Baquba 2,Diyala | 3.0 | g. irrigate | Ses26 | Mahmodea2, Baghdad | 4.7 | Semiarid |
| Ses 11 | Baquba 3, Diyala | 4.3 | Semiarid | Ses27 | Saydia 1, Baghdad | 3.4 | g. irrigate |
| Ses 12 | Balad 1, Diyala | 5.1 | Semiarid | Ses28 | Saydia 2, Baghdad | 3.2 | g. irrigate |
| Ses 13 | Balad 2, Diyala | 5.4 | Semiarid | Ses29 | Saydia 3, Baghdad | 4.0 | g. irrigate |
| Ses 14 | Seqlawea 1, Baghdad | 1.3 | v.g.irrigate | Ses30 | Mahawel 1, Babel | 5.6 | Semiarid |
| Ses 15 | Seqlawea 2, Baghdad | 1.7 | v.g.irrigate | Ses31 | Mahawel 2, Babel | 5.7 | Semiarid |
| Ses 16 | Seqlawea 3, Baghdad | 2.0 | v.g.irrigate | Ses32 | Mahawel 3, Babel | 6.0 | Semiarid |
Physiological characterization
Salt Stress Response
Viability of Rhizobia isolates grown under various salt concentration using NaCl was measured. Table-3 displayed a high level of variety between isolates, data showed that 53.12% of Sesbania isolates were highly tolerant to salinity, tolerated from 4-5%w/v NaCl and that 18.75% of isolates were salt sensitive, tolerated up to 1.0%NaCl.
Table 3: Salinity tolerating levels of Sesbania isolates.
| Isolate. No | Highest NaCl con. tolerated (%) | Isolate. No | Highest NaCl con. tolerated (%) |
| Ses1 | 4 | Ses17 | 1 |
| Ses 2 | 5 | Ses18 | 3 |
| Ses 3 | 4 | Ses19 | 1 |
| Ses 4 | 5 | Ses20 | 5 |
| Ses 5 | 5 | Ses21 | 5 |
| Ses 6 | 4 | Ses22 | 2 |
| Ses 7 | 3 | Ses23 | 4 |
| Ses 8 | 3 | Ses24 | 4 |
| Ses 9 | 2 | Ses25 | 5 |
| Ses 10 | 2 | Ses26 | 4 |
| Ses 11 | 4 | Ses27 | 3 |
| Ses 12 | 4 | Ses28 | 1 |
| Ses 13 | 5 | Ses29 | 1 |
| Ses 14 | 2 | Ses30 | 4 |
| Ses 15 | 1 | Ses31 | 4 |
| Ses16 | 1 | Ses32 | 2 |
Enzymes Activity
Data in table-4 showed that all isolates gave strong positive reaction to Catalase enzyme except for Ses19, Ses28 and Ses29 were negative for Catalase test. As for Urease the table cleared that 88.23% of salt tolerant isolates were negative for this enzyme comparing to 50% of salt sensitive isolates. In regards to Gelatinase enzyme, results indicated that 70.58% of salt tolerant isolates were negative for Gelatinase production.
Table 4: Enzymes reaction pattern of Sesbania isolates.
| Isolate no. | Catalase | Urease | Gelatinase | Isolate. No | Catalase | Urease | Gelatinase |
| Ses1 | ++ | – | – | Ses17 | + | – | + |
| Ses 2 | ++ | – | + | Ses18 | ++ | + | – |
| Ses 3 | ++ | – | – | Ses19 | + | + | – |
| Ses 4 | ++ | + | – | Ses20 | + | – | – |
| Ses 5 | ++ | – | – | Ses21 | ++ | – | – |
| Ses 6 | ++ | – | + | Ses22 | + | – | – |
| Ses 7 | ++ | + | – | Ses23 | + | – | + |
| Ses 8 | ++ | – | – | Ses24 | ++ | – | – |
| Ses 9 | + | – | – | Ses25 | + | – | – |
| Ses 10 | + | – | – | Ses26 | + | – | + |
| Ses 11 | ++ | – | – | Ses27 | ++ | – | + |
| Ses 12 | ++ | – | – | Ses28 | – | + | + |
| Ses 13 | ++ | – | + | Ses29 | + | + | + |
| Ses 14 | + | + | – | Ses30 | + | + | – |
| Ses 15 | – | – | + | Ses31 | + | – | – |
| Ses16 | – | – | + | Ses32 | + | – | + |
Antibiotic Sensitivity
All thirty two isolates were tested against three kinds of antibiotics in 10, 25, 50 µgml-1 concentration. Table-5 showed that all isolates were highly resistant to Ampicilin at 50 µgml-1 concentration.
Table 5: Antibiotic resistance of thirty two Sesbania isolates.
| Antibiotic | % Resistance of isolates | ||
| 10µgmL-1 | 25µgmL-1 | 50µgmL-1 | |
| Erthromycin | 71 | 42 | 33 |
| Kanamycin | 56 | 44 | 24 |
| Ampicilin | 86 | 85 | 83 |
Exopolysaccharide (EPS) Production
Table-6 showed a significant difference between Sesbania isolates regarding EPS production, the results revealed that salt tolerant isolates gave higher amount of EPS production in compared to sensitive isolates, this is agreed with Freitas and his coworkers as well as Saritha and her coworkers in addition to Alroomi.13-16 The highest production of EPS was recorded for the isolate Ses21 producing 981.2 mg/g EPS, and the least production was found in Ses17 producing 296.6 mg/g EPS. Cluster analysis based on phenotypical and physiological traits divided the isolates into two divergent groups, the first one included one isolate Ses10, which was salt moderate tolerant, and the second main group included the rest of Sesbania isolates which splits into two subgroups with 6% similarity, the first subgroup comprised all sensitive isolates plus one salt moderate (Ses9), and the second subgroup included all salt tolerant and moderate isolates.
Table 6: EPS production in Sesbania isolates(mg/g).
| Isolate | EPS mg/g | Isolate | EPS mg/g |
| Ses1 | 900.1 | Ses17 | 296.6 |
| Ses 2 | 678.3 | Ses18 | 746.3 |
| Ses 3 | 720.8 | Ses19 | 361.0 |
| Ses 4 | 923.6 | Ses20 | 867.3 |
| Ses 5 | 892.6 | Ses21 | 981.2 |
| Ses 6 | 763.3 | Ses22 | 324.6 |
| Ses 7 | 522.1 | Ses23 | 656.8 |
| Ses 8 | 564,9 | Ses24 | 654.0 |
| Ses 9 | 497.9 | Ses25 | 566.3 |
| Ses 10 | 488.9 | Ses26 | 786.2 |
| Ses 11 | 656.6 | Ses27 | 678.2 |
| Ses 12 | 745.6 | Ses28 | 401.0 |
| Ses 13 | 824.2 | Ses29 | 325.3 |
| Ses 14 | 325.6 | Ses30 | 697.4 |
| Ses 15 | 433.3 | Ses31 | 548.9 |
| Ses16 | 312.9 | Ses32 | 300.4 |
Table 7: Fragments amplified by three random primers in eight Sesbania isolates and the efficiency and discriminatory power of each primer.
| Primer | No. of bands amplified in all isolates | Primer efficiency (%) | Primer discriminatory power (%) | |
| Total | polymorphic | |||
| OPA-10 | 11 | 10 | 35.4 | 37.0 |
| OPC-16 | 10 | 8 | 32.2 | 29.6 |
| OPN-16 | 10 | 9 | 32.2 | 33.3 |
| Total | 31 | 27 | – | – |
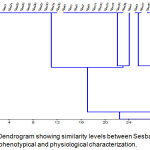 |
Figure 1: Dendrogram showing similarity levels between Sesbania isolates based on phenotypical and physiological characterization.
|
Molecular Characterization
Molecular methods used in this study was applied on eight representative isolates, salt tolerant (Ses2, Ses13, and Ses20), salt sensitive (Ses17 and Ses28) and salt moderate tolerant (Ses7, Ses18, and Ses32). DNA purity ranged from 1.3 _1.7 O.D. The RAPD-PCR amplification products comprised different bands (fig 2,3, and 4), table-6 cleared that most efficient and highest discriminatory power was 35.4% and 37% respectively for the primer OPA-10, also the cluster analysis based on RAPD-PCR products showed two divergent groups with 15% similarity, the first group contained all salt sensitive isolates, while the second group included all salt moderate and tolerant isolates, this group subdivided into two subgroups with 44% similarity, the first subgroup included all salt tolerant isolates which show 100% similarity between them, and the second subgroup comprised the salt moderate tolerant.
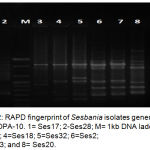 |
Figure 2: RAPD fingerprint of Sesbania isolates generated by primer OPA-10. 1= Ses17; 2-Ses28; M= 1kb DNA ladder; 3=Ses7; 4=Ses18; 5=Ses32; 6=Ses2; 7=Ses13; and 8= Ses20.
|
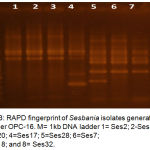 |
Figure 3: RAPD fingerprint of Sesbania isolates generated by primer OPC-16. M= 1kb DNA ladder 1= Ses2; 2-Ses13; 3=Ses20; 4=Ses17; 5=Ses28; 6=Ses7; 7=Ses18; and 8= Ses32.
|
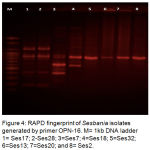 |
Figure 4: RAPD fingerprint of Sesbania isolates generated by primer OPN-16. M= 1kb DNA ladder 1= Ses17; 2-Ses28; 3=Ses7; 4=Ses18; 5=Ses32; 6=Ses13; 7=Ses20; and 8= Ses2.
|
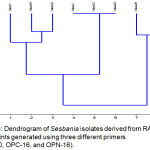 |
Figure 5: Dendrogram of Sesbania isolates derived from RAPD fingerprints generated using three different primers (OPA-10, OPC-16, and OPN-16).
|
Conclusions
This study demonstrated that we could isolate and purify salt tolerant Sesbania isolates from Iraqi soils, the cluster based on physiological and phenotypical traits shows that these isolates represents divers populations and this could offer selection advantage in survival and adaptation to harsh environment conditions. RAPD technique was effectively utilized to discriminate between Sesbania isolates. And the genetic potential for increased tolerance to salinity could improve production of high tolerant inoculum strains for legume plants.
Acknowledgement
The author(s) received no specific funding for this work.
References
- Zahran H. Rhizobium- legume symbiosis and nitrogen fixation under sever conditions and in arid climates. Microbiol Mol. Biol. R. 1999;63:968-989.
- Rao D and Gill H. Biomass and biofertilizer production by Sesbania cannabania in alkaline soil. Bioresour Technol. 1995;53:169-172.
CrossRef - Wei G., Yang X., Zhang Z., Yang Y and Lindstrom K. Strain Mesorhizobium CCNWGX035, a stress tolerant isolate from Glycyrriza glabra displaying a wide host range of no dulation. Pedosphere. 2008;18:102-112.
CrossRef - Ali S., Rawat S., Meghvansi M and Mahna S. Selection of stress-tolerant rhizobial isolates of wild legumes growing in dry regions of Rajasthan, India. ARPN J. Agric. Biol. Sci. 2009;4:13-18.
- Yan J., Li Y., Yan H., Chen W., Zhang X., Wang E., Han X and Xie Z. Agrobacterium salinitolerance sp. Nov., a saline- alkaline- tolerant bacterium isolated from root nodule of Sesbania cannabina. Int. J Syst Evol Microbiol. 2017;67:1906-1911.
CrossRef - Sharma S.,Rao N.,Gokhale T and Ismail S. Isolation and characterization of salt –tolerant rhizobia native to the desert soils of United Arab Emirates. Emir. J. Food Agric. 2013;25(2):102-108.
CrossRef - Vincent j. A manual for the practical study of the root-nodule bacteria International Biological Program. Oxford UK. Blackwell Scientific. 1970.
- Somasegaran P and Hoben H. Handbook of Rhizobia methods in legume-rhizobium technology. Springer-verlag. New York, U.S.A. 1994.
CrossRef - Engelke T., Jagadish M and Puhler A. Biochemical and genetical analysis of Rhizobia meliloti mutants defective in C4-dicarboxylate transport. J. Gen. Microbiol. 1987;133:19-29.
- Ronald M., Lawrence C and Alfred E. Laboratory manual of experimental microbiology. Mosby- Year book Inc. 1995;87-95.
- Sahi J., Akeel H., Hadeel A. Application of the random amplified polymorphic DNA (RAPD) marker to analyze the genetic variability in species of the fungus Ahernaria. J. Raf. Sci. 2011;22(1): 1-16.
- Grudman H., Schneider C.,Hartung D., Daschner F and Pith T. Discriminatory power of three DNA typing techniques for aeruginosa. J. Clin. Microbiol. 1995;3:28-32.
- Freitas A.. Vieira C.,Santos C.,Stamford N and Lyra M. Characterization of rhizobia isolates cultivated in saline soil. Bragantia. 2007;66:497-505.
CrossRef - Saritha B., Raghu M and Mallaiah K. Studies on exopolysaccharide and indole acetic acid production by rhizobium strains from Indigofera. African J. Microbiol. Res. 2009;3(1):0-14.
- Al-roomi R. A. Genetic variations of Sinorhizobium meliloti Iraqi isolates differing in their ability to drought tolerance, DNA diversity and phenotypic characterization. Ph.D.Thesis submitted to Ibn-Al-Haithem, University of Baghdad. 2014.
- Elboutahiri N., Thami-Alami I., El-Houssine Z., Udupa S. M. Physiological and Genetic Diversity in Rhizobium sullaefrom Morocco. Biomedical and life Sciences. 2010;85-88. https://doi.org/10.1007/978-90-481-8706-5_10.
CrossRef - Hameed R.,Hussein N and Al-jabouri A. Phenotypic characterization of indigenous Iraqi Sinorhizobium meliloti isolates for a biotic stress performance. J. OF Life Sciences. 2014;8(1):1-9.


