Sourav Kumar Patnaik, Mansher Singh Sidhu, Yaagyanika Gehlot, Bhairvi Sharma and P. Muthu
Department of Biomedical Engineering, SRM Institute of Science and Technology, Kattankulathur, Chennai, Tamil Nadu, India.
Corresponding Author E-mail: muthu.p@ktr.srmuniv.ac.in
DOI : https://dx.doi.org/10.13005/bpj/1507
Abstract
Dermatological disorders are one of the most widespread diseases in the world. Despite being common its diagnosis is extremely difficult because of its complexities of skin tone, color, presence of hair. This paper provides an approach to use various computer vision based techniques (deep learning) to automatically predict the various kinds of skin diseases. The system uses three publicly available image recognition architectures namely Inception V3, Inception Resnet V2, Mobile Net with modifications for skin disease application and successfully predicts the skin disease based on maximum voting from the three networks. These models are pretrained to recognize images upto 1000 classes like panda, parrot etc. The architectures are published by image recognition giants for public usage for various applications. The system consists of three phases- The feature extraction phase, the training phase and the testing /validation phase. The system makes use of deep learning technology to train itself with the various skin images. The main objective of this system is to achieve maximum accuracy of skin disease prediction.
Keywords
Computer Vision; Deep Learning; Image Recognition; Learning Algorithms; Skin Disease
Download this article as:| Copy the following to cite this article: Patnaik S. K, Sidhu M. S, Gehlot Y, Sharma B, Muthu P. Automated Skin Disease Identification using Deep Learning Algorithm. Biomed Pharmacol J 2018;11(3). |
| Copy the following to cite this URL: Patnaik S. K, Sidhu M. S, Gehlot Y, Sharma B, Muthu P. Automated Skin Disease Identification using Deep Learning Algorithm. Biomed Pharmacol J 2018;11(3). Available from: http://biomedpharmajournal.org/?p=22169 |
Introduction
The Dermatology remains the most uncertain and complicated branch of science because of it complicacy in the procedures involved in diagnosis of diseases related to hair, skin, nails. The variation in these diseases can be seen because of many environmental, geographical factor variations. Human skin is considered the most uncertain and troublesome terrains due to the existence of hair, its deviations in tone and other mitigating factors. The skin disease diagnosis includes series of pathological laboratory tests for the identification of the correct disease. For the past ten years these diseases have been the matter of concern as their sudden arrival and their complexities have increased the life risks.1 These Skin abnormalities are very infectious and need to be treated at earlier stages to avoid it from spreading. Total wellbeing including physical and mental health is also affected adversely. Many of these skin abnormalities are very fatal particularly if not treated at an initial stage. Human mindset tends to presume that most skin abnormalities are not as fatal as described thereby applying their own curing methods. However if these remedies are not apt for that selective skin problem then it makes it even worse. The available diagnosis procedure consists of long laboratory procedures but this paper proposes a system which will enable users to predict the skin disease using computer vision.
Computer Based Diagnosis of Skin Disease
With the increase in medical technology the concept of computer being used for the diagnosis of skin diseases has been around recently. Use of computer technology can make it simpler to detect the diseases just from the images of the infected skin image and could assist the human’s ability to analyze complex information. Artificial Intelligence is taking up automation in all fields of application even in the healthcare field.3
A computer can efficiently and effortlessly interpret a lot of images where it is difficult for the human to interpret such a high number of data and look into the details of the image inside. Therefore Computer-Aided-Detection and Computer-Based-Diagnosis have become desirable and are under development by many research groups.4 Computer based diagnosis have proven to be very helpful in disease diagnosis.
The most prevalent technology which is being used for the prediction is Artificial Intelligence using Machine Learning. Artificial Intelligence uses learning methods to learn about the images to predict the diseases based upon the common patterns. The machine interprets the images and its slices and processes the image and predicts.
Machine Learning
Machine Learning is that branch of computer studies that gives the potentiality to the computer to grasp without being characteristically programmed. Machine learning is employed in a wide range of computing functions where building and designing specific algorithms with better performances is difficult or impractical. Machine Learning is also firmly attached to computational statistics which makes prediction through computers easier and feasible. In commercial terms Predictive Analysis is machine learning used to design multiple algorithms and models that greatly helps the process of prediction. Here the machine learns itself and divide the data provided into the levels of prediction and in a very short period of time gives the accurate results.5
Deep Learning
Deep learning is a part of the broader family of machine learning wherein the learning can be supervised, unsupervised or semi supervised. Deep learning unlike machine learning uses a large dataset for the learning process and the number of classifiers used gets reduced substantially.6 The training time for the deep learning algorithm increases because of the usage of the very large dataset. Deep learning algorithm chooses its own features unlike the machine leaning making the prediction process easier for the end user as it does not use much of pre-processing.7
Supervised Learning
Supervised learning is a data mining chore which concludes a function from a characterized training data which contains series of training instances. Each example, in supervised learning, is a combination comprising of an input object, which usually is a vector, and a desired output response value, also known as the supervisory signal.8
Unsupervised Learning
The problem that arises in both data science world and data mining in an unsupervised learning task is locating the hidden structure in an uncharacterized or unlabeled data. Therefore when the learner is given an unlabeled example, no error or reward signal is present for evaluation of an impending solution.8
Semi Supervised Learning
There is a class of supervised learning techniques and tasks which employs unlabeled data (for training) known as Semi-Supervised learning. This unlabeled data is usually an undersized quantity of labeled data which has a huge quantity of unlabeled data. This type of learning falls in between of supervised (completely labeled) and unsupervised learning (not labeled).9
Materials and Method
Data Set
In this study, a sample data from the complete dataset employed to train the system model is presented in [Fig. 1]. The database is split into; training set, validating/testing set. A training set is adopted for learning to fit the parameters and is specifically applied to alter the varying weights and errors of the system in each training run. Validation/testing set tunes the parameters and is used only to assess the effectiveness and efficiency of the system.
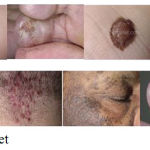 |
Figure 1: Training Data Set.
|
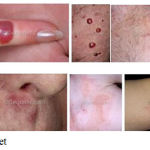 |
Figure 2: Testing Data Set.
|
In this method, the divide mode is set to 90% for the training of the data, 10% for the validating/testing of the data.
Methodology
Development of a widespread plan to test the special features and general functionality on a range of platform combination is firstly initiated by the test process. The procedures used are strictly quality controlled. The method involves use of pre-trained image recognizers with modifications to identify skin images.
The process verifies that the application is bug free and it meets the requirements stated in the requirements document of system.10 The following are the considerations used to develop the framework from developing the testing methodologies.
Module Design Are
Feature extraction module.
Training module.
Validation/ Testing phase.
Mobile Net is considered to have light weight architecture and fast model, more preferred for mobiles and embedded application. With small size (17MB), they are based on streamlined architecture that uses deep-wise separate convolutions.11 Though these process same as inception these have light weights. The other two networks used are Inception V3 and Inception Resnet V2
Inception V3 involves two fragments
Feature extraction part with a convolutional neural network.
Classification part with fully-connected layer.
The pre-trained Inception V3 model attains advanced accuracy in recognition of general materials with 1000 classes, like Zebra, Dalmatian and Dishwasher etc. The model extracts several features from the input images in the feature extraction part and then classifies them established on those obtained features.
In transfer learning, when a new model is built to categorize an original dataset, the feature extraction and classification parts are reused and retrained respectively with the dataset.12 In transfer learning the last layer of the model is trained again with the new dataset so that the model can learn about the application.
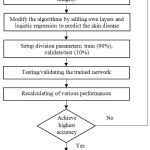 |
Figure 3: Flowchart of the methodology used.
|
Results and Discussions
This study projects a method that uses techniques related to computer vision to distinguish different kinds of dermatological skin abnormalities. We have employed various types of Deep learning algorithms (Inception_v3, MobileNet, Resnet, xception) for feature extraction and learning algorithm (preferably Random forest or Logistic Regression) for training and testing purpose. Using the state of the art architecture considerably increases the efficiency up to 88 percentage. And further more by using ensemble features mapping, combing the models trained using Inception V3, MobileNet, Resnet, Xception a voting based model will be ensembled and thereby increasing the efficiency.13 For enhanced performance and selecting the optimum architecture for the application, we have used logistic regression technique. In this method, the divide mode is set to 90% for the training of the data, 10% for the validating/testing of the data. To characterize the efficiency of a classification model (or “classifier”) on a set of test data for which the true values, a table of confusion matrix is used.
Result of Inception V2
Confusion Matrix for Inception V2 is displayed in (Fig. 4.) and the diagonal in the matrix describes about the accuracy of the algorithm. So in this case the highest correct answers were for the 14th prediction and 14th label. X-axis depicts Prediction and Y-axis depicts Labels.
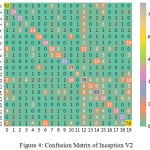 |
Figure 4: Confusion Matrix of Inception V2.
|
Table 1: Results Of Inception V2.
| No. of Diseases | Precision | Recall | F1 – Score |
| 0 | 0.70 | 0.79 | 0.78 |
| 1 | 0.60 | 0.61 | 0.75 |
| 2 | 0.77 | 0.79 | 0.73 |
| 3 | 0.77 | 0.71 | 0.76 |
| 4 | 0.65 | 0.76 | 0.75 |
| 5 | 0.76 | 0.74 | 0.75 |
| 6 | 0.76 | 0.77 | 0.77 |
| 7 | 0.70 | 0.79 | 0.73 |
| 8 | 0.70 | 0.71 | 0.70 |
| 9 | 0.79 | 0.70 | 0.74 |
| 10 | 0.79 | 0.83 | 0.75 |
| 11 | 0.77 | 0.77 | 0.75 |
| 12
13 |
0.89
0.72 |
0.70
0.66 |
0.78
0.79 |
| 14
15 |
0.77
0.64 |
0.78
0.72 |
0.67
0.67 |
| 16 | 0.78 | 0.66 | 0.67 |
| 17 | .76 | 0.73 | 0.79 |
| 18 | 0.78 | 0.64 | 0.66 |
| 19 | 0.70 | 0.61 | 0.71 |
| Total | 0.78 | 0.78 | 0.77 |
The efficiency of inception V2, as presented in Table I is Rank-1: 68.15%, Rank-5: 85.62%.
Result of Inception V3
Confusion Matrix for Inception V3 is displayed in (Fig. 5.) and the diagonal in the matrix describes about the accuracy of the algorithm. The highest correct answers were for the 14th prediction and 14th label.
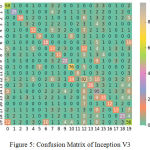 |
Figure 5: Confusion Matrix of Inception V3.
|
Table 2: Results Of Inception V3.
| No. of Diseases | Precision | Recall | F1 – Score |
| 0 | 0.77 | 0.77 | 0.66 |
| 1 | 0.69 | 0.74 | 0.71 |
| 2 | 0.78 | 0.77 | 0.72 |
| 3 | 0.73 | 0.71 | 0.75 |
| 4 | 0.73 | 0.71 | 0.72 |
| 5 | 0.73 | 0.76 | 0.73 |
| 6 | 0.77 | 0.75 | 0.76 |
| 7 | 0.76 | 0.73 | 0.75 |
| 8 | 0.78 | 0.71 | 0.79 |
| 9 | 0.75 | 0.78 | 0.71 |
| 10 | 0.67 | 0.82 | 0.74 |
| 11 | 0.62 | 0.76 | 0.79 |
| 12 | 0.78 | 0.73 | 0.70 |
| 13 | 0.66 | 0.77 | 0.61 |
| 14 | 0.74 | 0.66 | 0.70 |
| 15 | 0.79 | 0.77 | 0.78 |
| 16 | 0.71 | 0.76 | 0.76 |
| 17 | 0.85 | 0.85 | 0.80 |
| 18 | 0.78 | 0.76 | 0.87 |
| 19 | 0.77 | 0.79 | 0.78 |
| Total | 0.78 | 0.79 | 0.78 |
The efficiency of inception V3, as presented in Table II is Rank-1: 79.07%, Rank-5: 88.28%.
Results of Mobile Net
Confusion Matrix for MobileNet is displayed in (Fig. 6) and the diagonal in the matrix describes about the accuracy of the algorithm. So in this case the highest correct answers were for the 14th prediction and 14th label. X-axis depicts Prediction and Y-axis depicts Labels.
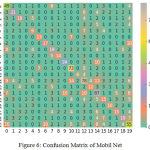 |
Figure 6: Confusion Matrix of Mobil Net.
|
Table 3: Results Of Mobile Net.
| No. of Diseases | Precision | Recall | F1 – Score |
| 0 | 0.48 | 0.65 | 0.55 |
| 1 | 0.48 | 0.46 | 0.47 |
| 2 | 0.41 | 0.42 | 0.41 |
| 3 | 0.09 | 0.04 | 0.05 |
| 4 | 0.24 | 0.23 | 0.24 |
| 5 | 0.62 | 0.52 | 0.57 |
| 6 | 0.45 | 0.42 | 0.44 |
| 7 | 0.33 | 0.34 | 0.33 |
| 8 | 0.44 | 0.39 | 0.41 |
| 9 | 0.51 | 0.52 | 0.52 |
| 10 | 0.64 | 0.78 | 0.71 |
| 11 | 0.38 | 0.27 | 0.32 |
| 12 | 0.52 | 0.50 | 0.51 |
| 13 | 0.39 | 0.28 | 0.32 |
| 14 | 0.53 | 0.60 | 0.56 |
| 15 | 0.30 | 0.27 | 0.28 |
| 16 | 0.48 | 0.38 | 0.43 |
| 17 | 0.39 | 0.29 | 0.34 |
| 18 | 0.41 | 0.38 | 0.40 |
| 19 | 0.44 | 0.48 | 0.46 |
| Total | 0.46 | 0.47 | 0.46 |
The efficiency of MobileNet, as presented in Table III is Rank-1: 46.72%, Rank-5: 69.12%.
Predictions
These are the images in (Fig. 7) which were predicted upon running the algorithm. The image pops out with the written message of, what is predicted by the algorithm.
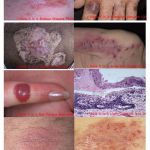 |
Figure 7: Predictions pop ups.
|
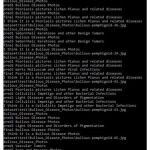 |
Figure 8: Command window predictions 1.
|
The results in (Fig. 8 and 9) were the predictions for all the three algorithms and the final result is displayed according to the majority or the algorithm with highest accuracy.
 |
Figure 9: Command window predictions 2.
|
Conclusion
In this work a model for prediction of skin diseases is done using deep learning algorithms. It is found that by using the ensembling features and deep learning we can achieve a higher accuracy rate and also we can go for the prediction of many more diseases than with any other previous models done before. As the previous models done in this field of application were able to report a maximum of six skin diseases with a maximum accuracy level of 75%. By implementing deep learning algorithm we are able to predict as many as 20 diseases with a higher accuracy level of 88%. This proves that deep learning algorithms have a huge potential in the real world skin disease diagnosis. If even a better system with high end system hardware and software with a very large dataset is used the accuracy can be increased considerably and the model can be used for clinical experimentation as it does have any invasive measures. Future work can be extended to make this model a standard procedure for preliminary skin disease diagnosis method as it will reduce the treatment and diagnosis time.
References
- Yasir R.M.d, Rahman A and Ahmed N. Dermatological Disease Detection using Image Processing and Artificial Neural Network. 8th International Conference on Electrical and Computer Engineering. December 2014.
- Arifini S.M, Kibria G, Firoze A .M, Amini A,Yan H. Dermatological Disease Diagnosis Using Color-Skin Images, 2012 International Conference on Machine Learning and Cybernetics. July 2012.
- Bannihatti V.K, Sujay S.K, Saboo V. Dermatological Disease Detection using Image Processing and Machine Learning. Artificial Intelligence and Pattern Recognition (AIPR) International Conference on. 2016;1-6.
- Doi K. Computer-Aided Diagnosis in Medical Imaging: Historical Review, Current Status and Future Potential. Computerized Medical Imaging and Graphics. June 2007.
- Domingos P. A Few Useful Things to Know about Machine Learning, Department of Computer Science and Engineering, University of Washington, Seattle, WA, U.S.A.
- Station B. Machine Learning 101 | Supervised, Unsupervised, Reinforcement & Beyond, Towards Data Science, Available: https://towardsdatascience.com/machine-learning-101-supervised-unsupervised-reinforcement-beyond-f18e722069bc. Accessed. 2018 March;29.
- Zhang J, Han J, Liu T, Zhou J, Suni and Luo J. Safety prediction of rail transit system based on deep learning, 2017 IEEE/ACIS 16th International Conference on Computer and Information Science (ICIS), Wuhan. 2017;851-856.
- Anitha G.K, Deepak M.C. Machine Learning Techniques for learning features of any kind of data: A Case Study. International Journal of Advanced Research in Computer Engineering & Technology (IJARCET). 2014 December;3(12).
- Weston J. Large-Scale Semi-Supervised Learning, NEC LABS America, Inc., 4 Independence Way, Princeton N.J, USA. Available: http://www.thespermwhale.com/jaseweston/papers/largesemi.pdf. Accessed: 2018;March:30.
- Afzal W. Metrics in Software Test Planning and Test Design Processes, School of Engineering, Blekinge Institute of Technology, Sweden. January 2007.
- Andrew G.H, Zhu M,Chen B, Kalenichenko D, Wang W, Weyand T, Andreetto M, Adam H. Mobile Nets: Efficient Convolutional Neural Networks for Mobile Vision Applications.Google Inc., arXiv:1704.04861v1 [cs.CV]. April 2017.
- Flow T. Image Recognition | TensorFlow, Available: https://www.tensorflow.org/tutorials/image_recognition. Accessed. 2018 March;28.
- Nidhal K, Abbadi A, Saadi N.D, Muhsin A, AL-Dhalimi and Restom H. Psoriasis Detection Using Skin Color and Texture Features. Journal of Computer Science. 2010;6(6).


