Saif S. Abbas1 , Israa H. Al-Ani1
 , Wael A. Abu Dayyih2
 , Ghaleb Oriquat1 and Samira F. Hassan1
1Al-Ahliyya Amman University, Amman, Jordan.
2University of Petra, Amman, Jordan.
Corresponding Author E-mail: ialani@ammanu.edu.jo
DOI : https://dx.doi.org/10.13005/bpj/1375
Abstract
Ivabradine is a new hyperpolarization-activated cyclic nucleotide-gated channel (HCN) blocker. It has been approved by the FDA in 2015 as a part of management of stable angina and congestive heart failure. The aim of this study was to investigate the possibility of pharmacokinetic interaction of a proposed combination of ivabradine and the β- blocker carvedilol in rats using spectroscopy technique. A simple, rapid and sensitive method for validation and determination of ivabradine and carvedilol in the rats’ plasma was developed using HPLC/MS. The method was successfully developed and validated in terms of linearity, precision and accuracy which were within the values accepted by European Medical Agency and International Conference of Harmonization guidlines. Ivabradine and Carvedilol were given both intravenously and orally each alone and as oral combination to fasted Sprague- Dawley rats. Blood samples were withdrawn on scheduled time intervals up to 36 hours and analyzed for each drug. Results showed significant increase in bioavailability of both drugs in combination specially on elimination level expressed in decrease clearance and increase in the half-life for both drugs. In conclusion, a significant kinetic interaction occurred when ivabradine was given orally with carvedilol which makes dose adjustment of both drugs of much importance.
Keywords
Ivabradine; Carvedilol; Pharmacokinetic Interaction; HPLC/MS
Download this article as:| Copy the following to cite this article: Abbas S. S, Al-Ani I. H, Abu-Dayyih W. A, Oriquat G, Hassan S. F. Investigation of Possible Pharmacokinetic Interaction Between Ivabradine and Carvedilol in Rats Using High Performance Liquid Chromatography/Mass Spectroscopy. Biomed Pharmacol J 2018;11(1). |
| Copy the following to cite this URL: Abbas S. S, Al-Ani I. H, Abu-Dayyih W. A, Oriquat G, Hassan S. F. Investigation of Possible Pharmacokinetic Interaction Between Ivabradine and Carvedilol in Rats Using High Performance Liquid Chromatography/Mass Spectroscopy. Biomed Pharmacol J 2018;11(1). Available from: http://biomedpharmajournal.org/?p=19321 |
Introduction
Heart failure(HF) is a condition in which the heart can’t pump enough blood to meet the body’s needs. In some cases, the heart can’t be filled with enough blood. In other cases, the heart can’t pump blood to the rest of the body with enough force. Some people have both problems.1-5
The term “congestive heart failure” (CHF) refers to the state in which decreased heart function is accompanied by accumulation of body fluid in the lungs and elsewhere (Medical Dictionary, 2011). Heart failure may be reversible, and people may live for many years after the diagnosis is made. CHF may occur suddenly, or it may develop gradually.6-8 When heart assignment deteriorates over years, one or more conditions may exist.9-13
The treatment of HF (according to the American Heart Association); involves prescribing one or more of oral medications of; β-blockers, angiotensin converting enzyme (ACE) –inhibitors, diuretics, Aldosterone antagonists, antiplatelets and statins. Other medications are prescribed according to the patient’s condition, age and severity of the case.14-16
So, combination therapy is usual in this disease due to the inability to control the heart’s function and the stability of the cardiovascular system by single medication.
Ivabradine (IVA) is a newly approved medication for stable angina and HF by FDA in April 2015. Few trials of combination therapies of IVA with other medication are proposed and studied. Among these, the trial of Bagriy et al. which showed promising results on the improvement of patients health state specially during exercise.17 Other study by Bocchi et al 18 proved improvement of heart function when IVA was prescribed with different β-blockers. These studies depend on measurement of heart function when these combinations are prescribed to patients. No study reported studying possible pharmacokinetic interaction between IVA and the widely prescribed β-blocker “Carvedilol” (CAR).
Objective of Study
The aim of this study is to investigate the possibility of pharmacokinetic interaction of a proposed oral combination of IVA and the β-blocker CAR in rats using HPLC/Mass spectroscopy technique (LC/MS).
Methodology
Reagents
Carvedilol and Ivabradine hydrochloride (Sycheem pharma), Ticlopidine (trumpharma code TICL10G101288), Formic acid(Tabuk #WS/085/13),Methyl t-Butyl Ether of HPLC/ACS grade (Fisher scientific), Acetonitrile ( HPLC/SPECTRO) grade ,Fisher scientific) ,Methanol (HPLC/SPECTRO grade ,Fisher scientific), Rat plasma, harvested from Animal house in University of Petra.
Instrumentation
Vortex mixer IKA (36 samples), Centrifuge ( Eppendorf centrifuge 5810 R), Balance ( Mettler (AT250,Analytical balance),Freezer, -20ºC,-70ºC (Hitachi), Refrigerator, 2-8ºC (Hitachi), HPLC (Agilent 1200 Series) equipped with API 4000, Applied Biosystems, MDS SCIEX. Detector, Analyte 1.6 software, solvent delivery system pump (agilent 1200), and an autaomatic sampling system (agilent 1200). Separation was achieved using a 100mm*4.6 mm C8, ACE, reversed phase column with average size of 5.00 µm. the chromatographic data analysis was performed with computer system (Windows XP, SP3).
Chromatographic Conditions
The HPLC conditions were set as in table (1). The mobile phase consisted of acetonitril (ACN): water (50:50%) + formic acid (FA) 0.1%. (500 ml) ACN and (500 ml) distilled deionized water were measured accurately, mixed in a volumetric flask and were shaken well, then (1000 μl) of FA was added and the mixture was shaken very well.
Table 1: Chromatographic conditions
| HPLC conditions | Pump flow rate | Autosampler injection volume | AutosamplerTemp. | Column oven temp. | ||
| 0.700 ml/min | 10 ml | 5oC. | 40oC | |||
| Chromatography | Mobile phase | ACN: water (50:50%) + FA 0.1%. (500 ml) | ||||
| Column type | 100mm*4.6 mm C8, ACE, reversed phase column with average size of 5.00 µm | |||||
| Retention times | CAR» 2.35 min. | IVA
» 1.64 min. |
Ticlopidine (IS)
» 1.87 min. |
|||
Preparation of Stock and Working Solutions
Preparation of Stock and Working Solutions of Ticlopidine (IS)
A stock solution of ticlopidine (IS) of 1 mg/ml was prepared by dissolving 10mg of ticlopidine in 10ml distilled deionized water. Working solutions of IS was prepared by taking 10 µl and diluted to 100 ml by distilled deionized water and mixed by Vortex. The resultant concentration is (100 ng/ml). Further dilution was made to 10 ng/ml.
Preparation of Stock and Working Solutions of CAR and IVA
A stock solution of CAR at a concentration of (1 mg/ml) was prepared in Dilutions were made by distilled deionized water toconcentration (2 µg /ml).The same procedure and dilutions wede made for IVA.
Preparation of CAR and IVA Solutions for the Preparation of Calibration Standards and QC Samples
From the working solutions of CAR and IVA (2 µg/ml), series of calibration standard solutions were spiked in 30 µl plasma to produce concentrations (0.1, 0.2, 0.5,2,5, 10,15,20 and 65 ng/ml) for both drugs for the calibration standards.
For QC samples, three samples (QCLow, QCmed and QCHigh) were prepared. The total rat plasma volume used was also equal to (300 µl) and the spiked volume was equal to (30 µl). Concentrations of QC samples were 0.3, 8.0, 17.0 ng/ml for both drugs respectively.
Method Validation
CAR and IVA method validation included (precision, accuracy, linearity, stability and recovery) has been considered in compliance with EMEA 2011 and US FDA 2001 regulation for the present trail bioanalytical method validation and development.
Precision and Accuracy
The intra-day precision and accuracy of the method was determined by analysis of 6 replicates of the lower limit of quantification (LLOQ) and QC levels in the same day. The inter-day variability was determined by analysis of three runs of the lower limit of quantification (LLOQ) and QC levels in three different days. The relative standard deviation values (RSD) or CV% were calculated from the ratios of the standard deviation (SD) to the mean and expressed as percentage.
The accuracy of the method was determined by comparing practical amounts recovered from the control samples with actual values present in the samples (theoretical values). The acceptable limits of intra-day and inter-day accuracy and precision were below 15% except at the LLOQ, for which accuracy and precision should be below 20% according to EMEA.
Linearity
The calibration curve of each of CAR and IVA is a plot of the peak area ratio (PAR) of the drug to the internal standard as a function of the drug concentration (C). This gives the following equation: PAR = Slope × C + Intercept. The slope and the intercept are determined from the determined PAR and the nominal concentration of the drug. The unknown CAR or IVA concentrations are determined from this equation.
Linearity of the plotted curve is evaluated through the value of the correlation coefficient (R).
Six calibration curved were constructed; (Oral CAR, oral CAR in combination, I.V CAR, oral IVA, oral IVA in combination, I.V IVA).
Stability
Stability of CAR and IVA in rats’ plasma were evaluated using low and high QC samples (blank plasma spiked with CAR or IVA at a concentration of a maximum of 3 times the LLOQ and to the ULOQ) which are analyzed immediately after preparation and after 6 hours at room temperature. The mean concentration at each level should be within ±15% of the nominal concentration.
Recovery
Three samples of each of QCLow, QCmed, and QC High were prepared in plasma and same samples in solution, extracted and injected to be analyzed, then compare the results.
Extraction method
The procedures described are to be applied for subject samples and for the extraction of calibration standards and quality control samples of both CAR and IVA.
Thirty (30) ml of serial solution into blank plasma were added to 270 µl of blank plasma/(300 µl) of spiked plasma into pre-labled tube. Then, 50 ml of IS Ticlopidine working solution (10 ng /ml) were added and vortexed for 10 seconds. Five (5) ml of t- Butyl Methyl Ether was then dispensed and vortexed for 5 minutes. Samples then were centrifugated at 3400 rpm for (5)min, at 10ºC , then freezed at (-70) for about (30)min.
The organic layer was then decanted in another labeled clean test tube and the solvent was evaporated under a stream of compressed air at room temperature.( this step should be conducted in the fume hood). Then the residue was dissolved in (200 µl) of mobile phase and vortex for one minute to reconstitute and finally transferred to the auto-sampler rack.
Preclinical Study
CAR and IVA doses were selected based on maximum daily doses of adult human. Since both drugs are known to have high first-pass effect, higher oral doses were selected.
IVA was given I.V (60µg) in 1 ml as sterile solution as single dose and orally 72 µg in 1 ml as oral solution single dose. Solutions were prepared from freshly 1mg/ml stock solution of IVA in distilled deionized water. The I.V solution was filtered through 0.22 micron filter membrane to make it sterile for injection.
CAR was given intravenously in a dose of 140 µg dissolved in 1 ml of 50:50 water:ethanol as single dose and orally 200 µg in one ml also as single dose. The solutions were also prepared from freshly prepared 1mg/ml stock solution. The I.V solution was filtered through 0.22 micron filter membrane as with IVA.
Forty Sprague Dawley male rats were used in this study. They were in healthy condition, and treated according and in compliance with FELASA guidelines, Federaration of European Laboratory Animal Science Association. The study protocol was approved by Research committee (August, 2016), by Faculty of Pharmacy and Medicinal Sciences, Al Ahliyya Amman University, Amman Jordan.
Average rats weight was equal to 200 g ±15 g .They were placed in air-conditioned environment (20-25oC) and exposed to a photoperiod cycle (12 hours light/12 hours’ dark) daily. All rats fasted 12 hr before experiment day.
The rats were divided into 5 groups, each group contained 8 rats. Group 1 received I.V IVA injected by small needle in the tail’s vein. Group 2 received oral IVA by oral gavage. While group 3 received I.V CAR by the same method and group 4 received oral CAR. Group 5 received combination of oral IVA solution and CAR solution given successively.
Blood samples were taken from the rats at the following time points 20min, 40min, 1hr, 1.5hr, 3hr, 6hr, 10hr, 24hr and 36hr. Blood samples were drawn by making a clean insecion in the tail and letting blood dropping into an Ethylenediaminetetraacetic acid (EDTA) containing micro-tubes, marked and numbered in order. Blood samples were immediately centrifuged at 5000 RPM for 5 minutes, plasma was obtained and placed into labeled eppendorf tubes and stored at -20ºC till analysis.Each sample was analyzed separately without pooling to ensure result and validity. Drugs were extracted according to the method of extraction described above.
Pharmacokinetic Study
After the construction of Cp vs. t profile by plotting average plasma concentration of each drug in ng/ml vs. time in hours, the pharmacokinetic analysis was performed.
Non compartmental analysis serves as an easy method to calculate kinetic parameters from plasma data. Key kinetic parameters (elimination rate constant and clearance) are calculated from I.V data to exclude any variation due to absorption phase and first –pass effect. Then, other parameters were all calculated for CAR and IVA alone and in combination (orally) and then compared statistically.
Non compartmental analysis was performed using Microsoft excel® 2010 The following kinetic parameters calculated were the following: Cmax , Tmax, AUC-36, AUC-∞, AUMC 0-36, AUMC 0-∞ , MRT 0-36, MRT0-∞ Kel (elimination rate constant), t1/2 (elimination half-life), Cl (clearance), V/F (volume of distribution after oral dosing), MAT0-36, MAT0-∞, F (extent of bioavailability). These parameters were calculated for all data of the five groups.
Statistical Analysis
All samples readings were taken each time from 8 animals and the concentration was expressed as mean ±SD. All kinetic parameters were also calculated for each animal and expressed as Mean±SD and standard error of the mean (SEM) Using Kinetica®, version4.
Unpaired Students t-test was used to detect any variation in each kinetic parameter using C.I as 95%.
Results and Discussion
Validation
The method validation was performed for CAR and IVA described HPLC-MS method to demonstrate the reliability of a particular method for the determination of the drug concentration in a rat plasma. Figure 1-3 show the chromatogram of CAR and IVA blank, and IS(ticlopidine) rat plasma sample after 1 hour.
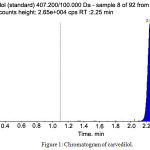 |
Figure 1: Chromatogram of carvedilol.
|
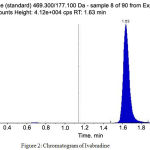 |
Figure 2: Chromatogram of Ivabradine
|
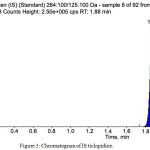 |
Figure 3: Chromatogram of IS ticlopidine.
|
Accuracy and Precision
During the current method validation, Coefficient of variation (%CV) values of CAR were reported to range from as low as 2.74% for a set concentration equal to 8 ng/ml relevant to the QCMed samples, that comes within the accepted range of ±15% of the calculated mean concentration (6.83 – 9.29) ng/ml, reaching to a maximum of 10.88% recorded for the QCHigh at a predefined concentration of 17 ng/ml, which typically fits within accepted range of 15% of the calculated mean concentration (14.40 – 19.60) ng/ml.
These CV% values indicate an appreciable significant precision which highly complies with EMEA 2004 and US.FDA 2010 regulation and guidelines. Data is shown in tables (2)and (3).
While CV% for LLOQ and QCLow were reported to be equal to 5.94% and 6.715402%, respectively. Again, these outcomes indicate good precision that reflect reliability and validity of current trail outcomes.
Table 2: Intra – day Precision and Accuracy data for CAR.
| LLOQ | QCLow | QCMid | QCHigh | |
| Target conc. | 0.100 ng/ml | 0.3 ng/ml | 8 ng/ml | 17ng/ml |
| Calculated conc. ±SD | 0.116± 0.007 ng/ml | 0.331±0.022ng/ml | 8.621±0.760ng/ml | 17.30±1.88 |
| SE | 0.0024 | 0.0077 | 0.268 | 0.664 |
| Accuracy±SD | 115.658±6.876 | 110.55±7.42% | 112.343±3.08 | 101.80±11.08 |
| CV% | 5.972 | 6.687 | 2.746 | 10.88 |
| Range | 0.002-0.010 | 0.312-0.371 | 7.519-9.239 | 15.239-19.42 |
Table 3: Intra – day Precision and Accuracy data for IVA.
| LLOQ | QCLow | QCMid | QCHigh | |
| Target conc. | 0.100 ng/ml | 0.300 ng/ml | 8.00 ng/ml | 17.00 ng/ml |
| Mean Calculated conc. ±SD | 0.101±0.018 ng/ml | 0.391±0.020 ng/ml | 8.700±0.414 ng/ml | 16.862±3.206 ng/ml |
| SE | 0.0063 | 0.0070 | 0.146 | 1.133 |
| Accuracy±SD | 102.488±19.141 | 106.537±6.856 | 108.752± 5.162 | 99.186±18.860 |
| CV% | 18.677 | 6.435 | 4.747 | 19.015 |
| Range | 0.08-0.15 ng/ml | 0.298-0.350 | 7.990±9.074 | 10.544±19.631 |
Linearity
Linearity is essential perquisite for a successful and reliable method validation. All the calculated concentration of calibration levels were within ±20% for LLOQ, and ±15% for other QC levels. The (R) values ranged between (0.998 and 0.999). Results showed to be highly accepted and most fit, indicating valid method linearity, as shown in table (4) and figures (4 and 5).
Table 4: Linearity and linear working range of six calibration curves of CAR and IVA data based on the measured concentration.
| Concentration for each Standard Point (ng/ml) | ||||||||||
| CAR (theor.) | 0.1 | 0.2 | 0.5 | 2.00 | 5.00 | 10.00 | 15.00 | 20.00 | 65.00 | R |
| CAR (oral) | 0.120 | 0.193 | 0.466 | 1.356 | 4.356 | 9.712 | 15.958 | 19.995 | 63.343 | 0.999 |
| CAR (oral-comb.) | 0.108 | 0.176 | 0.430 | 1.988 | 5.250 | 11.192 | 14.756 | 21.154 | 62.502 | 0.998 |
| CAR (I.V) | 0.120 | 0.242 | 0.433 | 1.702 | 5.172 | 9.259 | 14.633 | 20.116 | 64.678 | 0.999 |
| IVA(theor.) | 0.1 | 0.2 | 0.5 | 2.00 | 5.00 | 10.00 | 15.00 | 20.00 | 50.00 | R |
| IVA (oral) | 0.110 | 0.210 | 0.490 | 1.800 | 5.030 | 9.660 | 15.100 | 19.610 | 50.790 | 0.999 |
| IVA (oral-comb.) | 0.115 | 0.190 | 0.444 | 2.026 | 4.994 | 10.895 | 14.421 | 23.908 | 51.460 | 0.999 |
| IVA (I.V) | 0.080 | 0.186 | 0.509 | 2.160 | 5.294 | 10.759 | 16.356 | 19.782 | 47.675 | 0.998 |
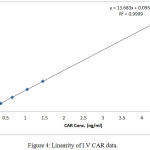 |
Figure 4: Linearity of I.V CAR data.
|
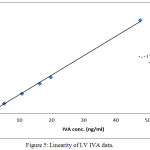 |
Figure 5: Linearity of I.V IVA data.
|
Stability and Recovery
Short-term temperature stability for CAR and IVA
Two sets of QC samples ( low, and high) were prepared. One set (composed of three samples) was immediately extracted (0) hr while the other one (composed of three samples) was extracted (6) hr after being left on the bench at room temperature and Quantified on fresh standard curve. The same procedure was applied on IVA. Results of recovery are presented in tables 5 and 6.
Table 5: Results of short term stability of CAR and IVA
| CAR | ||||||
| Time | QC low Mean±SD | CV% | Stability% | QC high Mean±SD | CV% | Stability% |
| 0 -hr | 0.314±0.0076 | 2.42 | * | 15.135±0.2499 | 1.65 | * |
| 6 – hr | 0.324±0.0156 | 4.81 | 108.00 | 15.176±0.601 | 3.96 | 89.27 |
| IVA | ||||||
| QC low Mean±SD | CV% | Stability% | QC high Mean±SD | CV% | Stability% | |
| 0 -hr | 0.333±0.0082 | 2.46 | * | 15.574±0.5429 | 3.49 | * |
| 6 – hr | 0.328±0.0177 | 5.40 | 109.33 | 15.545±2.33 | 2.33 | 103.63 |
Table 6: Results of recovery of IVA and CAR
| QClow | QCmed | QChigh | |
| CAR % Recovery (range) | 71.585 – 88.561 | 79.74 – 84.65 | 83.13 – 91.39 |
| IVA % Recovery (range) | 90.37 – 95.36 | 90.09 – 92.69 | 88.39 – 94.79 |
Pharmacokinetic Study
Plasma level-time profiles of I.V and IVA and CAR are represented in Fig 6and 7. Oral IVA and CAR alone and in combination are represented in figures 7 and 8.
Oral profiles showed enterohepatic circulation of CAR which is reported in some animal species as mentioned by the FDA approval document of CAR.
The calculated pharmacokinetic parameters of IVA and CAR after I.V doses are given in table7
While PK of both drugs when given alone and in combination are listed in table 8.
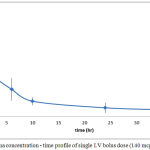 |
Figure 6: Plasma concentration – time profile of single I.V bolus dose (140 mcg) of CAR
|
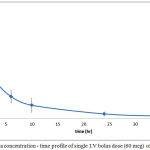 |
Figure 7: Plasma concentration – time profile of single I.V bolus dose (60 mcg) of IVA
|
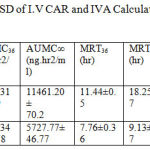 |
Table 7: The mean Kinetic Parameters ± SD of I.V CAR and IVA Calculated by Non compartmental analysis after I.V bolus dose.
|
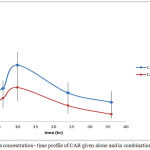 |
Figure 8: Plasma concentration – time profile of CAR given alone and in combination with IVA
|
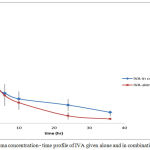 |
Figure 9: Plasma concentration – time profile of IVA given alone and in combination with CAR
|
Results showed significant interaction on kinetic level between the two drugs. Both drugs showed increase in plasma concentrations when given in combination.
The rate of absorption is measured by tmax (time to reach maximum concentration) which reflects how fast the absorption process occurs regardless the mechanism. tmax for CAR did not change when given in combination with IVA. Reaching Cmax in less than half an hour is considered to be very fast rate of absorption. In combination CAR reached higher Cmax but at the same time as given alone which indicated that even if an interaction occurred on absorption level, this interaction did not affect absorption speed.
MAT (mean absorption time) is calculated by subtracting MRT I.V from MRT oral to give approximately the total time consumed by absorption process table ( 8 ). It is not like tmax which can be calculated exactly from data, rather it is calculated based on AUC and AUMC.
For IVA, tmax was elongated from 0.4125±0.15 hr to 0.66±0.17 hr. This change was statistically significant using 5% C.I.
MAT36 increased from 2.41±.57 hr to 5.677±0.97 hr and MAT∞ from 3.28±0.87 hr to 7.807±1.65 hr. The change for all these parameters is significant reflecting some kind of slowing in absorption of IVA in presence of CAR table (8).
This slowing in absorption rate could be attributed to some kind of competition on transporters of IVA by CAR. Specially that CAR is known to be moderate p-gp modifier (The FDA approval).
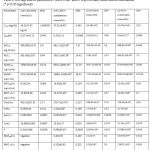 |
Table 8: Average kinetic parameters ± SD of CAR and IVA given orally alone and in combination (*p<0.05 significant)
|
Bioavailability parameters involve Cmax, tmax, AUC and (F) (fraction of drug absorbed).For CAR Cmax was increased significantly on 5% C.I. .Since tmax has not changed, this increase is due to increase in the extent of CAR absorption with concomitant administration of IVA. Also AUC36 and AUC∞ were increased significantly reflecting high increase in the extent of drug absorption.
The extent of bioavailability of CAR when given alone was equal to 0.510±0.096. This low bioavailability is mainly due to high first pass effect. The metabolism of CAR is mainly due to ring oxidation and conjugation with glucouronic acid and bile excretion of the conjugate. Data proved enterohepatic circulation when given alone and in combination. The increase extent of bioavailability reflects either increase in amount of drug absorbed, a decrease in the metabolic activity in the liver or both. Since CAR is known to be highly absorbed both in man and rat, thus, this increase in plasma concentration and extent of bioavailability is most likely due to enzyme inhibition and decreased metabolic activity responsible for the first-pass effect induced by IVA.
For IVA Cmax was also increased significantly associated by significant increase in the tmax , AUC36 and AUC∞ . This means that the extent of drug reaches systemic circulation is much higher when the drug is given concomitantly with CAR. This is further approved by the significant increase in bioavailability of IVA from 0.504±0.060 to 0.798±0.055 in combination. This increase in bioavailability is also highly attributed to the decreased in metabolic activity in the liver induced by CAR and expressed as some kind of enzyme inhibition.
When the increase in Cmax of IVA is associated with increase in tmax this means that even if most of the drug is absorbed, the absorption process is slower in presence of CAR. MAT36 was also increased significantly. CAR is known to be moderate gp-modulator (inhibitor) (The FDA approval). IVA being a water soluble compound, there is possibility of involvement of transporter effect in its absorption. No enough information is available on the exact mechanism of its absorption. If a gp-transporters are involved in its absorption, then the reversible competitive inhibition of these transporters by CAR would result in delay of absorption rate.
The elimination parameters involve Kel, t½ and Cl which describe the overall elimination processes of the drug from the body. All these parameters for both drugs changed significantly when given together, which indicates the effect of each drug on the other’s elimination processes. The major mechanisms reported for CAR is oxidation of ring and side chain. The significant decrease of Kel of CAR from 0.063±002 h-1 when given alone to 0.044±0.01 hr-1 in combination suggests a clear slowing in the elimination process may be due to inhibition of one or more metabolizing enzymes.IVA is non reported to act as enzyme inhibitor for CYP450 in man, but the species variation might play a significant role in studying the pharmacokinetic interactions of this new drug in animal models.
As a result, t½ was increased significantly from 10.980±0.002 hr to 15.5± 0.1 hr and the Cl decreased significantly from 542.19±33.10 ml/hr to 279.71±14.50 ml/hr reflecting slowing in the elimination processes.
MRT is the parameter that measures the mean time of presence of parent drug in the body. It gives the overall time course without identifying the rate of each process. It is calculated by dividing AUMC by AUC to extract the time dimension. MRT36 and MRT∞ of CAR was increased significantly in combination (table8)
Since CAR was absorbed quickly, this elongation in MRT of CAR is most likely attributed to the slowing of elimination processes. No signs of linearity were noticed; beside CAR is reported in literatures to keep linearity (in rats) in much higher doses than the one used in this study [19].(Morgan, 1994).
Regarding IVA, no enough information is available about its metabolism in rats. In human the major pathway of metabolism is through CYP3A4. It also suffers high first–pass effect due to the action of liver and possibly intestinal CYP. When given in combination the Kel , t½, and Cl were changed significantly. These results indicate also an elongation in elimination time and slowing in elimination process probably because of some inhibitory effect of CAR on IVA metabolizing enzymes.
Conclusion
In conclusion, a significant kinetic interaction occurred when ivabradine was given orally with carvedilol expressed as elongation in elimination half-life and higher clearance. This makes dose adjustment of both drugs of much importance if such combination is to be considered.
Acknowledgement
The research team would like to thank Al-Ahliyya Amman University, Triumpharm Research Center in Amman and University of Petra for the support of this work.
References
- Takeshi K and Wilson W. H . Recent advances in treatment of heart failure. F 1000 Res. 2015;4:1475.
- Bagriy A. E., Shchukina E. V., Malovichko S. I., Prikolota A. V. Addition of Ivabradine to carvdilol reduces duration of carvedilol uptitration and improve exercise capacity in patients with chronic heart disease. J Am Coll Cardiol. 2013;61.
- Suzana M. Heart Failure Care: More Than Just Heart Failure. J. Card. Fail. 2017;23(1):10-11.
CrossRef - Hess O. M and Carroll J. D. Clinical assessment of heart failure. In a Libby P., Bonow R. O., Mann D. L. , Zipes D. P., (Eds.), Libby Braunwald’s Heart Disease A Textbook of Cardiovascular Medicine. 8th ed. Saunders. 2007.
- Wood D. Preventing clinical heart failure: the rationale and scientific evidence. Heart. 2002;88(2):15–22.
- Vasan R. S., Colucci W. S., Hassan K., Andreas P., Kalogeropoulos M. D., Faiez Z., Catherine N., Peter W. F., Wilson M. D., Vasiliki V., Georgiopoulou M. Incident Heart Failure in Relation to Vascular Disease. Eur. J. Heart. Fail. 2014;16(5):526–534.
CrossRef - Roger V. L. Epidemiology of heart failure. Circ. Res. 2013;113:646–59.
CrossRef - Burchfield J. S., Xie M., Hill J. A. Pathological ventricular remodeling mechanisms part 1 of 2. Circulat. 2013;128:388–400.
CrossRef - Felker G. M., Hasselblad V., Hernandez A. F., O’Connor C. M. Biomarkerguided therapy in chronic heart failure: a meta-analysis of randomized controlled trials. Am Heart J. 2009;158:422–30.
CrossRef - McMurray J. J., Adamopoulos S., Anker S. D., Auricchio A., Bohm M., Dickstein K. ESC guidelines for the diagnosis and treatment of acute and chronic heart failure. Eur. J. Heart Fail. 2012;14:803–69.
- Poelzl G., Trenkler C., Kliebhan J., Wuertinger P., Seger C., Kaser S. FGF 23 is associated with disease severity and prognosis in chronic heart failure. Eur. J. Clin. Invest. 2014;44:1150–8.
CrossRef - Greenberg B and Kahn A. M. Clinical assessment of heart failure. In: Bonow R. O., Mann D. L., Zipes D. P., Libby P., eds. Braunwald’s Heart Disease: A Textbook of Cardiovascular Medicine. 9th ed. Saunders. 2012;2012:26.
CrossRef - Pitt B., Pfeffer M. A., Assmann S. F. Spironolactone for heart failure with preserved ejection fraction. N. Engl. J. Med. 2014;370(15):1383–92.
CrossRef - Cleland J. G., Tendera M., Adamus J. The perindopril in elderly people with chronic heart failure (PEP-CHF) study. Eur Heart J. 2006;27(19):2338–45.
CrossRef - Flather M. D., Shibata M. C., Coats A. J. Randomized trial to determine the effect of nebivolol on mortality and cardiovascular hospital admission in elderly patients with heart failure. Eur. Heart J. 2005;26(3):215–25.
CrossRef - Desai A. S., Lewis E. F., Li R. Rationale and design of the treatment of preserved cardiac function heart failure with an aldosterone antagonist trial: a randomized, controlled study of spironolactone in patients with symptomatic heart failure and preserved ejection fraction. Am Heart J. 2011;162(6):966–972.
CrossRef - Bagriy A. E., Shchukina E. V., Malovichko S. I., Prikolota A. V. Addition of Ivabradine to carvdilol reduces duration of carvedilol uptitration and improve exercise capacity in patients with chronic heart disease. J Am CollCardiol. 2013;61(10).
- Bocchi E. A., Böhm M., Borer J. S., Ford I., Komajda M., Swedberg K., Tavazzi L. Effect of Combining Ivabradine and β-Blockers: Focus on the Use of Carvedilol in the SHIFT Population. Cardiology. 2015;131(4):218-24.
CrossRef
- Morgan T. Clinical pharma cokinetics and pharma codynamics of carvedilol. Clin. Pharmacokinet. 1994;26:335–46.
CrossRef


