Shipra Saraswat1 , Geetika Srivastava2
 and Shukla Sachchidanand N3
1Department of Computer Science, Amity University Uttar Pradesh India.
2Department of Electronics and Communication, Amity University Uttar Pradesh India.
3Dr. RML Avadh University, Department of Physics and Electronics, Faizabad, India.
DOI : https://dx.doi.org/10.13005/bpj/1284
Abstract
A new approach of automatic classification of atrial fibrillation (AF) arrhythmia is proposed in this paper. Our approach is based on discrete wavelet transform method followed by cross recurrence quantification analysis (CRQA) for extracting the features of experimental ECG signals. The features like laminarity, determinism, entropy, trapping time and transitivity are used for measuring the RQA measures. After that, the classification process has been performed using the concept of probabilistic neural network (PNN) approach. This method is applied to make a differentiation between normal persons and the persons having atrial fibrillation arrhythmia. For testing our approach PHYSIOBANK database of ECG signals have been used. The significance of this classification method has been shown in our Matlab generated results. The outcome of this paper will be very beneficial in treating AF patients. We achieved 100% accuracy by using this method.
Keywords
Atrial Fibrillation; Cross Recurrence Quantification Analysis;Discrete Wavelet Transform; Probabilistic Neural Network
Download this article as:| Copy the following to cite this article: Saraswat S, Srivastava G, Sachchidanand N. S. Wavelet Transform Based Feature Extraction and Classification of Atrial Fibrillation Arrhythmia. Biomed Pharmacol J 2017;10(4). |
| Copy the following to cite this URL: Saraswat S, Srivastava G, Sachchidanand N. S. Wavelet Transform Based Feature Extraction and Classification of Atrial Fibrillation Arrhythmia. Biomed Pharmacol J 2017;10(4). Available from: http://biomedpharmajournal.org/?p=17470 |
Introduction
Electrocardiogram (ECG) is a very popularly performed cardiology test for recording the electrical activity of the heart over a specified period of time by using the electrodes placed on the human body. Health care professionals are using this tool for identifying the various heart disorders. Cardiac arrhythmias are the type of heart disorder in which the heart beats are either too slow (bradycardia), too fast (tachycardia) or may be irregular. Atrial fibrillation arrhythmia is a condition of irregular heart rhythms in the upper chambers of the heart. It is one of the most common type of arrhythmia that can lead to heart attack, blood clots in the heart and sometimes heart failure also.1 Approximately 2.7 million persons in United States are living with this disorder. In this mechanized world, AF may occur in minority of the Shipra patients, presenting with this rhythm disorder. The treatment goals of atrial fibrillation should start with a detailed examination from a cardiologist. Healthcare professionals can use several treatments helping to control the heart rate during AF. The untreated atrial fibrillation can lead to sudden death also. Accurate detection of AF arrhythmia are extremely important for treating arrhythmic patients as well as in other biomedical applications. For carried out this work the MIT-BIH Long Term AF Database (Iafdb) and MIT-BIH Fantasia Database (fantasia) have been used (https://physionet.org/cgi-bin/atm/ATM). Althogh many methods have been proposed during the last many years for correct and reliable detection of AF arrhythmia,2-5 but the objective of this paper is to propose an easy method to classify atrial arrhythmia based on the combined approaches of DWT and CRQA with PNN. This can contribute to timely detection and management of AF patients.
Related Work
ECG monitoring was performed on a group of 22 arrhythmic patients having paroxysmal atrial fibrillation shown the more occurrence of asymptomatic atrial fibrillation than symptomatic atrial fibrillation. It increases the risk of stroke also.6 The study showed the risks of postoperative atrial fibrillation7 based on specific subgroups of patients in order to decrease the after side effects of treatment. The report made on the basis of C- reactive protein elevation in patients with atrial arrhythmias due to the occurrence of sudden changes in the atria.8 It has been observed that atrial fibrillation is more common in adults in the United States. For estimating the prevalence of atrial fibrillation, the adults between 60 to 70 years have observed. The calculated prevalence of AF was 0.95% calculated by.9 A new approach was proposed for catheter ablation of atrial fibrillation for representing a mapping of electro physiologic substrate. It was an ideal target sites for ablations to eliminate atrial arrhythmias. Complex hypothesis testing was used to perform this work.10 A focal source mechanism of AF was treated by using discrete radiofrequency ablation on the basis of 9 patients. A condition of AF called sole cardiovascular for pulling an independent stoke incidence. The findings based on the impact of each cardiovascular condition was associated with the risk of stroke.11 For detecting the ECG signals accurately, a comparison has been made between four popular QRS detection algorithms i.e. Window pair, KNN, Slope vector and Dynamic Plosion index algorithms.12 Beat detection and pressure signal algorithms for ECG are also very important for clinical applications. Using the empirical mode decomposition method, a new beat detection algorithm has been proposed by.13 Results generated by beat detection algorithm are betas of false positive and false negative are 22 and 33 respectively and total failure detection rate was 0.304% against 18,069 beats. The proposed method achieved sensitivity and positive predictivity for ABP signals are 99.58% and 99.85% respectively. Filter banks has been used for reducing the computational complexity of the algorithm. The feature detection in ECG signals can be improved with the help of denoising process. This process is useful in preserving the important locations and peaks of ECG signals.14 An optimized wavelet filter bank approach is proposed for compressing the ECG signals for increasing the efficiency and performance in the bio medical signal processing field.15 A comparative study of several existing and proposed filter banks is also shown in this work. This study is made on the basis of SNR, compression and various other values. The simulation results shown in this paper is clearly depicts the excellent impact of this work in biomedical signal processing field. In the wireless cardiology field, tamper detection of ECG signals can also be possible using watermarked bio hash code. The combination of several bio hashing and reversible watermarking techniques are used to invent an approach for knowing any kind of tampering in ECG signals.16 This method will plays an important role in treating arrhythmic disorders. For detecting hemorrhage, the clinical classification schemes are presented based on the results obtained from the National Registry of Atrial Fibrillation.17 Based on the aetiology, atrial arrhythmia can also be classified with respect to the features like hypertensive, valver etc. Classification has been performed on the basis of temporal patterns of the atrial fibrillation.18 This paper presented the mechanisms of pathophysiology of arrhythmias and its drug treatment also. It is very important to recognize specific drug Pharmacological treatment discussed in this work which may be beneficial in controlling the rhythm and rate control. Figure 1 illustrates the various steps involved in this paper.
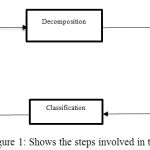 |
Figure 1: Shows the steps involved in this work
|
The outline of this paper are as follows: Section 2 includes the techniques adopted in this work like DWT, RQA and PNN. Section 3 deals with the results and discussion. Section 4 shows the performance evaluation in terms of hit rate, false alarm, tn-ratio, missed hypothesis and accuracy and finally conclusion is mentioned in section 5.
Methodology
Discrete Wavelet Transform
A simple small wave which consists energy with respect to time involved in the analysis of non-stationary and transient signals is called a wave shown in figure 2.
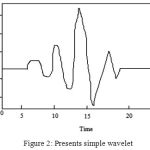 |
Figure 2: Presents simple wavelet
|
A signal of a function called s (t) shown in above displayed figure 2 which can be better analyzed as the total sum of linear decompositions and the product obtained from the coefficients and functions. In the wavelet function, two parameter system is made that one side contains double sum value and the coefficients obtained with two indices. These set of coefficients are namely called the discrete wavelet transform of function s (t). The function of the wavelet series maps the sequence of coefficients namely approximates and details. There are several unconditional properties also in wavelets for providing more and more information about the signal waves.19 Following equation represents smooth function:

In the wavelet transformation, the original experimental signal is transformed using predefined wavelets. The several forms of wavelets occurs are orthogonal, biorthogonal, multi wavelets or scalar. The decomposition process of discrete wavelet is performed on the basis of filter bank theory in which the experimental signals are under went to the down sampling process by 2 for obtaining the filter outputs. The whole process of decomposition is expressed only in two words known as approximation and details. These are the digital filters called as g (n) and h (n) representing the low and high phase values during decomposition process.20
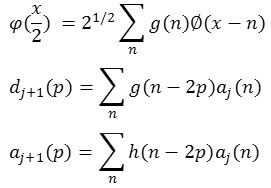
Where the number sets a (j) n represents the resolution of approximate signals 2-j and number sets d (j) n producing the detailed lost signals at 2 –(j-1) at the resolution 2-j.
Recurrence Quantification Analysis
Recurrence quantification analysis (RQA) method was developed for computing different recurrence plots (RPs) on the basis of their small scale structures. This method involves the analysis using RP toolbox for calculating the recurrence behavior of dynamical systems. It involves in the quantification of limited scale structures of recurrence plots presenting the number and length of the recurrences of a system. RQA provides several parameters for measuring the complexity of a system.21 It presents best results even in the case of non-stationary data, where other techniques fail to do so. This method can be applied to any kind of data even in the physiology also. But it is more popular in the field of engineering, chemistry, bio medical, signal processing and many more. In this paper, following RQA measures have been used for calculating the values of signals at specified level of decomposition.22 They are as follows:
Laminarity: It calculates the amount of laminar phases in the dynamical systems. As well as, it measures the length of diagonal and vertical lines.

Where P (v) represents the frequency distribution of length V, having at least minimum length V (min).
Determinism: It deals with the percentage value of recurrence points forming diagonal lines in the recurrence plots in minimum length called length

Where P (L) represents the frequency distribution of the length L, whereas N (l) is the absolute number of diagonal lines.
Entropy: It can be estimated from a probability which depends on a diagonal line has length L. The entropy of this probability is as follows:

Where p (l) represents the frequency distribution of length L.
Trapping Time: It calculates the average length between the vertical lines.

It also analyzes the predictability time of the complex systems.
Transitivity: It estimates the behavior of the scale dependent dimensions.
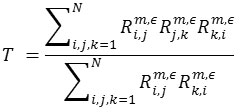
Based on above mentioned formulas of RQA measures, RP toolbox has been used for calculating the values of ECG signals.
Probabilistic Neural Network Classifier
Probabilistic Neural Network (PNN) classifier is based on an artificial intelligence method for mapping f: Rm → Zn. These mappings are implemented by artificial neural network (ANN) based on a group of numerous interconnected artificial neurons govern by human brain23 For achieving specific classification results ANN can be trained with respect to I/P and O/P information database. PNN is basically a distance based ANNs, using some activation function. PNN classifier is more suitable to medical field because it uses Bayesian strategy which makes it more superior in comparison to other AI techniques. PNN has basically four layers: the Input Layer, pattern layer, summation layer and output layer. I/P layer is used for giving input to the hidden layer, pattern layer uses the input for estimating the Euclidean distance between different neurons then summation layer starts training the classifier for obtaining the weighted values of neurons and then output layer produces the output after matching the weighted values of neurons with the help of pattern layer. PNN is very popular because of its fast learning process. In this work, for training and testing the data sets, PNN classifier has been used.
Results and Discussion
For realizing this work, authors have taken the total ten records from MIT-BIH physio bank. The AF signals are taken from long term AF database and normal signals are taken from fantasia database. Firstly the records are decomposed by using the discrete wavelet transformation approach. According to the need of problem, level 5 decomposition is performed based on daubechies wavelet of order 4. Decomposition process is producing output in two words called approximates and details. Every record of ECG signal gone through ten decomposed levels like AC1 to AC5 and DC1 to DC5. In this paper, we have calculated the values of experimental ECG signals based on hundred levels. These values are using for training and testing the classifier for producing output. Figure 3 and 5 shows the experimental AF (abnormal) and normal signal respectively, whereas figure 4 and 6 illustrates the approximate and detail features of abnormal and normal signal respectively.
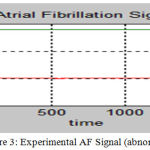 |
Figure 3: Experimental AF Signal (abnormal)
|
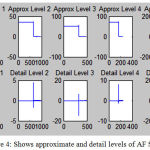 |
Figure 4: Shows approximate and detail levels of AF Signal
|
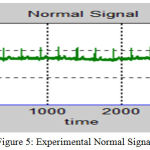 |
Figure 5: Experimental Normal Signal
|
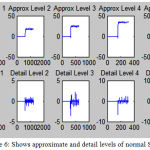 |
Figure 6: Shows approximate and detail levels of normal Signal
|
Once the decomposition is complete, authors are calculating the values of RQA measures based on parameters like laminarity, determinism, entropy, trapping time and transitivity. Table 1 and 2 are producing the RQA values against the respective decomposition levels.
Table 1: Displays the computed RQA measure values based on abnormal (atrial fibrillation) signal
| Records taken from MIT-BIH Long Term AF Database (Itafdb) | |||||
| Decomposition Levels | Laminarity | Determinism | Entropy | Trapping Time | Transitivity |
| Record Number 01 | |||||
| Approx Coeff.1 | 320.5021 | 1.0000 | 6.4603 | 320.5021 | 964.0907 |
| Approx Coeff.2 | 161.1722 | 1.0000 | 5.7708 | Nan | 160.5000 |
| Approx Coeff.3 | 81.1904 | 0.9999 | 5.0824 | 81.1914 | 80.2571 |
| Approx Coeff.4 | 41.3682 | 0.9997 | 4.4008 | Nan | 40.5000 |
| Approx Coeff.5 | 21.2542 | 0.9820 | 3.7255 | 21.3418 | 35.5042 |
| Detail Coeff.1 | 99.4289 | 0.9994 | 4.6501 | 129.1205 | 135.9181 |
| Detail Coeff.2 | 69.3094 | 0.9988 | 4.5024 | 110.9459 | 81.2321 |
| Detail Coeff.3 | 80.5000 | 0.9999 | 5.0664 | 120.1858 | 108.0755 |
| Detail Coeff.4 | 40.0014 | 0.9996 | 4.3517 | 59.5000 | 54.8761 |
| Detail Coeff. 5 | 20.1696 | 0.9819 | 3.6376 | 29.6768 | 19.3228 |
| Record Number 03 | |||||
| Approx Coeff.1 | 321.0031 | 0.9990 | 6.4614 | 321.0031 | 825.4718 |
| Approx Coeff.2 | 161.1722 | 1.000 | 5.7708 | Nan | 160.5000 |
| Approx Coeff.3 | 81.5230 | 0.9958 | 5.0853 | 81.4380 | 134.7787 |
| Approx Coeff.4 | 41.3682 | 0.9997 | 4.4008 | Nan | 40.5000 |
| Approx Coeff.5 | 21.4454 | 0.9815 | 3.7311 | 21.6387 | 35.1345 |
| Detail Coeff.1 | 145.8495 | 0.9998 | 5.3263 | 187.8839 | 205.5196 |
| Detail Coeff.2 | 102.0135 | 0.9987 | 5.3536 | 155.1694 | 79.4201 |
| Detail Coeff.3 | 80.5098 | 0.9999 | 5.0661 | 120.1343 | 107.4595 |
| Detail Coeff.4 | 40.1162 | 0.9996 | 4.3547 | 59.6279 | 54.9200 |
| Detail Coeff. 5 | 20.5029 | 0.9987 | 3.6544 | 30.2500 | 28.8412 |
| Record Number 05 | |||||
| Approx Coeff.1 | 534.3339 | 1.0000 | 7.0971 | Nan | 963.5882 |
| Approx Coeff.2 | 268.8375 | 1.0000 | 6.4077 | Nan | 160.5000 |
| Approx Coeff.3 | 135.1687 | 1.0000 | 5.7146 | Nan | 81.0000 |
| Approx Coeff.4 | 69.2448 | 0.9999 | 5.0361 | Nan | 40.5000 |
| Approx Coeff.5 | 101.8248 | 0.9992 | 4.1635 | 123.8635 | 129.1771 |
| Detail Coeff.1 | 35.5333 | 0.9995 | 4.3485 | Nan | 20.5000 |
| Detail Coeff.2 | 80.9950 | 0.9976 | 4.2467 | 121.4528 | 51.8646 |
| Detail Coeff.3 | 121.1233 | 1.0000 | 5.0808 | 161.1070 | 136.3493 |
| Detail Coeff.4 | 60.8758 | 0.9999 | 4.4806 | 80.8895 | 70.7521 |
| Detail Coeff. 5 | 30.8766 | 0.9994 | 3.8747 | 40.8901 | 37.4492 |
| Record Number 06 | |||||
| Approx Coeff.1 | 320.5021 | 1.0000 | 6.4603 | 320.5021 | 964.0907 |
| Approx Coeff.2 | 161.1722 | 1.0000 | 5.7708 | Nan | 160.5000 |
| Approx Coeff.3 | 81.1904 | 0.9999 | 5.0824 | 81.1914 | 80.2571 |
| Approx Coeff.4 | 41.3682 | 0.9997 | 4.4008 | Nan | 40.5000 |
| Approx Coeff.5 | 21.2542 | 0.9820 | 3.7255 | 21.3418 | 35.5042 |
| Detail Coeff.1 | 60.8635 | 0.9979 | 4.0707 | 75.6192 | 76.7107 |
| Detail Coeff.2 | 46.5581 | 0.9942 | 4.0266 | 78.3743 | 43.9129 |
| Detail Coeff.3 | 80.4993 | 0.9999 | 5.0663 | 120.1217 | 107.9780 |
| Detail Coeff.4 | 40.0014 | 0.9996 | 4.3517 | 59.5000 | 54.8761 |
| Detail Coeff. 5 | 20.1696 | 0.9820 | 3.6376 | 29.6725 | 19.3084 |
| Record Number 07 | |||||
| Approx Coeff.1 | 534.3339 | 1.0000 | 7.0971 | Nan | 963.5882 |
| Approx Coeff.2 | 268.8375 | 1.0000 | 6.4077 | Nan | 160.5000 |
| Approx Coeff.3 | 135.1687 | 1.0000 | 5.7146 | Nan | 81.0000 |
| Approx Coeff.4 | 69.2448 | 0.9999 | 5.0361 | Nan | 40.5000 |
| Approx Coeff.5 | 35.5333 | 0.9995 | 4.3485 | Nan | 20.5000 |
| Detail Coeff.1 | 30.2951 | 0.9966 | 3.2261 | 43.9909 | 44.2653 |
| Detail Coeff.2 | 27.7056 | 0.9801 | 3.2273 | 46.9751 | 16.1485 |
| Detail Coeff.3 | 121.1202 | 1.0000 | 5.0805 | 160.8799 | 136.0913 |
| Detail Coeff.4 | 60.8758 | 0.9999 | 4.4806 | 80.8895 | 70.7521 |
| Detail Coeff.5 | 30.8766 | 0.9994 | 3.8747 | 40.8901 | 37.4492 |
Table 2: Displays the computed RQA values based on normal signals
| Records taken from MIT-BIH Fantasia Database (fantasia) | |||||
| Decomposition Levels | Laminarity | Determinism | Entropy | Trapping Time | Transitivity |
| Record Number f1o01 | |||||
| Approx Coeff.1 | 54.4233 | 0.9744 | 4.3725 | 87.7381 | 60.0970 |
| Approx Coeff.2 | 43.1872 | 0.9981 | 4.2318 | 69.4442 | 135.4717 |
| Approx Coeff.3 | 23.3262 | 0.9970 | 3.5876 | 35.7448 | 20.6590 |
| Approx Coeff.4 | 16.9733 | 0.9970 | 3.3260 | 23.0465 | 13.1252 |
| Approx Coeff.5 | 28.9493 | 0.9957 | 3.9848 | 31.8097 | 19.5407 |
| Detail Coeff.1 | 35.7754 | 0.9276 | 1.4229 | 149.5712 | 34.7364 |
| Detail Coeff.2 | 62.4054 | 0.9040 | 2.3688 | 66.8769 | 45.4709 |
| Detail Coeff.3 | 6.3722 | 0.9183 | 1.8570 | 10.7470 | 6.8914 |
| Detail Coeff.4 | 7.8690 | 0.9156 | 1.9355 | 13.3745 | 9.3871 |
| Detail Coeff. 5 | 7.9464 | 0.8366 | 1.6179 | 13.2489 | 9.2848 |
| Record Number f1o02 | |||||
| Approx Coeff.1 | 47.0208 | 0.9938 | 4.1890 | 73.7454 | 122.3060 |
| Approx Coeff.2 | 30.7063 | 0.9942 | 3.7526 | 47.7739 | 88.1426 |
| Approx Coeff.3 | 17.8096 | 0.9947 | 3.1349 | 26.8109 | 15.1467 |
| Approx Coeff.4 | 15.2155 | 0.9861 | 3.1212 | 20.5616 | 9.5704 |
| Approx Coeff.5 | 26.9009 | 0.9966 | 3.7251 | 28.2330 | 15.2672 |
| Detail Coeff.1 | 9.6844 | 0.7738 | 1.0767 | 17.8468 | 11.9371 |
| Detail Coeff.2 | 12.5900 | 0.7729 | 0.9396 | 22.9116 | 14.6339 |
| Detail Coeff.3 | 6.1235 | 0.8546 | 1.4148 | 10.5835 | 6.6712 |
| Detail Coeff.4 | 8.0222 | 0.8868 | 1.8774 | 13.6344 | 8.6213 |
| Detail Coeff. 5 | 8.2525 | 0.9006 | 1.8470 | 13.5306 | 13.0847 |
| Record Number f1o05 | |||||
| Approx Coeff.1 | 57.4967 | 0.9822 | 4.3975 | 95.3652 | 83.6983 |
| Approx Coeff.2 | 40.0167 | 0.9980 | 4.0383 | 62.9804 | 124.2381 |
| Approx Coeff.3 | 22.5560 | 0.9968 | 3.4152 | 34.7983 | 19.0963 |
| Approx Coeff.4 | 18.3096 | 0.9959 | 3.3681 | 23.1870 | 12.4777 |
| Approx Coeff.5 | 39.2209 | 0.9997 | 4.3243 | 39.5851 | 36.1954 |
| Detail Coeff.1 | 24.8525 | 0.9310 | 1.0758 | 62.3524 | 37.2883 |
| Detail Coeff.2 | 29.9685 | 0.9155 | 1.2224 | 40.4707 | 44.7393 |
| Detail Coeff.3 | 10.0381 | 0.9492 | 2.5795 | 16.6192 | 9.4686 |
| Detail Coeff.4 | 7.4613 | 0.9383 | 1.8468 | 12.6900 | 9.6126 |
| Detail Coeff. 5 | 10.7684 | 0.7598 | 2.0586 | 17.3821 | 8.1278 |
| Record Number f1o06 | |||||
| Approx Coeff.1 | 67.3195 | 0.9924 | 4.4870 | 106.1820 | 141.1609 |
| Approx Coeff.2 | 36.0982 | 0.9975 | 3.8273 | 57.3611 | 120.4051 |
| Approx Coeff.3 | 19.4992 | 0.9929 | 3.1262 | 29.7439 | 17.5737 |
| Approx Coeff.4 | 11.7776 | 0.9832 | 2.6798 | 15.9088 | 9.2292 |
| Approx Coeff.5 | 10.5602 | 0.9780 | 2.7346 | 14.2121 | 6.9768 |
| Detail Coeff.1 | 19.2648 | 0.9152 | 1.0413 | 49.3608 | 28.3598 |
| Detail Coeff.2 | 35.2666 | 0.8994 | 1.3604 | 44.2580 | 40.9979 |
| Detail Coeff.3 | 8.9501 | 0.9695 | 2.4529 | 14.7455 | 9.4769 |
| Detail Coeff.4 | 10.1702 | 0.9165 | 2.3756 | 16.8683 | 10.1299 |
| Detail Coeff. 5 | 6.0972 | 0.9118 | 1.3843 | 10.1030 | 9.9109 |
| Record Number f1o08 | |||||
| Approx Coeff.1 | 37.8829 | 0.9750 | 3.7594 | 63.3349 | 56.9933 |
| Approx Coeff.2 | 26.2136 | 0.9945 | 3.5007 | 41.5826 | 81.2785 |
| Approx Coeff.3 | 18.6109 | 0.9967 | 3.2126 | 28.3381 | 15.6717 |
| Approx Coeff.4 | 20.4481 | 0.9977 | 3.3044 | 29.3646 | 15.7543 |
| Approx Coeff.5 | 29.0734 | 0.9997 | 3.9709 | 30.8951 | 19.8033 |
| Detail Coeff.1 | 29.6064 | 0.9272 | 1.1573 | 94.2026 | 34.7165 |
| Detail Coeff.2 | 83.6513 | 0.9175 | 2.9130 | 78.1592 | 52.9170 |
| Detail Coeff.3 | 6.3448 | 0.8905 | 1.7145 | 10.6174 | 7.0085 |
| Detail Coeff.4 | 7.3697 | 0.8888 | 1.4711 | 12.7517 | 9.3412 |
| Detail Coeff.5 | 17.5211 | 0.7667 | 2.5893 | 26.1139 | 9.6333 |
Performance Evaluation
For evaluating the performance of the classifier, following statistical measures were used.24 They are stated as:
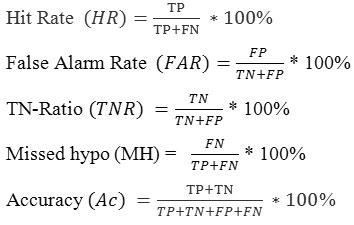
Where TP, TN, FP, FN stands for: true positive, true negative, false positive and false negatives respectively. In this work, positive refers to AF patients and negative refers to normal patients. Hit rate is defined as correctly diagnosed AF cases, false alarm rate presents the normal cases recognized as AF patients, TN ratio detects the normal persons correctly, missed hypothesis trace the number of AF cases as normal and overall accuracy means the number of sum of TP and TN to the total cases. Table 3 illustrates the comparison between other atrial fibrillation arrhythmia detection attempts by other researchers.
Table 3: Shows comparison with other AF detection approaches
| Authors | HR | FAR | TNR | MH | Ac |
| Paper [25] | – | – | – | – | 95% |
| Paper [26] | – | – | – | – | 98.24% |
| Our Approach | 100% | 0.00 | 100% | 0.00 | 100% |
Conclusion
This work focused on automatic feature extraction and classification of atrial fibrillation arrhythmic patients based on combined approach of wavelet transformation and recurrence quantification analysis. In this paper, till fifth level of decomposition process is preferred according to the need of problem. The feature extraction work is completed by evaluating the RQA measures like laminarity, determinism, entropy, trapping time and transitivity. The values obtained from RQA measures are calculated against the decomposition levels of DWT. PNN classifier is used for training and testing the ECG signals. This research work were carried out on atrial arrhythmic and normal signals. The RQA values are gathered on corresponding hundred levels of decomposition including both the signals. So, for training purpose 70 levels (seven records) of RQA values has been chosen and rest 30 (three records) are used in testing process. Experimental ECG signals were taken from Long term AF database and fantasia database from physio net.org. The results were verified on the basis of statistical parameters like hit rate, false alarm rate, TN ratio, missed hypothesis and accuracy used for evaluating the performance of proposed classifier. The results obtained using PNN classifier were strongly capable to differentiate between AF and normal ECG signals. The proposed method in this paper can be used for correct and reliable detection and classification of AF patients.
Conflicts of Interests
All authors declare that they have no conflict of interests at all.
Author’s Contributions
SS designed the algorithm for experiments & performed the experiments and analyzed the data. GS and SNS help me and guide me during my whole work. All authors read and approved the final manuscript.
References
- Cornelis S, Jan H, Gerard V, Jan A, Herre J and Ch H. Stricker ‘Drug Induced Atrial Fibrillation’. Journal of the American College of Cardiology, ELSEVIER. 2004;44(11):2117-2124.
CrossRef - Kara S, Okandan M. ‘Atrial fibrillation classification with artificial neural networks’. Pattern Recognition-ELSEVIER. 2007;40:2967-2973.
CrossRef - William B, Robert D, Daniel D and Patricia M. ‘Epidemiologic features of chronic atrial fibrillation-The Frmingham Study’. The New England Journal of Medicine. 1982;1018-1022.
- Konings K.T.C, Smeets J.J.R, Penn H.J.O and Allesie C.M.A. ‘High density mapping of electrically induced Atrial Fibrillation in humans’. 1994;89:1665-1680.
CrossRef - Mark M and John C. ‘Classification of atrial fibrillation’.The American Journal of Cardiology. ELSEVIER. 1998;82:18-28.
CrossRef - Page R.L , Wikinson W.E,Clair W.K , McCarthy E.A and Pritchett E.L. ‘Asymptomatic arrhythmias in patients with Symptomatic paroxysmal atrial fibrillation and paroxysmal Supraventricular tachycardia’. American heart Association. 1994;89(1):224-227.
- Lawrence L, Richard B, Michael R and James L. ‘Hazards Of Post-operative atrial arrhythmias’. The Annals of Thoracic surgery. ELSEVIER. 1993;56:539-549.
CrossRef - Mina K, David O, Dennis S, Oussama W, Anne K.C, John P, Andrea J.N and David R. ‘C Reactive protein Elevation in patients with atrial arrhythmias’. American Heart Association. 2001;104:2886-2891.
- Alan S, Elaine M, Kathleen A,Chiao Y, Lori C, Henault E, Joe V And Daniel E. ‘Prevalence of Diagnosed atrial Fibrillation in adults national implications for rhythm Management and stroke prevention: the An Ticoagulation And risk factors in atrial fibrillation (ATRIA) study’. The Journal of the American Medical Association. 2001;285(18):2370-2375.
CrossRef - Koonlawee N, John M, Erol K, Mark S, Buncha S, Thaveekiat V.C and Tachapong N. ‘A new approach for catheter Ablation of atrial fibrillation: mapping of the electro Physiologic substrate. 2004;43(11):2044-2053.
- Wolf P.A ,Abbott R.D and Kannel W.B. ‘Atrial Fibrillation as an independent risk factor for stroke: The Framingham Study’. American Heart Association. 1991;22(8):983-988.
CrossRef - Saraswat G.S and Shukla S. N. ‘Review: Comparison of QRS Detection algorithms’. IEEE International conference on Computing, Communication and Automation and (ICCCA). 2015;354-359.
- Suraj K, Omkar S and Ramesh K. ‘Beat detection algorithm for ECG and arterial blood pressure waveforms using empirical mode decomposition: a unified approach’. International Journal of Signal and Imaging Systems Engineering. 2015;8(1/2):68-79.
CrossRef - Samuel P. ‘Improved feature detection in ECG signals through Denoising’. International Journal of Signal and Imaging Systems Engineering. 2008;1(2):108–114.
CrossRef - Kumar and Ranjeet K. ‘ECG signal compression using The Optimized wavelet filter banks’. International Journal of Signal and Imaging Systems Engineering. 2012;5(3):187-195.
CrossRef - Nilanjan D, Monalisa D, Sainik K and Achintya D. ‘Tamper Detection of electrocardiograph signal using watermarked Bio hash code in wireless technology’. International Journal of Signal and Imaging Systems Engineering. 2015;8(1/2):46-58.
CrossRef - Brian F, Yan Y, Paul E, Amy D, Robert C, Michael W and Martha J. ‘Clinical classification schemes for predicting Hemorrhage: Results from the national registry of atrial Fibrillation (NRAF)’. American Heart Journal. ELSEVIER. 2006;151:713-719.
CrossRef - Vias M and Richard J. ‘Atrial Fibrillation: Classification, pathophysiology, mechanisms and drug treatment’. Medical Journal. BMJ. 2003;89:939-943.
- Paul S.A. ‘Wavelet transforms and the ECG: a review’. Physiological measurement. 2005;1-45.
CrossRef - Mikhled A and Khaled D. ‘ECG Signal Denoising By Wavelet Transform Thresholding’. American Journal of Applied Sciences. 2008;5(3):276-281.
CrossRef - Zbilut J.P and Webber C.L. ‘Embedding’s and delays as derived from quantification of recurrence plots.’ Physics letter A ElSEVIER. 1992;171 (3/4):199-203.
- Marwan N. ‘Cross recurrence plot toolbox for Matlab’, Reference Manual, Transdisciplinary Concepts and Methods Potsdam Institute for Climate Impact Research (PIK), Version 5.15, Release. 2010;28(6):1-58.
- Donald F.S. ‘Probabilistic neural networks’. Neural Networks ELSEVIER. 1990;3(1):109-118.
CrossRef - Alexakis C .H.O.N, Saatchi R.N.D ,Davies H.C , Emery C, Ireland R.H and Heller S.R. ‘Feature Extraction and Classification of Electrocardiogram (ECG) Signals Related to Hypoglycaemia.’ Computer in Cardiology. IEEE. 2003;30:537-540.
CrossRef - Meleze M.P, Frederic M, Yoshihide T.L, Pierre S.R and Pierre J.J. ‘Catheter ablation of long lasting persistent atrial fibrillation: Clinical outcome and mechanisms of subsequent arrhythmias. Journal of Cardiovascular Electrophysiology. Wiley Online Library. 2005;16:1138-1147.
- Sumathi S.H and Vanithamani R. ‘A wavelet transform based Feature extraction and classification of cardiac disorder’. Journal of Medical Systems. Springer. 2014;38-98.
CrossRef


