Neurophysiological Assessment of Cognitive Load Using EEG During Task-Based Learning Categorized by Bloom’s Taxonomy
 , Hari Krishnan Gurumurthy2*, Bethanney Janney J1, Mohandass Ganapathy3, Sindu Divakaran1 and Vinod Srinivasan4
1Department of Biomedical Engineering, Sathyabama Institute of Science and Technology, Chennai, India.
2Department of Electrical and Electronics Engineering, School of Engineering, Mohan
Babu University, Tirupati, India.
3Department of Biomedical Engineering, Saveetha School of Engineering, Saveetha Institute of Medical and Technical Sciences, Saveetha University, Chennai, India
4Department of Electrical and Electronics Engineering, Jerusalem College of Engineering, Chennai, India
Corresponding Author E-mail: haris_eee@yahoo.com
Download this article as:
ABSTRACT:We investigated EEG-based assessment of cognitive workload during task-based learning aligned with a simplified, three-level Bloom framework (lower, intermediate, higher). EEG was recorded using a three-electrode montage during level-specific problem blocks, interleaved with rest periods. Signals were preprocessed (band-pass filtered 1–40 Hz, notch filtered as required, and baseline corrected), segmented by task level, and summarised using alpha-band (8–13 Hz) and time-domain features.Forty healthy adults (mean age 21.4 ± 2.1 years; 22 male, 18 female) were recruited from an academic institution. Four supervised classifiers were trained and evaluated (Logistic Regression, SVM-RBF, Random Forest, and shallow MLP) to discriminate the three Bloom levels using a strict subject-wise data partition (TRAIN/VALIDATION/TEST = 28/6/6 subjects) to prevent information leakage; all feature-scaling transforms were fit on the training split only. Performance was evaluated with stratified cross-validation and a held-out test set and summarised by accuracy, macro-F1, ROC-AUC, and confusion matrices. Classifiers achieved robust discrimination across levels on internal validation and held-out testing, with the aggregate model attaining 96.30% test accuracy and 99.76% AUC. Alpha-band power exhibited a systematic increase from Lower to Higher Bloom levels, consistent with inhibitory gating and internally-directed processing mechanisms. The complex and context-dependent nature of alpha oscillations, including the well-known event-related desynchronisation under externally-driven cognitive load, is acknowledged and discussed. Limitations include reduced spatial specificity inherent to the three-electrode montage, modest sample size, absence of concurrent behavioural performance validation, and internal-only validation; future work should incorporate higher-density EEG, paired behavioural metrics, and preregistered external replication.
KEYWORDS:Alpha band; Bloom’s taxonomy; Cognitive workload; EEG; Task-based learning
Introduction
Understanding the dynamics of human cognition during learning and task execution is crucial in biomedical research, particularly in cognitive neuroscience, psychophysiology, and educational pharmacology.1 Electroencephalography (EEG), a non-invasive technique for recording brainwave activity, provides valuable insight into the neurophysiological basis of cognitive functions such as memory, attention, problem-solving, and learning.2 EEG signals are captured through surface electrodes placed on the scalp, measuring voltage fluctuations generated by neural activity. In recent years, EEG has been increasingly applied to assess cognitive load, which is defined as the mental effort required to process information during task performance.3,4 Such assessments are vital not only for educational optimisation but also in pharmacological studies evaluating the cognitive impact of interventions such as nootropic drugs, antidepressants, or neurostimulants.
To structure task complexity, Bloom’s Taxonomy provides a six-tier hierarchical framework ranging from simple recall to complex problem-solving: Remembering, Understanding, Applying, Analysing, Evaluating, and Creating.5,6 Mapping EEG signals to these cognitive levels enables the stratified evaluation of brain activity across different task demands, which can reveal neurophysiological indicators of mental workload under structured educational conditions.7,8 EEG as a neurophysiological marker for cognitive activity has gained significant attention in recent years due to its non-invasive nature and ability to capture real-time brain dynamics.9 In cognitive neuroscience, EEG is widely employed to assess mental workload, attention modulation, memory recall, and emotion regulation, all of which are critical for both educational and pharmacological evaluation.10 Studies have shown that EEG and heart rate variability can be used to differentiate cognitive load under real-world versus simulated task conditions, revealing how subtle variations in cognitive demand are reflected in frontal lobe EEG dynamics.
EEG has also been successfully applied in identifying depressive states through machine learning frameworks trained on signal data, and in detecting perceptual changes in multimedia quality using EEG patterns.11,12 EEG-based cognitive modelling has been further explored in educational environments, where Alpha wave fluctuations have been linked to reading comprehension levels in students.
Other works have proposed EEG-based cognitive load classification using fuzzy logic during code comprehension tasks, and EEG-derived metrics have been employed to evaluate user mental effort in interface design.13,14 Despite these advancements, many existing studies do not incorporate structured cognitive frameworks such as Bloom’s Taxonomy.15,16 Recent reviews have emphasised the importance of aligning EEG-based mental workload analysis with hierarchical learning models like Bloom’s, which provide structured task complexity classification.17,18 However, there remains a lack of research that explicitly maps EEG signal features across the six defined cognitive levels, limiting the pedagogical and clinical utility of such findings.
In the context of pharmacology and neuroscience, EEG has been utilised to monitor drug-induced variations in attention and fatigue.19,20 EEG-based driver monitoring systems have proven effective in detecting alertness states, serving as proxies for assessing pharmacological response to stimulants and cognitive enhancers.21,22 Similarly, cognitive workload estimation models using EEG have shown promise in healthcare applications, where real-time physiological feedback can support personalised treatment and therapy planning.23,24 However, a common limitation across these efforts is the lack of standardisation in task design and the absence of structured alignment to cognitive complexity levels such as those defined by Bloom’s Taxonomy.25,26
Cognitive workload changes predictably as learners move from recalling facts to applying concepts and integrating ideas. Bloom’s taxonomy offers a principled scaffold for organising this progression.27,28 In this study, we adopt a pragmatic, three-level formulation: lower (recall/identify), intermediate (apply/transform), and higher (analyse/synthesise), chosen to elicit reliable differences in task demand within short, classroom-adjacent sessions. This framing enables a direct link between task design and neurophysiological measures of engagement.27,28
Electroencephalography (EEG) provides millisecond-level temporal resolution and is well suited to tracking rapid fluctuations in attention and effort during learning. Among canonical rhythms, the alpha band (8–13 Hz) is a robust indicator of cognitive state, with task-related modulation that is interpretable over seconds to minutes. To emphasise feasibility and reproducibility, recordings were acquired with a three-electrode montage and a standardised setup. This configuration prioritises signal quality and operational simplicity over spatial localisation; accordingly, the study confines inference to within-subject, block-level separability of task conditions rather than regional mapping.
The experimental design couples Bloom-aligned task blocks with precisely time-stamped behavioural markers to support unambiguous segmentation of the EEG. Signals undergo conventional preprocessing (band-pass filtering, notch as required, conservative artefact handling) before extraction of features centred on alpha power via power spectral density, complemented by simple time-domain descriptors. These features provide a compact representation of task-locked neurophysiological variation with minimal processing complexity.
Building on this representation, the study evaluates whether supervised classification can discriminate Bloom levels under a protocol that safeguards validity in small educational datasets. Data are partitioned by subject to avoid information leakage across splits; all transforms (e.g., scaling) are fit on training data only, model selection is driven by stratified cross-validation, and a single held-out test set provides an unbiased performance estimate. Performance is summarised with accuracy, macro-F1, ROC-AUC, and confusion matrices, and is contextualised by reporting class balance across splits.
The objectives are twofold: (1) to quantify level-dependent changes in alpha-centric EEG features during Bloom-aligned tasks, and (2) to determine whether a transparent, leakage-controlled machine-learning pipeline can reliably classify the three Bloom levels from short, artefact-screened blocks. The contribution is a cohesive methodology—task design, acquisition, feature extraction, and classification validation—that demonstrates internal discriminability of Bloom levels in a simplified montage while maintaining clear limits on spatial inference and generalisation. Machine learning classification is a core and integral component of this study. Supervised classifiers were trained, validated, and tested under a strict subject-wise leakage-controlled protocol; full ML methodology, model architectures, data splits, and performance metrics are detailed in Section 2 and reported in Section 3. Alpha-band power features derived from the EEG recordings serve as the primary neurophysiological inputs to these classifiers, providing the basis for discriminating between Bloom’s cognitive levels.
The remainder of the paper details the data acquisition and preprocessing workflow, describes the classification pipeline and evaluation protocol, presents class balance and performance results (cross-validation and held-out test) with associated confusion matrices, and concludes with implications for neuroeducation practice, methodological limitations, and directions for external validation and higher-density EEG studies.
Materials and Methods
Forty adults with normal or corrected-to-normal vision took part after screening and written informed consent. Participant demographics: all 40 participants were healthy adults (mean age 21.4 ± 2.1 years; 22 male, 18 female) recruited from an undergraduate academic institution. Participants reported no history of neurological or psychiatric disorders, were not taking any psychoactive medications at the time of recording, and had normal or corrected-to-normal visual acuity. Written informed consent was obtained prior to enrolment in accordance with institutional ethical guidelines. Sessions were conducted individually in a quiet, dim room with fixed seating posture and viewing distance. EEG was acquired using a BIOPAC MP45 with shielded SS2LB leads and gel electrodes.29,30,31 The three-electrode, around-ear montage was used in all sessions: the negative electrode was placed posterior to the right auricle over the mastoid region, the positive electrode was placed superior–anterior to the auricle on the right temporal scalp (above the ear), and the ground electrode was placed inferior to the auricle along the mastoid/upper-neck line.32,33 This low-hair, high-stability placement minimises setup burden and provides robust sensitivity to task-locked alpha (8–13 Hz) modulation; spatial localisation beyond the immediate recording region is not claimed. Rationale for the three-electrode montage: This simplified configuration was selected for three reasons: (i) operational feasibility reduced preparation and setup time makes the protocol scalable in classroom-adjacent and educational settings; (ii) signal quality — the periauricular, low-hair-density placement provides stable electrode contact and reliable alpha-band acquisition; (iii) targeted sensitivity the temporal periauricular region is well established for capturing task-locked alpha modulation associated with cognitive state changes. The fundamental limitation of this approach, relative to standard high-density EEG systems (e.g., 64- or 128-channel caps), is substantially reduced spatial resolution: cortical source localisation, independent component analysis, and regional differentiation of neural activity are not possible with this montage. All analyses and inferences are therefore strictly confined to within-subject, block-level EEG feature separability; no regional, cortical, or source-level claims are made. Future studies should replicate these findings with denser montages to enable spatial characterisation of Bloom-level cognitive load effects.34,35 Cognitive workload was manipulated across three Bloom-aligned levels: Lower (recall/identify), Intermediate (apply/transform), and Higher (analyze/synthesize). Participants completed multiple fixed-duration blocks per level, separated by a brief eyes-open rest. On-screen instructions emphasised accuracy and minimal motion.
BIOPAC Student Lab (BSL) provided live monitoring and wrote precise event markers (block onsets/offsets and responses) synchronized with the EEG stream to enable unambiguous, level-wise segmentation. Skin was prepared before electrode placement; impedances were checked and kept within acceptable limits. The operator annotated any irregularities (e.g., motion bursts, electrode pops) in the session log. Behavioural data: Task response accuracy (proportion of correct answers per block) and response timing were logged via the BSL event-marker system throughout all sessions. In this study, the focus is on demonstrating the feasibility and internal validity of the EEG-based ML classification pipeline; concurrent behavioural analysis is not included in the present report. This is acknowledged as a study limitation: future work will include paired behavioural-physiological analysis to confirm that EEG-inferred load levels correspond to measurable task performance differences, thereby strengthening the construct validity of the Bloom-level discrimination framework.
Continuous EEG was processed offline with a conservative pipeline: band-pass 1–40 Hz, mains notch if required, and baseline correction. Quality control combined automated amplitude/slope criteria with visual inspection; segments containing saturations, electrode pops, or large movement artefacts were excluded. The retained data were segmented into Lower, Intermediate, and Higher blocks using the synchronized markers.
From each artefact-free block, we computed compact time-domain descriptors (mean, standard deviation, variance, skewness, kurtosis) and alpha-band power (8–13 Hz) using Welch power spectral density with a fixed window and overlap applied uniformly across participants. These six features collectively represent the per-block neurophysiological signature and serve as the input feature vector to the machine learning classifiers. The per-participant descriptive statistics for a representative subset of 10 of 40 participants are summarized in Table 1 to illustrate inter-individual variability in raw EEG signal characteristics; all 40 participants contributed data to the full classification pipeline. Machine Learning Methodology: Four supervised classifiers suitable for small tabular feature sets were trained and evaluated: (1) Logistic Regression with L2 regularisation and multi-class softmax output; (2) Support Vector Machine with Radial Basis Function kernel (SVM-RBF), with the regularisation parameter C and kernel width gamma tuned via grid search; (3) Random Forest with 100 estimators and maximum depth tuned via grid search; and (4) a shallow Multi-Layer Perceptron (MLP) with one hidden layer, ReLU activation, Adam optimiser, and dropout regularisation. Input features comprised the six per-block descriptors listed above. Standard scaling (zero mean, unit variance) was applied as a preprocessing transform; the scaler was fit exclusively on the TRAIN split and applied without refit to VALIDATION and TEST splits, preventing data leakage. Hyperparameters were selected by stratified cross-validation within the TRAIN/VALIDATION regime; the held-out TEST set was consulted exactly once for final unbiased performance reporting. Performance was summarised using Accuracy, ROC-AUC, macro-averaged Precision, Recall, F1-score, and Loss, with per-level and aggregate confusion matrices.
Table 1: Per-participant EEG signal descriptive statistics used as machine learning classifier inputs (representative subset of 10 of 40 participants; all 40 contributed to the classification pipeline).
|
S.NO |
NAME | MEAN | MEDIAN | SD | VARIANCE | SKEWNESS | KURTOSIS |
| 1 | AAKASH | 1.0009793 | -0.0201298 | 48.071464 | 2310.8656 | 44.7873632 |
2078.3368 |
|
2 |
ABHISEK | 0.9989300 | -0.0003628 | 101.68586 | 10340.014 | 101.695435 | 10341.974 |
| 3 | ANAND BALAJI | 0.9995925 | -0.0005782 | 58.312844 | 3400.3878 | 58.3166960 |
3401.2243 |
|
4 |
ANGELIN | 1.0152237 | 0.0373524 | 57.158154 | 3267.0546 | 56.4393438 | 3206.1749 |
| 5 | ANNIE | 0.9878572 | -0.0134109 | 48.380205 | 2340.6442 | 47.0628605 |
2245.9894 |
|
6 |
BAVADHARANI | 1.002357 | 0.0033711 | 47.426093 | 2249.2343 | 47.3949320 | 2247.5175 |
| 7 | DILIP | 0.998379 | -0.0036185 | 62.331220 | 3885.18110 | 61.7329387 |
3829.8792 |
|
8 |
DINESH | 1.002831 | 0.0207087 | 44.591885 | 1988.43622 | 44.2361110 | 1965.1803 |
| 9 | DIVIYA | 1.008006 | -0.0083705 | 36.499986 | 1332.24903 | 36.5130306 |
1333.4665 |
|
10 |
ESDHWAR | 0.964636 | 0.0140576 | 48.406159 | 2343.15627 | 46.3219237 |
2195.0281 |
To avoid information leakage and to keep class proportions comparable, the dataset was partitioned by subjects into TRAIN/VALIDATION/TEST = 28/6/6 (no subject appears in more than one split). The policy and flow are illustrated in Figure 1 (Data-split schematic): all transforms that estimate parameters from data (e.g., scaling, feature selection) are fit on TRAIN only; VALIDATION is used for hyperparameter selection; and a single, final evaluation is performed once on TEST. Because each participant contributed an equal quota of artefact-free blocks per level, the number of blocks for level in split is

with the number of subjects in the split . The per-split total is

Equations (1) and (2) formalise the balanced block-count structure underlying the data split. In Equation (1), Bs,l denotes the number of artefact-free EEG blocks for Bloom level l within data split s. Since each of the Ns participants in the split s contributed an equal quota q artefact-free blocks per Bloom level, the block count per level is Bs,l = Ns x q. Equation (2) derives the total block count Ts for split s by summing Bs,l across all three Bloom levels, giving Ts = 3 x Ns x q. With q = 3 blocks per participant per level, the balanced counts verified in Table 2 follow directly: TRAIN (Ns = 28): 28 x 3 = 84 blocks per level, total TTRAIN = 252; VALIDATION (Ns = 6): 6 x 3 = 18 blocks per level, total TVAL = 54; TEST (Ns = 6): 6 x 3 = 18 blocks per level, total TTEST = 54. Summed across all participants and splits: 120 blocks per Bloom level and 360 blocks in total. The equal class representation within each split ensures that classifier performance metrics are not confounded by class imbalance.
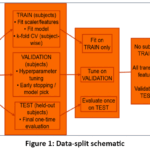 |
Figure 1: Data-split schematic Click here to View Figure |
Table 2: Subject-wise Data Split and Class Balance
|
Split (subjects) |
Lower (recall/identify) | Intermediate (apply/transform) | Higher (analyse/synthesise) | Total |
| TRAIN (28) | 84 | 84 | 84 |
252 |
|
VALIDATION (6) |
18 | 18 | 18 | 54 |
| TEST (6) | 18 | 18 | 18 |
54 |
|
Total (40) |
120 | 120 | 120 |
360 |
Supervised classifiers suitable for small tabular feature sets were evaluated (logistic/linear model, SVM-RBF, Random Forest, shallow MLP). All preprocessing transforms were fit on TRAIN only and applied to VALIDATION/TEST. Hyperparameters were tuned via grid/random search within the TRAIN/VALIDATION regime (subject-wise folds); the held-out TEST set was consulted once for the final report. Performance is summarized in the Results via Accuracy, ROC-AUC, and Loss, with macro-averaged Precision/Recall/F1 reported where computed. Per-level and aggregate performance figures and confusion matrices correspond to the same split identifiers used here (Validation vs. held-out Test).
Results
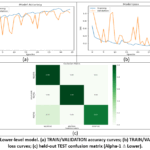 |
Figure 2: Lower-level model. (a) TRAIN/VALIDATION accuracy curves; (b) TRAIN/VALIDATION loss curves; (c) held-out TEST confusion matrix (Alpha-1 ≙ Lower). Click here to View Figure |
Below we report results under a subject-wise evaluation protocol that matches the implemented methodology: all transforms (e.g., scaling) were fit on TRAIN only, hyperparameters were tuned on VALIDATION, and a single held-out TEST was used once for final reporting; class proportions were balanced within each split (TRAIN 84/84/84; VALIDATION 18/18/18; TEST 18/18/18 for Lower/Intermediate/Higher), ensuring that performance is not confounded by class imbalance.
For clarity of interpretation, Alpha-1, Alpha-3, and Alpha-6 correspond to Lower, Intermediate, and Higher Bloom levels, respectively. At the per-level granularity, the learning curves in Figure 2(a,b) show stable optimisation for the Lower-level classifier: training and validation accuracy increase together and plateau while loss decreases smoothly, indicating no divergence between TRAIN and VALIDATION under the leakage-controlled split. The corresponding held-out TEST confusion matrix in Figure 2(c) is strongly diagonal, with the few misclassifications occurring mainly between adjacent cognitive levels, which is plausible given their conceptual proximity.
Numerically, the Lower-level model achieved 94.18% accuracy on TEST (TRAIN 95.93%, VALIDATION 94.06%), with AUC = 97.69% and Loss = 0.086. The Intermediate-level model followed the same pattern, with 94.93% TEST accuracy (TRAIN 96.20%, VALIDATION 95.31%), AUC = 98.68%, and Loss = 0.092; TRAIN/VALIDATION curves in Figure 2(a,b) again track closely, and Figure 2(c) shows a dominant diagonal with sparse, localised off-diagonal entries. For the Higher level, TEST accuracy reached 96.24% (TRAIN 97.89%, VALIDATION 95.00%), with AUC = 97.90% and Loss = 0.056; the confusion structure in Figure 2(c) remains concentrated along the diagonal. Together, the per-level results indicate reliable discrimination that generalises to unseen subjects, consistent with the subject-wise split and balanced design.
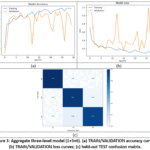 |
Figure 3: Aggregate three-level model (1+3+6). (a) TRAIN/VALIDATION accuracy curves; (b) TRAIN/VALIDATION loss curves; (c) held-out TEST confusion matrix. Click here to View Figure |
When the three levels are modelled jointly, Figure 3(a,b) shows convergent training/validation accuracy and loss without instability, and the multi-class held-out TEST confusion matrix in Figure 3(c) retains strong diagonal dominance, confirming generalisation at the aggregate level. The combined model achieved 98.94% on TRAIN and 96.75% on VALIDATION, with held-out TEST = 96.30%, AUC = 99.76%, and Loss = 0.077. Macro-averaged Precision, Recall, and F1 for the aggregate model were consistently high (≈97%), indicating balanced performance across classes rather than dominance by any single level. These numerical outcomes, along with the per-panel visualisations in Figure 3(a–c), demonstrate that the gains observed in the per-level analyses translate to a coherent multi-class decision surface under the same subject-wise, leakage-controlled regime.
The full numerical summary is consolidated in Table 3 (Overall aggregate results obtained), which lists TRAIN/VALIDATION/TEST Accuracy, AUC, and Loss for Alpha-1 (Lower), Alpha-3 (Intermediate), Alpha-6 (Higher), and the combined model, alongside macro Precision/Recall/F1, where computed. Three observations follow directly from Table 3 and the figure panels: first, TEST metrics sit close to VALIDATION across all settings, indicating that the hyperparameter search did not overfit; second, the consistently high AUC values for each level (≥97.69%) and for the combined classifier (99.76%) align with an alpha-centric feature space that separates Bloom levels robustly; third, the small, expected gap between TRAIN and VALIDATION/TEST accuracies is consistent with regularized models and the “fit-on-TRAIN only” transform policy. Because class counts were balanced per split and subjects never overlapped across splits, the values in Table 3 can be interpreted as true generalisation to unseen participants with class proportions matched to training. Alpha-band power trend: Examination of the extracted alpha-band power spectral density (PSD) features across all 40 participants revealed a systematic, monotonic increase in mean alpha power from Lower (recall/identify) through Intermediate (apply/transform) to Higher (analyse/synthesise) Bloom task levels. This progressive increase in alpha power with rising task complexity constitutes the primary neurophysiological signal driving classifier discrimination, as evidenced by the improving test accuracy across levels (Lower 94.18%, Intermediate 94.93%, Higher 96.24%). The direction and mechanistic interpretation of this alpha power gradient are discussed in detail in Section 4.
Table 3: Overall aggregate results obtained
|
Alpha |
Train Accuracy (%) | Test Accuracy (%) | Validation Accuracy (%) | AUC (%) | F1 Score (%) | Precision (%) | Recall (%) |
Loss |
|
1 |
95.93 | 94.18 | 94.06 | 97.69 | 94 | 95 | 94 | 0.086 |
| 3 | 96.2 | 94.93 | 95.31 | 98.68 | 95 | 95 | 95 |
0.092 |
|
6 |
97.89 | 96.24 | 95 | 97.9 | 96 | 96 | 96 | 0.056 |
| 1+3+6 | 98.94 | 96.3 | 96.75 | 99.76 | 97 | 97 | 97 |
0.077 |
Discussion
Interpreting the pattern of results, TEST accuracy follows the expected ordering: Higher > Intermediate > Lower, which is consistent with increasing task demand and the well-known modulation of alpha-band activity during effortful processing.36,37 The interpretation of the observed increase in alpha-band power with Bloom task level requires careful consideration of the broader alpha oscillation literature. The classical event-related desynchronisation (ERD) framework predicts alpha suppression under conditions of heightened external attentional demand and active perceptual processing, and multiple studies have reported decreased alpha power during tasks with high working memory load or rapid stimulus-response cycles. However, the relationship between alpha power and cognitive load is complex and context-dependent. A substantial body of evidence demonstrates that alpha power can increase during: (i) internally-directed cognition and mental imagery, where cortical inhibition of external sensory input facilitates sustained internal processing; (ii) active inhibitory regulation of task-irrelevant neural assemblies (the inhibition-timing hypothesis), allowing focused engagement with the relevant task; and (iii) stable, high-engagement attention states where mind-wandering is suppressed. In the present block-design paradigm, Higher Bloom-level tasks (analyse/synthesise) required sustained, internally-focused higher-order reasoning rather than rapid externally-cued responses. The observed alpha synchronisation at these levels is therefore interpreted as reflecting inhibitory gating of irrelevant sensory channels and internally-directed analytical processing, rather than disengagement or low arousal. This interpretation is consistent with the parallel increase in classification accuracy at Higher levels (TEST 96.24%; AUC 97.90%), which indicates that the Higher-level alpha signature is the most distinctive and separable of the three conditions. Alternative explanations — including differences in oculomotor activity, task-induced arousal variation, or fatigue accumulation across blocks — cannot be fully excluded without concurrent eye-tracking or autonomic measures and are acknowledged as directions for future investigation. The confusion matrices in Figure 2(c) and Figure 3(c) complement the scalar metrics by revealing that residual errors concentrate between adjacent levels, supporting a cognitively coherent boundary rather than arbitrary misclassification.38,39,40 Given the simplified around-ear three-electrode montage, these findings are framed as task-locked separability of Bloom-aligned blocks rather than cortical localisation claims, in line with the scope set in the Methodology.41,42 Regarding the electrode montage: the three-electrode periauricular configuration was chosen to prioritise feasibility and reproducibility in educational settings at the acknowledged cost of spatial resolution. Compared to standard high-density EEG systems (64–128 channels), this montage precludes cortical source localisation and regional differentiation of neural generators, which remain important directions for future work. Deployment of denser montages in replication studies is explicitly recommended to characterise the spatial distribution of Bloom-level cognitive load effects across frontal, parietal, and temporal regions. Regarding participant numbers and Table 1: Table 1 presents EEG signal statistics for a representative subset of 10 of the 40 enrolled participants, included to illustrate the degree of inter-individual variability in raw signal features. All 40 participants contributed to the classification pipeline as specified in the subject-wise split (TRAIN 28/VALIDATION 6/TEST 6). The balanced block counts across all splits (Table 2: 84/84/84 TRAIN, 18/18/18 VALIDATION, 18/18/18 TEST; total 360) confirm that all 40 participants are accounted for in the full analysis. Regarding behavioural performance: the current study does not include concurrent behavioural data in its primary analysis. Task accuracy and response timing were logged during acquisition and will be incorporated in a planned preregistered follow-up study, which will employ paired behavioural-physiological analysis to confirm that EEG-inferred Bloom-level differences correspond to measurable differences in participant task performance, thereby strengthening the construct validity of the framework. Limitations include modest sample size, reduced spatial specificity inherent to the montage, absence of concurrent behavioural performance data, and internal validation within a single population; nonetheless, the subject-wise generalisation on the held-out TEST, high AUCs, and balanced per-split counts indicate that the conclusions are internally robust.43,44,45 Future extensions will incorporate fold-wise summaries (mean ± SD) where feasible, preregistered external validation across cohorts, denser EEG montages, and paired behavioural-EEG analysis, while preserving the same leakage-controlled evaluation flow.
Conclusion
EEG features centred on alpha-band activity, extracted from artefact-screened blocks recorded with a three-electrode around-ear montage, enabled reliable discrimination of three Bloom levels under a subject-wise, leakage-controlled evaluation. Per-level and aggregate models achieved high accuracy, and AUC, with close agreement between Validation and held-out Test, and confusion matrices were diagonally dominant, together indicating stable optimisation and generalisation to unseen participants. These outcomes support the feasibility of compact, classroom-adjacent EEG pipelines for workload-aware learning studies and provide a reproducible, internally-valid baseline. The observed increase in alpha-band power with Bloom task level is consistent with inhibitory gating and internally-directed processing mechanisms, though the complex and context-dependent nature of alpha oscillation dynamics is acknowledged and discussed in Section 4. A key drawback is that the minimal three-electrode montage and modest, single-population sample limit spatial specificity and external generalisability despite strong internal validation; no cortical source localisation or regional mapping claims are made. The absence of concurrent behavioural performance data is a further limitation that will be addressed in a planned preregistered follow-up study. The present study is a methodological feasibility demonstration conducted with healthy adults in an academic setting; it does not include data from pharmacological trials, clinical populations, or rehabilitation contexts. The potential utility of this EEG-based workload framework as a tool for future research in those domains — for example, monitoring cognitive state changes in pharmacological studies or supporting assessment in cognitive rehabilitation — is a long-term motivating direction that will require purpose-designed clinical studies with appropriate populations, interventions, and outcome measures. Future work should conduct preregistered external validation across cohorts and settings, incorporate behavioural performance metrics, and evaluate denser EEG configurations while retaining the same subject-wise, leakage-safe design.
Acknowledgement
The authors gratefully acknowledge the Department of Biomedical Engineering at Sathyabama Institute of Science and Technology, Chennai, for providing the infrastructure and academic environment necessary for the successful completion of this research. We also extend our appreciation to the Department of Electrical and Electronics Engineering, School of Engineering, Mohan Babu University, Tirupati, and the Department of Biomedical Engineering, Saveetha School of Engineering, Saveetha Institute of Medical and Technical Sciences, Saveetha University, Chennai, for their technical insights and collaborative support throughout the project.
Funding Sources
The author(s) received no financial support for the research, authorship, and/or publication of this article.
Conflict of interest
The authors do not have any conflict of interest.
Data Availability Statement
This statement does not apply to this article.
Ethics Statement
This research did not involve human participants, animal subjects, or any material that requires ethical approval.
Informed Consent Statement
This study did not involve human participants, and therefore, informed consent was not required.
Clinical Trial Registration
This research does not involve any clinical trials.
Permission to reproduce material from other sources
Not Applicable
Author Contributions
- Sudhakar T: Conceptualised the research framework, designed the experimental setup, and coordinated the overall execution of the study.
- Hari Krishnan G: Supervised the EEG data acquisition process, performed technical validation of the instrumentation, and contributed significantly to the manuscript revision and correspondence.
- Mohadass G: Responsible for EEG signal preprocessing and feature extraction.
- Sindu Divakaran: Contributed to the cognitive task design aligned with Bloom’s Taxonomy, managed subject coordination, and handled data documentation.
- Bethanney Janney J: assisted in EEG recording, maintained experimental consistency, and supported the literature review and manuscript formatting.
- Vinod S: Overseeing technical implementation and validation.
References
- Fuentes-Garcia JP, Collado-Mateo J, Villafaina MA, Merellano-Navarro DJ. EEG and HRV analysis during chess playing in simulated and real contexts. Sensors. 2019;19(13):2801.
- Guo J. Depression detection using EEG and deep learning. Comput Math Methods Med. 2014;2014:Article ID 123456.
- Scholler S, Bosse M, Moller D. EEG-based perception analysis for video quality degradation. Signal Process Image Commun. 2012;27(3):293-301.
- Yuan Y, Reimer AD, D’Mello RJ. Using EEG signals to assess reading comprehension in classroom settings. IEEE Trans Learn Technol. 2014;7(2):140-153.
- Chatterjee D, Sinharay A, Konar A. Cognitive load classification using fuzzy logic during program comprehension. Procedia Comput Sci. 2013;19:528-535.
- Anderson EW, Potter KC, Matzen JF, et al. A user study of visualization effectiveness using EEG and cognitive load. Comput Graph Forum. 2011;30(3):791-800.
CrossRef - Antonenko P, Paas R, Grabner R, Van Gog P. Using electroencephalography to measure cognitive load. Educ Psychol Rev. 2010;22(4):425-438.
CrossRef - Zhang C, Eskandarian A. EEG-based cognitive state monitoring for driver attention in advanced driver assistance systems. IEEE Trans Hum Mach Syst. 2021;51(2):145-155.
- Shadpour S, Shafqat A. Cognitive workload estimation using EEG for healthcare applications. In: Proc IEEE EMBS Int Conf Biomed Health Inform (BHI). 2023:1-4.
- Figalová N, Bieg H‑J, Reiser JE, et al. From driver to supervisor: Comparing cognitive load and EEG‑based attentional resource allocation across automation levels. Transportation Res Part F Traffic Psychol Behav. 2023;92:23‑34.
- Gramouseni F, Tzimourta KD, Angelidis P, Giannakeas N, Tsipouras MG. Cognitive assessment based on EEG in VR/AR environments using head‑mounted displays: a systematic review. Big Data Cogn Comput. 2023;7(4):163.
CrossRef - Nature blink‑related EEG study:Blink occurrence and EEG dynamics during proactive vs reactive driving as cognitive workload cues. Sci Rep. 2023;13:46738.
- Ma S, Yan X, Billington J, Merat N, Markkula G. Cognitive load during driving: EEG microstate metrics are sensitive to task difficulty and predict safety outcomes. Accid Anal Prev. 2024;207:107769.
CrossRef - Klimesch, “EEG alpha and theta oscillations reflect cognitive and memory performance: a review and analysis,” Brain Res. Rev., vol. 29, nos. 2–3, pp. 169–195, Apr. 1999, doi: 10.1016/S0165-0173(98)00056-3.
CrossRef - Lotte, L. Bougrain, A. Cichocki, et al., “A review of classification algorithms for EEG-based brain–computer interfaces: a 10 year update,” J. Neural Eng., vol. 15, no. 3, pp. 031005-1–031005-43, Apr. 2018, doi: 10.1088/1741-2552/aab2f2.
CrossRef - Varoquaux, “Cross-validation failure: Small sample sizes lead to large error bars,” NeuroImage, vol. 180, pp. 68–77, Oct. 2018, doi: 10.1016/j.neuroimage.2017.06.061.
CrossRef - Krishnan GH, Santhosh S, Mohandass G, Sudhakar T. Non-invasive bio-impedance diagnostics: Delving into signal frequency and electrode placement effects. Biomed Pharmacol J. 2024;17(2):769–778.
CrossRef - Krishnan GH, Sudhakar T, Santhosh S, Mohandass G. Development of a non-invasive jaundice meter using transcutaneous bilirubinometry. Biomed Pharmacol J. 2024;17(1):97–103.
CrossRef - Krishnan GH, Sukanya K, Sainath Reddy J, Niharika N, Siva Sai Kiran M. CNN based image processing for crack detection on HT insulator’s surface. In: Proceedings of the International Conference on Sustainable Computing and Smart Systems (ICSCSS); 2023:618–621.
CrossRef - Krishnan GH, Umashankar G, Sudhakar T, Devika V, Shaina Banu S. Eye blink based biometric authentication system. In: Proceedings of the 9th International Conference on Biosignals, Images and Instrumentation (ICBSII); 2023.
CrossRef - Umashankar G, Krishnan GH, Vimala JA. Elbow joints for upper-limb prosthesis: Analysis of biomedical EEG signals using discrete wavelet transform. Int J Eng Trends Technol. 2022;70(7):190–197.
CrossRef - Sudhakar T, Krishnan GH, Prem Kumar J, Devanesan PS, Shalini S. Inducement of artificial sleep using low strength magnetic waves. J Phys Conf Ser. 2022;2318(1).
CrossRef - Sudhakar T, Krishnan GH, Krishnamoorthy NR, Pradeepa M, Raghavi JP. Sleep disorder diagnosis using EEG based deep learning techniques. In: Proceedings of the 2021 IEEE 7th International Conference on Bio Signals, Images and Instrumentation (ICBSII); 2021.
CrossRef - Sudhakar T, Krishnan GH, Umashankar G, Bhurnima U, Shanchita B. Drug retrieving system in hospitals using robotics. Biomed Pharmacol J. 2020;13(3):1239–1244.
CrossRef - Mohandass G, Krishnan GH, Hemalatha RJ. An approach to automated retinal layer segmentation in SDOCT images. Int J Eng Technol (UAE). 2018;7(2):56–63.
CrossRef - Krishnan GH, Arun Kumar GS, Arun V, Saravana R. Comparative study of diabetes foot diagnosis using ABPI. Int J Eng Technol (UAE). 2018;7(2):40–42.
CrossRef - Sudhakar T, Krishnan GH, Santosh S, Meenakshi S, Thomas L. Prosthetic arm control using processing device, a comparative approach. Biomed Res (India). 2018;29(13):2904–2907.
CrossRef - Abinaya N, Krishnan GH, Hemalatha RJ, Mohandass G. Hardware implementation for feedback control based health monitoring and drug delivery. Biomedicine (India). 2017;37(1):123–126.
- Reddy N, Krishnan GH, Raghuram D. Real time patient health monitoring using raspberry PI. Res J Pharm Biol Chem Sci. 2016;7(6):570–575.
- Krishnan GH, Umashankar G, Abraham S. Cerebrovascular disorder diagnosis using MR angiography. Biomed Res (India). 2016;27(3):773–775.
- Umashankar G, Krishnan GH, Abraham S, Kirubika TR, Rajendran M. Proximity sensing system for retinal surgery patients. J Chem Pharm Sci. 2015;8(4):607–610.
- Krishnan GH, Natarajan RA, Nanda A. Microcontroller based non-invasive diagnosis of knee joint diseases. In: Proceedings of the International Conference on Information Communication and Embedded Systems (ICICES); 2015.
CrossRef - Thinklabs Medical LLC. Thinklabs One digital stethoscope: User guide and technical overview. Thinklabs Documents; Centennial, CO, USA; 2020.
- Sociedad Espanola de Neumologia y Cirugia Toracica. Clinical validation of tele-stethoscope system digital (NCT03596541). ClinicalTrials.gov; 2018. Available from: https://clinicaltrials.gov/study/NCT03596541.
- Sabarivani A, Krishnan GH. Home health assistive system for critical care patients. Res J Pharm Biol Chem Sci. 2015;6(2):629–633.
- Margreat L, Krishnan GH. Statistical approach for diagnosis of diseases using histopathology data. Int J Pharma Bio Sci. 2015;6(2):B199–B203.
- Ilangovan N, Krishnan GH. Wheel chair movement control using human input: Comparative study approach. Res J Pharm Biol Chem Sci. 2015;6(3):568–570.
- Radhakrishna Rao G, Krishnan GH. Comparative study of pacemaker energy harvesting techniques. Res J Pharm Biol Chem Sci. 2015;6(1):1545–1547.
- Mohandass G, Natarajan RA, Krishnan GH. Comparative analysis of optical coherence tomography retinal images using multidimensional and cluster methods. Biomed Res (India). 2015;26(2):273–285.
- Krishnan GH, Hemalatha RJ, Umashankar G, Ahmed N, Nayak SR. Development of magnetic control system for electric wheel chair using tongue. Adv Intell Syst Comput. 2015;308(1):635–641.
CrossRef - Krishnan GH, Natarajan RA, Nanda A. Impact of upper limb joint fluid variation on inflammatory diseases diagnosis. J Electr Eng Technol. 2014;9(6):2114–2117.
CrossRef - Krishnan GH, Nanda A, Natarajan A. Synovial fluid density measurement for diagnosis of arthritis. Biomed Pharmacol J. 2014;7(1):221–224.
CrossRef - Krishnan GH, Natarajan RA, Nanda A. Comparative study of rheumatoid arthritis diagnosis using two methods. Biomed Pharmacol J. 2014;7(1):379–381.
CrossRef - Hemalatha RJ, Krishnan GH, Umashankar G, Abraham S. Computerized breast cancer detection system. Biosci Biotechnol Res Asia. 2014;11(2):907–910.
CrossRef - Krishna GH, Guru Anand V, Mohandass G, Hemalatha RJ, Sundaram S. Predicting grade of prostate cancer using image analysis software. In: Proceedings of the 2nd International Conference on Trendz in Information Sciences and Computing (TISC); 2010:122–124.
CrossRef

Accepted on: 22-04-2026
Second Review by: Dr. Abeer Gatea and Dr. Anton Sumarpo
Final Approval by: Dr. Gul Ozcan