A Novel Double-Neighborhood Method for Robust Epileptic Seizure Classification
 and Sushil Chandra Dimri
 Department of Computer Science and Engineering, Graphic Era Deemed to be University, Dehradun, India
Corresponding Author E-mail:shivashish1234@gmail.com
DOI : http://dx.doi.org/10.13005/bpj/3509
Download this article as:

The realm of Machine Learning techniques is ever-evolving, with new algorithms and innovative combinations of existing approaches being utilized to achieve outstanding classification performance in various fields. In this series, the proposed method used the concepts of double neighbourhood, weight, and distance. Firstly, a -neighborhood is established using k points in the n-dimensional space, within which K clusters are envisioned, where K is equal to the number of unique target classes. To reduce the effect of noise and eliminate skewness, another neighborhood is generated with Euclidean distance and centroid for each cluster i. Then, weight of each cluster is evaluated to identify the class of the unknown test instance (z). To evaluate the effectiveness of this method, experimental analyses are conducted using two widely utilized datasets: the CHB-MIT dataset and the BONN dataset. The proposed method achieved 98.0% accuracy for the CHB-MIT dataset and 97.89% in predicting two-class classification, 96.21% in detecting three-class classification and 94.61% in distinguishing five-class classification on the BONN dataset. Compared with other renowned methods, namely, traditional KNN, Support Vector Machine(SVM), Naïve Bayes(NB), Logistic Regression(LR), and Decision Tree(DT), the proposed model recorded good performance in all the levels of classification for both the datasets and is advantageous by effectively handling binary as well as multiclass classification.
KEYWORDS:BONN Dataset; CHB-MIT Dataset; EEG, Epilepsy; K-Means Clustering; k Nearest Neighbours
Introduction
Machine learning algorithms have been making significant strides in various fields such as disease diagnosis and drug discovery, malware detection, flaw identification in certain industries, fake news detection, sentiment analysis, image recognition, assessing the quality of air, market prediction, and many more.1,2 These algorithms are in a constant state of development, with researchers constantly exploring new ways to improve their performance. With the incorporation of evolutionary approaches, feature selection, and the combination of different techniques, these algorithms are becoming more advanced and sophisticatedand can tackle complex problems more effectively.Thus, the unprecedented growth and development of machine learning have presented immense opportunities for the expansion and evolution of future possibilities. Having numerous and diverse applications, Machine Learning (ML) is expected to play a significant role in shaping the future of humans.
Supervised ML approaches effectively identify the label for an unknown sample with the help of several training samples, which is known as classification. Binary classification is the process of labeling between two classes, while multiclass classification discriminates among more than two classes. The graphical illustration in Figure 1 represents the multiclass classification problem with three classes. The effectiveness of an algorithm in any classification depends on the type of problem and data distribution. Additionally, as the number of classes increases, correctly classifying a new instance into one of them becomes a challenging task because the heterogeneity of data introduces troubles of overlapping and the non-availability of decision boundaries. However, non-linearity and imbalanced datasets always pose an obstruction in the efficient classification, leading to non-definite decision boundaries between different classes.3In short, it reveals that the heterogeneity of decision boundaries affects classification performance. Another limitation is computational time for training and testing of data, which fairly increases with the size of the dataset.4Among several ML approaches, Naïve Bayes (NB), k-Nearest Neighbors (KNN), and Decision Trees (DT)are known to naturally handle the problem of multiclass classification, but they usually overlook the structure between the classes.5.6Similarly, binary classifiers like Support Vector Machine (SVM), Perceptron, and Logistic Regression (LR) utilize one-versus-one and one-versus-rest methods to address multiclass classification problems.Besides this, one-vs-one, and one-vs-rest both have their own limitations. The one-vs-one method generates multiple binary problems, which overcomplicates the task. One-vs-rest, on the other hand, yields ambiguous outcomes on large datasets. The limitations posed by these challenges can significantly impede the performance of supervised ML methods, which is why it is imperative to address them.
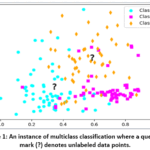 |
Figure 1: An instance of multiclass classification where a question mark (?) denotes unlabeled data points.
|
Psychiatric and neurological diseases are increasingly becoming common in contemporary society, and this is due to the presence of mental stress, neurological problems,and behavioural problems. A small number of chronic neurological disorders, including epilepsy, are among those that bring abnormal electrical activity of the central nervous system and possess various types of symptoms. Epilepsy is typified by seizures that occur recurrently. Since epilepsy is a condition that is a combination of two or more random seizures, one seizure cannot be predicted as epilepsy. Depending on the severity of epileptic seizures, they can lead to mild memory lapses, or produce a violent outburst. Epilepsy is a condition that manifests as sudden and uncontrolled movements of the muscles and changes in the mental state. Loss of consciousness can also take place in the event of a seizure. The causes of seizures may be the extensive electrical activity between brain cells.7 There are various brain regions that may form the basis of hype- discharge in brain cells. The duration of the seizures can range from a few seconds of involuntary muscular contraction up to several minutes. This is why we should have a system that would automatically recognise epileptic seizures. This work, thus, deals with the diagnosis and incidence of epileptic seizures. To enhance the efficiency and precision of seizure detection. Through the analysis of EEG recording and other diagnostic tests data, we will be able to comprehend the patterns and causes of seizures better, to create a more effective detection mechanism. Further, we will discuss how machine learning algorithms could be used to predict and prevent seizures prior to their occurrence. We want to give people with epilepsy the means that they would require to better cope with their condition and live better lives through this research.8
Finally, we intend to make an epilepsy breakthrough and enable people to live their lives to the fullest without fear and uncertainty of unexpected loss of consciousness. Through equipping people with epilepsy with what they require to better manage their illness, we will eliminate the stigma attached to epilepsy and raise awareness and knowledge about the disorder. This research project is bound to make a significant contribution to the lives of people with epilepsy by empowering them to have better control over their health and well-being. As technologies and healthcare evolve, we believe we have the potential to make this world a better place where people with epilepsy can experience an active and full life without having to be constrained by their disorder. We have already achieved encouraging outcomes in the field of enhancing seizure prediction and management through our research.9 Treatment plans developed on an individual basis and new monitoring devices have enabled us to reduce the occurrence and intensity of seizures in our participants dramatically. This not only enhances their life standards, but also enables them to manage their health and well-being. Also, we have worked towards enlightening people about epilepsy and against the misconceptions people hold concerning the disorder. We are now hopeful of the difference we will make in the community of epilepsy as we keep on advancing in this area. Patients living with epilepsy have to have continuous and systematic collaboration with their medical caregivers to collaboratively establish therapeutic plans that will reflect their unique medical, psychosocial, and environmental conditions.10 Typical regimens amalgamate antiepileptic drugs; modifications to daily habits, diet, and education; and, when indicated, adjunctive interventions such as cognitive-behavioural therapy, vagal nerve stimulation, or dietary therapies. Parallel to formal therapies, sustained, interactive education for both patients and lay caregivers cultivates competence, confidence, and resilience in daily self-management. By fostering a collaborative and holistic approach to epilepsy management, we can strive towards a future where individuals with epilepsy can live to their fullest potential. In addition to psychological and social difficulties, patients with seizures should also face physiological ones. In addition to generalized epileptic seizures, focal seizures (which are referred to as partial seizures) exist. Stress, sleeplessness, missing meals, exposure to bright lights, and excessive alcohol intake have all been linked to an increased risk of convulsions. When epilepsy begins in one part of the brain, a person having focal seizures may not be aware that they are having seizures.11 These sorts of seizures often originate from the anterior and frontal areas of the brain. Brief absence seizures may progress into more severe generalized seizures. Jacksonian seizures are a form of focal seizure characterized by involuntary, brief tremors. This fit begins in one finger and spreads to the other fingers and ultimately the entire hand. A generalized seizure may affect either hemisphere of the brain. It is also possible for this kind of seizure to last for such a brief time that it goes unnoticed. A person will often collapse to the ground during a tonic-clonic seizure; however, this is not the case during a generalized seizure. Myoclonic seizures only cause localized shaking of a single limb or extremity. One might further categorize partial seizures as either simple or complicated. In simple partial seizures, consciousness persists, but in complicated partial seizures, it is lost. Depressive symptoms and memory loss are common among those who suffer from epileptic seizures.12 Patients on antiepileptic drugs should be monitored for signs of depression. Changes in behaviour and perception might occur temporarily during an epileptic episode. Therefore, an Electroencephalogram (EEG) is used for the diagnosis of these conditions. The electroencephalogram (EEG) records brainwave activity. It’s a great resource that reveals fascinating truths about how the brain works. Diagnosing brain disorders and other cognitive processes relies heavily on thorough and accurate studies of these signals. The human brain has around 10 billion nerve cells. These neurons present in the brain’s network tremendously complex information processing system.
Neurons within the nervous system generate and propagate electrical currents across their membranes to process and transmit information. These resulting electrical and magnetic activities can be noninvasively captured from the scalp surface, providing valuable insights into neural functioning.13 To measure these electric fields produced by the movement of neurons, small electrodes are placed on the scalp. Consequently, the disparity in charge generated between these positioned electrodes is magnified and evaluated using an electroencephalogram (EEG). In general, EEG is used to detect Seizures. It also identifies disorders like Epilepsy, Brain Tumors, Stroke, Dementia, etc. Thus, it mainly deals with the anatomy of the brain and not only with the physiological level of the brain. Thus, in many applications, EEG characteristics are very important.14 Electroencephalography (EEG) is a non-invasive technique that records and analyzes the brain’s electrical activity. It employs electrodes, positioned on or beneath the scalp, to detect and measure neural signals for subsequent examination. The outputs of the electrodes are linked to an electroencephalograph. It translates electrical signals into physical motion. A database is created by amplifying and recording the brain waves recognized by the electrodes using an EEG device. Hence, the captured signals provide evidence of the brain’s neuronal activity, and the electrical patterns observed in an EEG can potentially expose factors that impact the brain15.
Classification of Epilepsy
Epileptic disorders are recurrent, non-provoked seizures whose etiology and clinical course must be elucidated within a formal classification framework. Such taxonomy, underscored by ILAE, integrates seizure semiology with contributing pathophysiological mechanisms—e.g., structural, genetic, infectious, metabolic, immunological, or idiopathic— and other neurophysiological attributes. Epileptologists employ both seizure type (focal, generalized, or unknown onset) and defined epilepsy syndromes to annotate each case, thereby enabling a sequential, rational therapeutic plan and offering prognostic semantics as well as a substrate for translational and basic pathophysiological inquiry16.
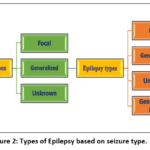 |
Figure 2: Types of Epilepsy based on seizure type.
|
Figure 2represents the classification of epilepsy based on seizure types. Epileptic seizures are broadly categorized into focal seizures, which originate in one hemisphere of the brain, and generalized seizures, which involve both hemispheres from the onset. In some cases, the type of seizure remains unknown due to incomplete clinical or EEG information.
Generalized Epilepsy
Generalized-onset epileptic seizures originate with simultaneous recruitment of both cortical hemispheres, producing immediate and extensive functional involvement and typically resulting in brief, unheralded loss of awareness. This contrasts with focal seizures, which propagate from a circumscribed cortical source. These seizures involve abnormal, synchronized electrical discharges across neural networks that span both cerebral hemispheres, particularly affecting thalamocortical circuits known for regulating alertness and consciousness. The physiological basis often includes an imbalance in neurotransmitters, such as increased excitatory activity (glutamate) and decreased inhibitory control (GABA), contributing to widespread cortical excitability. There are several subtypes of generalized seizures, each with distinct clinical presentations.
Focal Epilepsy
Focal epilepsy, referred to in clinical literature as partial epilepsy, is characterized by seizures whose point of initiation is circumscribed to a discrete cerebral region. This broad phenotype is subclassified into two principal categories: simple focal seizures and complex focal seizures. Simple focal seizures are praxiologically distinguished by the preservation of conscious awareness; patients may exhibit a range of semiotic manifestations, including sustained clonic jerking, defined somatosensory anomalies, and affective disturbances, the latter frequently described in the postictal narrative as unusually vivid, albeit affectively neutral.20 Complex focal seizures, by contrast, are marked by a notable distortion or complete loss of awareness, thereby attenuating or abolishing the subject’s capacity to interact purposefully with the extrinsic environment and to register or encode subsequent mnemonic material. Affected individuals may exhibit a range of automatisms such as repetitive movements, prolonged fixed gazes, or episodes of behavioural arrest and unresponsiveness. These seizures can significantly impact an individual’s behaviour and cognitive response during the episode .21,22
Unknown Epilepsy
Unknown onset seizures are those epileptic activities whose cause of the seizure activity cannot be distinctly defined, despite thorough medical investigations. This type of epilepsy is classified as indeterminate, even though a clinician can perform a range of sophisticated diagnostic measures such as neuroimaging (MRI, CT scans), electroencephalography (EEG), and a thorough assessment of a patient’s clinical history, the diagnosis may remain impossible because of the focal character of the involuntary movements that occur (Saunders at al., 2003). Possible causes of this diagnostic ambiguity include failure to observe the terms of the seizure, low-quality EEG, or complicated underlying neurological conditions. The patients with unknown or unclassified epilepsy can present a rather broad range of seizure behaviours, which can have the characteristics of both focal and generalized seizures.23,24 The etiology and presentation of it are not clear, and thus treatment is mostly symptomatic and not curative.
Related Work
Different methods applied different combinations of K-Means Clustering (KMC)and KNN for both binary and multiclass classification problems. This section discusses some of these approaches. Shaheen and colleagues proposed a Case-Based Reasoning (CBR) approach for deciding workload characteristics on a Multiclass Classification (MC) dataset and data warehouse system.26This approach combined a Genetic Algorithm (GA) with KMC. The resulting ensemble reduced the search time and improved efficiency to reach an optimal solution.Limam, Zouhair, and Oueslatiutilized KNN and SVM approaches on seven datasets having high dimensionality and large size.27In the filtering phase of this 3-SVM tactic, the MC problem was segregated into two classes using a one-vs-one approach. Then, in the review phase, two hyperplanes were visualized, where the first hyperplane determined the distance between each test pattern,and another performed the final classification with the aid of KNN. A multi-class classifier approach (MultiKOC) was suggested by Abdallah and others,28 where KMC was used over positive samples, and a separate classifier was built for each cluster. All the generated classifiers were appliedto each test sample. If all the classifiers rejected thattest instance, it was considereda negative case, otherwise a positive case. Moreover, Altiniet al suggested a framework to perform vertebrae segmentation in two phases.29 First was a fully automated segmentation of the whole spine using a 3D Convolutional Neural Network (CNN) on 214 Computed Tomography scans. And, another was the semi-automated segmentation to locate vertebrae centroids using KMC.The binary spine segmentation obtained a binary dice coefficient of 89.17%, while the vertebrae identification reached an average multiclass dice coefficient of 90.09% using KNN.
Cao and Li utilized KMC, SVM, and CNN to improve the slow training rate and efficiency in recognizingfacial expressions.30 On label-free expression images, KMCwas applied to obtain clustering centres with good data characteristics, which were fed into the CNN to extract features. The CNN output was fed into the SVM classifier to improve expression recognition with complex backgrounds.Ahmed et al implemented K-efficient clustering, K-means with medoids, and KNN for disease detection in soybean plants.31 This prediction strategy not only improved interclass, intraclass, and normal mutual information, running time, and other performance metrics but also revealed the nature of the plant. In terms of accuracy, the KNN algorithm with K-efficient clustering was found to be absolutely accurate, followed by KNN with K-medoids at 94.7%, KNN with KMC at 91.5%, and KNN alone at 81.2%.A Discrete Wavelet Transform (DWT) based Singular Value Decomposition Fuzzy KNN (SVD-FKNN) method was demonstrated by Singh and Dehurito diagnose Epileptic seizures using the features extracted by the Bonn University dataset via the 531 EEG signals. This approach provided 100%accuracy inbinaryand multiclass (with 3 classes) classificationswithin 0.186 to 0.216 seconds. Similarly, for detecting epileptic seizures with 5 target classes, 93.33% accuracy was attained in 0.3168 seconds.
Wang and colleagues suggested a Binary Decision Tree-based K-means Splitting (BDTKS) technique to improve the process of splitting in DT using K-means by emphasizing the minority class rather than the majority class.32This approach had two versions. Version 1 utilized K-means++ for cluster center initialization, while version 2 used a deterministic model to divide the data points through a hyperplane and simulate real-initial cluster centres. Their work needs proper tuning of the δ hyperparameter, else the efficiency of the model would suffer. Also, the approach was a bit time-consuming. Further, Kalpana and Nandhagopal utilized the duo of KNNand KMCto determine the land use from multiple images of the Tamil Nadu region.33The probable classes identified using KMC were river, agriculture, wastelands, forest, urban, and Greenland. After classifying this data with KNN, and comparing it with the gazette report of Tamil Nadu (2019), the results revealed drastic changes in urban, water, and agriculture areas of the district. Al-Yaseen et al suggested a modified KMCapproach to generate a new training dataset to identify breast cancer using the Wisconsin Breast Cancer (WBC) and Wisconsin Diagnostic Breast Cancer (WDBC) datasets.34This improved the efficiency of SVM as well as reduced the training time. On 524 newly created samples forthe WBCdataset, 98.286% was the highest attained accuracy. Similarly, 98.601% was the maximum accuracy achieved on 426 new samples created fromthe WDBC dataset.
A method demonstrating the detection of falls and Activities of Daily Living (ADL) using a wearable device having tri-axial accelerometers was mentioned in.35This study designed an ensemble between KMC and KNN. Using 19 features obtained by calculating the time window at the peak of activities like jogging, going upstairs, and running, thisapproach attained better efficiency measures than the existing Feed-forward Neural Networks (FNN). Fonseca et al tried to handle the problem of imbalanced data by combiningKMC and the Synthetic Minority Oversampling Technique (SMOTE).36This amalgamation focused on generating high-quality noise-free balanced data. During experimental analysis of this algorithm on seven different datasetsbased on land-use and land-cover classifications, this approach attained better results than other variants of SMOTE, KNN, and LR.Also,SMOTE-KMCperformed as the second-best oversampling technique with tree-based classifiers.Jain and others combined KMC withsliding window-based data capturing and drift analyzing methods for anomaly detection.37 Computational analysis on Testbed Datasets (NSL-KDD and CIDDS-2017)with SVM classifier obtained the highest accuracy, precision, recall, and F-scores of 93.50, 91.84, 94.3, and 92.9% respectively.
Nanda et al suggested a Saliency-K-mean-SSO-RBNNmodel detect the region of tumourfrom images.38 To identify the target region, a saliency map with K-mean segmentation was utilized, from which the features were extracted using multiresolution wavelet transform and Principal Component Analysis (PCA). Theobtained feature vectorswereoptimized with the Social Spider Optimization (SSO) algorithm and fed to the Radial Basis Neural Network (RBNN). This model yielded 92 to 96%accuracies on three different datasets.Abnoosian et al proposed a pipeline-based MC framework to predict diabetes using an imbalanced Iraqi Patient Dataset.39This method handled problemslike missing values, limited labeled data, and imbalanced data to improve prediction. To eliminate the issues that occurred with the imbalanced dataset, a weighted ensemble of AdaBoost, NB, DT, and Random Forest (RF)wasused. The highest accuracy, and F-score achieved by this model were 98.87% and 98.51%, respectively. Wang, Xu, and Zhao suggested an improved version ofthe KNN algorithm by incorporating K-means ++ (KNNPK+) and Tabu Search (KNNTS) methods.40In both versions, datain the feature space was divided into spherical regions, whose centroid was identified using K-means++ with the KNNPK+ model and Tabu search with the KNNTS model. On six different datasets, the maximum accuracy was 93% and 97.5% achieved on the Hayes Roth dataset using KNNPK+ and KNNTS models, respectively.Similarly, the lowest accuracy attained was 83.6% and 84.7% with the same models on the Shuttle dataset.However, increased computational time was a limitation of this approach.
Gallego,Rico-Juan, and Valero-Mas demonstrated a clustering-based six-layered Deep Neural Networks(DNN) search method to overcome the obstruction of optimal hyperparameter selection in different machine learning algorithms44. Further, adaptive search parameterswere established for each cluster generated using KMC, which also paced the training phase. To further improve the classification performance on 10 different datasets, pre-calculated k-dimensional tree structures were also utilized. Saha et al suggested a Cluster-oriented Instance Selection (CIS) tactic for classification problems.46This approach leveraged KMC on training samples by automatically predefining a selection rate. Distance-based measures are then used to select samples from borders and to define cluster centroids.Samples selected near centroids revealeda cluster nature, while samples at the borders prevent misclassification arising due to overlapping samples of different classes. On 24 different binary and multi-class classification problems, this approach enhanced the accuracy by 2-3% with KNN. However, a reduction of 1-2% in the accuracy scores was observed when applying NB, and Linear-kernel SVM (LSVM) classifiers. Another work mentioned in,47utilized the combination of KNN and KMC for classifying Red Fuji apple from images. This work pre-processed the images using different approaches like KMC, Otsu, mean filtering, binary map, etc. While classifying 100 testing images using KNN, 97% accuracy was attained.
Mekala and Selvarasuperformed a comparison between KMC and KNN to recognize humans via palm vein images.48As a result, KNN (at k =10) was 89.79% accurate with a misclassification rate of 10.39%. At the same time,KMC had reduced the misclassification to 5.47% and increased the accuracy to 94.52%. Li, Zhang, and Safaraproposed a method for diabetes prediction, whereKMC was used for feature selectionalong with GA, Harmony Search (HS), and Particle Swarm Optimization (PSO) methods.49During classification,KNN achieved 91.65% accuracy.Anggraini et al implemented the Grey-Level Cooccurrence Matrix (GLCM) with KMC to classify rice plant disease from the images of rice plant leaves.50Experimental results showed that brown spot, bacterial blight, and leaf smut were classified with 86, 85.71, and 83.6% efficiency, respectively.Furthermore, Benil, Kumar, and Bharathi suggested the use of KMC and KNN to prune missing values during weather forecasts.51Another comparative analysis between KNN and KMC was carried out by Fitriet alfor analyzingthe specifications for selecting fish feeds in Kendal Regency.52,53As a result, KMC outperformed KNN with an accuracy of 98.6%, while KNN attained an accuracy of 86.7% only.Similarly, Kalyan and Vindhyacomparedthe efficiencies of KMC and KNNin finding users who recommended emotional tweets.54On a sample size of 132, KMC attained an accuracy of 75.16% in revealing the maximum number of negative and happy tweets, which was greater than the KNNaccuracy of 68.2%.55
Table 1: Evaluation of the accuracy results achieved by the state-of-the-art method.
|
Dataset Used |
Methodology / Approach |
Reported Accuracy |
|
BONN Dataset16 |
Kernel Extreme Learning Machine with Cholesky Decomposition |
0.978 |
|
UCI Dataset17 |
1D CNN–LSTM model |
99.39% (binary), 82.00% (five-class) |
|
CHB-MIT Dataset18 |
Recurrent Neural Networks (RNN) |
0.9 |
|
UCI Dataset20 |
Random Forest with/without PCA |
0.97 |
|
UCI Dataset21 |
DCSAE-ESDC Model |
98.67% (binary), 98.73% (multi-class) |
|
CHB-MIT Dataset22 |
CNN + LSTM model |
0.992 |
|
UCI Dataset23 |
Sequential Forward Floating Selection + SVM |
0.979 |
|
Kaggle EEG Dataset24 |
PCA with CANFES Classifier |
0.9873 |
|
REMBRANDT Dataset25 |
CNN with neighboring network limitation |
0.978 |
|
CBIS-DDSM26 |
Logical-Pool RNN combined with SVM |
0.969 |
|
EEG using Arnold Transform27 |
Tegear + GoogleNet |
0.8611 |
|
BONN Dataset |
Short-Time Fourier Transform (STFT) + CNN |
0.953 |
|
CHB-MIT, Bonn-iEEG, VIRGO-EEG datasets33 |
CGAN-TA-CNN-RNN |
94.6% (CHB-MIT), 94.8% (Bonn), 95.2% (VIRGO) |
|
Bonn Dataset35 |
DARLNet architecture |
0.979 |
|
CHB-MIT Dataset36 |
CBAM-3D CNN-LSTM |
0.9795 |
Materials and Methods
The present method suggests envisioning a double neighborhood to perform either binary- or multi-class classification. For this, KNN and KMC techniques are utilized along with the concept of weight and distance. This section describes the entire methodology in detail.
k-Nearest Neighbors
k-Nearest Neighbors (KNN) is a supervised ML approach, based on the concept of distance-based similarity and majority voting. To label the unlabeled, KNN identifies the similarities between the unknown point and the known observations.This similarity between the observations and unknown instances is measured in terms of a distance metric, commonly the Euclidean distance. These distance metrics aiding envisioning different decision boundaries partitioning unknown points into different regions. For classification, majority voting isutilized, which means the label with the largest number of occurrences in selected k-points will become the predicted label. Choosingan optimal odd value for k, (i.e., nearest neighbors) is of high significance to reach accurate results. Sincea small value of k leads to low bias, high variance results (underfitting), and if a very large value for k is selected, it allows outliers and noise to affect the results. Anillustration explaining the general idea of KNN is represented in Figure 2.
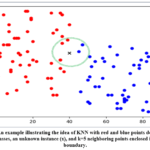 |
Figure 3: An example illustrating the idea of KNN with red and blue points denoting two different classes, an unknown instance (x), and k=5 neighboring points enclosed in a circular boundary.
|
It comprises twodifferent classes indicated in red and blue color. An unknown instance (x)is portrayed in black color. To represent the k=5 neighboring points, a circular boundary is created enclosing 5 selected neighboring points, which will help in assigning the label to the instance (x). In actual circumstances, the nearest Euclidean distance between the unlabeled point (x) and the training points is evaluated. Out of these distances, only the nearest k-points are considered for classification. Since number of red points is greater than the number of blue points, thus x will be assigned the‘red’ class.
K-Means Clustering
K-Means Clustering (KMC) is an unsupervised technique used to gather data points having similar propertiesand assignunique labels for them. The number of clusters required to be formed, i.e., K, is commonly selected using the elbow method. The process begins with initializing the centroidsfor each cluster (which is the average of all the points within a cluster), then adjusting the values of those cluster centroids until either the changes in the centroid values are negligible or ideal clusters are achieved. Therefore, every data point is allocated to the nearest cluster, in such a way, that the sum of the squared distances between the data points and their corresponding centroid is kept as small as possible. An example of KMCis illustrated in Figure 3, where blue-colored points symbolize unlabeled data points. Then, using the elbow method, the value of K=3 is decided. After an iterative process of initializing and adjusting centroid values for each of the three clusters, the final clusters are denoted in yellow, green, and purple colors.
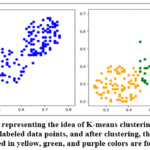 |
Figure 4: An example representing the idea of K-means clustering, where blue-colored points symbolize unlabeled data points, and after clustering, three different classes denoted in yellow, green, and purple colors are formed.
|
The proposed model
Despite being a lazy learner, KNN has several advantages,includingversatility, applicability in both classification and regression problems, simplicity, ease of interpretation,no previous assumptions about the structure of data, and high accuracy on small datasets. However,KNN alone was incapable of producing high-quality results on large datasets, learning information practice, and detecting outliers.Similarly, KMC has the advantages of simplicity, definite convergence,easyadaptation to new samples, and can generalize spherical and elliptical-shapedclusters of different sizes. Among the limitations of KMC, K (i.e., the number of clusters) needs prior selection, whichis typically determined by the elbow point method. Further, the presence of outliers can largely skew the distribution of the resultant clusters. If the shape of the cluster is neither spherical, oblong, nor elliptical, KMCdoesnot account for variance in data and thence fails.
Thus, the present algorithm utilized the combination of KNN and KMC for multiclass classification. Thereby leveraging the advantages of these two different algorithms and paving a way to get nearly clear decision boundaries separating different classes, have guaranteed convergence, and confining the area of search for the label of unknown instances. Initially, an -neighborhood is created using k-nearest neighbors, where the value of k should be a sufficiently large number (irrespective of odd or even values),and can computed as:
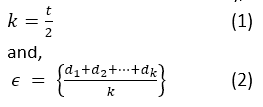
where,
t is the number of testing samples
di is the Euclidean distance of thek-nearest trainingsample points.
Within this ϵ-neighborhood, K clusters canbe envisioned, each representing the span of different classes. The total number of clusters that can be formed is equivalent to the number of unique target classes. Also, each class will have a – neighborhood of its own.
Once, initial clusters have been drawninside ϵ-neighborhood, a centroid is computed for each of them, such thatthe centroid itself behaves as a data point.In order to reduce the effect of noise and eliminate skewness, a second neighborhood (ϵci) is created. This neighborhood is equal to the arithmetic mean of the Euclidean distance between the centroids coi of K-clusters and test point z. This can be mathematically given by

Here,
d(coi, pi) is the Euclidean distance between the centroids coi of ci cluster andtest pointz.
pi represents the sample points belonging to a cluster ci formed within the ϵ-neighborhood.
n(ci) is the total number of sample points in the cluster ci, such that i ϵ K.
Now, the weight (wi) of each cluster ci is calculated by counting the number of sample pointslying within and on the vicinityof the ϵci -neighborhood of the cluster ci, divided by the total number of points in the cluster ci. Mathematically, this can be written as:

where;
nϵ(ci) is the number of sample points lying within and on the vicinity of the ϵci -neighborhood of the cluster ci.
n(ci) is the total number of points in the cluster ci.
To identify the class (cz) of the unknown sample instance, Equation (5) is used, which is given by:

such that,
d(z, coi) is the Euclidean distance of test point zfrom the centroid of the cluster.
In this way, the utilization of both the Euclidean distance and the weight resulted in effective multiclass classification. The pseudo-code for the suggested techniqueis shown in Figure 5.
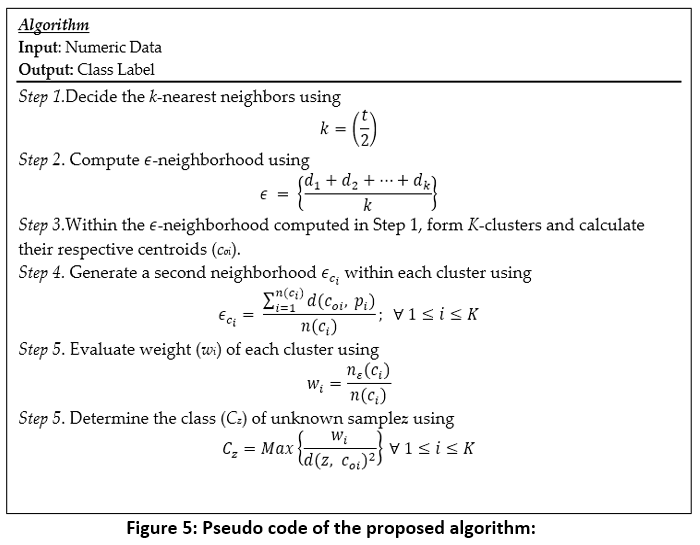 |
Figure 5. Pseudocode of the proposed algorithm:
|
Description of Datasets Used
CHB-MIT Dataset
This dataset comprises three different classes of epilepsy disease. By using the EMD transform technique, eightfeatures were extracted. These features comprise the mean, variance, standard deviation, skewness, kurtosis, correlation coefficient, moment and covariance.The calculated values of the features in this dataset are mentioned in Table 1.
Table 2: Calculated values of extracted attributes for the CHB-MIT Dataset.
|
S.no. |
Features |
Value |
|
1. |
Mean |
0.64 |
|
2. |
Variance |
0.76 |
|
3. |
Standard Deviation |
0.98 |
|
4. |
Skewness |
0.87 |
|
5. |
Kurtosis |
0.77 |
|
6. |
Correlation Coefficient |
0.66 |
|
7. |
Moment |
0.77 |
|
8. |
Covariance |
0.87 |
BONN dataset
The dataset is divided into five groups (A to E) that reflect various levels of brain activity, ranging from normal function to a state of being seizure-prone. It contains single-channel EEG records with a frequency of 173.61 Hz, and every segment is exactly 23.6 seconds long. The dataset encompasses all three states of EEG activity; namely, normal, interictal (seizure-free epileptic), and the ictal (seizure) states, which is perfect for models that aim to detect seizures using deep learning. Groups A and B comprise EEG recordings from healthy subjects: A set of subjects with eyes open and B set with eyes closed. Groups C and D contain interictal horizontal EEG records from an epileptic patient’s hippocampal formation. C set is taken from the hippocampal formation of the opposite hemisphere, and D set is taken from the epileptogenic zone. Set E are ictal readings which include the EEG signals from an actual seizure. The calculated values of the features in this dataset are mentioned in Table 2.
Table 3: Calculated values of extracted attributes for the BONN Dataset.
|
S.no. |
Features |
Value |
|
1. |
Mean |
0.76 |
|
2. |
Variance |
0.42 |
|
3. |
Standard Deviation |
0.81 |
|
4. |
Skewness |
0.63 |
|
5. |
Kurtosis |
0.69 |
|
6. |
Correlation Coefficient |
0.71 |
|
7. |
Moment |
0.68 |
|
8. |
Covariance |
0.79 |
Table 1 and Table 2 show numerical representations of the extracted feature attributes from the CHB-MIT dataset and BONN EEG dataset, respectively , including statistical and nonlinear measures computed for different EEG signal classes to facilitate epileptic seizure classification.
Results
The present algorithm suggests the use of a double neighborhood by amalgamating supervisedKNN, unsupervised KMC, and a weight,for improved andeffective prediction. This combination used neighborhoods, weight, and distance. To test the reliability and feasibility of the suggested work, it isdeployed in three different fields. First, the seeds for high-yielding wheat and rice are detected. Next, the concentration of seven different air pollutants is detected, and then thyroid disease is diagnosed along with the estimation of the different levels of obesity. Each used dataset has different distributions of data points and sample sizes. Thus, data is pre-processed beforefeeding it to the actual approach. Forscaling, Python ‘s built-inMinMax scaler method is utilized. Also, any categorical value in the dataset is replaced with a numeric one using LabelEncoder, and rows with missing values are removed.Additionally, for testing the performance metrics of binary classifiers like SVM and LR on multiclass datasets, a one-vs-rest approach is used.In the context of our research, “noise” refers to the circumstance when data from different classes overlap in a feature space. In simpler words, if the samples from class mlie in the evaluated neighborhood of class n. Then, the class m samples within the vicinity of class n will be considered as noise.The resultant performance measures are the average metrics obtained after randomly shuffling the hold-out sampled data for five iterations.
The assessment of the candidate architecture is anchored on the subsequent quantitative and qualitative criteria:
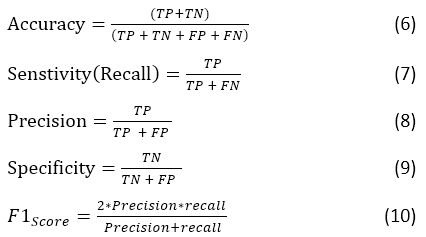
Where, TP: True positive rate, TN: True negative rate, FN: False Negative, FP: False Positive. Apart from the above parameters, the proposed model is also evaluated based on the AUC value and the loss value.
BONNDataset Detection
As discussed earlier, dataset is comprised of five sets (A to E), where each set has 100 EEG recordings with a single channel. Each recording consists of 4096 samples, which is equal to 23.6 seconds of EEG data with a sampling frequency of 173.61Hz. We wrote a Python program that allows us to access the EEG recordings and save them to a CSV file with 100 rows and 4096 columns.Once the initial Step was completed, we processed the remaining 4 sets, which resulted in step 2 CSV files. After completion of step 2,the CSV files, we merged the five CSV files into a single data set, which has a dimension of 500 x 4096. These data rows were then labelled with corresponding classes. Such files make it easy to systematically test and train automated seizure classifiers, as the models require an organized and structured dataset. It means 115 samples are used for training, and 95 samples are used for testing purposes.
Table 4: Overview of the BONN Dataset.
|
SET No. |
Patient Status |
Setup |
Phase |
|
A |
Healthy |
Surface EEG |
Open Eyes |
|
B |
Healthy |
Surface EEG |
Closed Eyes |
|
C |
Epilepsy |
Intracranial EEG |
Interictal |
|
D |
Epilepsy |
Intracranial EEG |
Interictal |
|
E |
Epilepsy |
Intracranial EEG |
Epileptic |
In regards, BONN University Dataset for epileptic seizure detection, we employ several classification methods listed below:
Two-Class Classification: Normal (A) vs. Seizure (E)
This step separates the EEG signals into A: Normal and E: Seizure classes.
Three-Class Classification: Healthy (AB) vs. Interictal (CD) vs. Ictal (E)
It is further divided the signal for more precise analysis into healthy (AB), interictal (CD), and seizure (E) groups.
Five-Class Classification: A (Normal), B (Pre-Ictal), C (Inter-Ictal), D (Post-Ictal), E (Seizure)
EEG signals are classified into five classes of broad categories representing the state of the brain at an instance, for more in-depth computation of seizures
SCENARIO 1: Two-Class Classification: Normal (A) vs. Seizure (E)
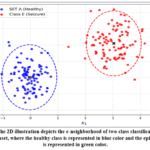 |
Figure 6: The 2D illustration depicts the -neighborhood of two-class classification on the BONN dataset, where the healthy class is represented in blue color and the epileptic class is represented in green color.
|
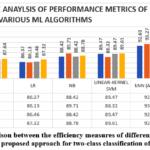 |
Figure 7: Comparison between the efficiency measures of different machine learning algorithms and the proposed approach for two-class classification of the BONN dataset.
|
As evident in Figure 7, the suggested approach is 97.89% accurate and precise. Further, the recall and F-scores are 97.95% and 97.87% respectively. In second position is the KNN at k=3, having 92.63% accuracy, 93.27% precision, 92.63% recall and the F-score 92.76%. Then linear-kernel SVM attained 89.47, 89.87, 89.47, and 89.61% accuracy, precision, recall, and F-scores respectively. Another average performer is NB with an accuracy of 88.42%. Among all the classifiers, DT and LR achieved minimal performance measures in terms of accuracy (87.37%), F-score (87.64%), recall (87.37%), and precision (88.29%).
SCENARIO 2: Three-Class Classification: Healthy (AB) vs. Interictal (CD) vs. Ictal (E)
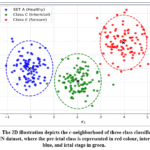 |
Figure 8: The 2D illustration depictsthe -neighborhood of three class classification of the BONN dataset, where the pre-ictal class is represented in red colour, inter-ictal in blue, and ictal stage in green.
|
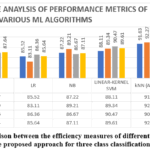 |
Figure 9: Comparison between the efficiency measures of different machine learning algorithms and the proposed approach for three class classification of BONN dataset.
|
Figure 9 shows the three-class classification, the suggested approach shows 96.21% accuracy.Further, the precision, recall and F-scores are 95.89%, 96.95%, 96.87 respectively. In second position is the KNN at k=3, having 91.63% accuracy, while SVM, NB,LR and DT having accuracy value of 88.11, 87.22, 85.52 and 84.37 respectively.
SCENARIO 3: Five -Class Classification: Healthy (AB) vs. Interictal (CD) vs. Ictal (E)
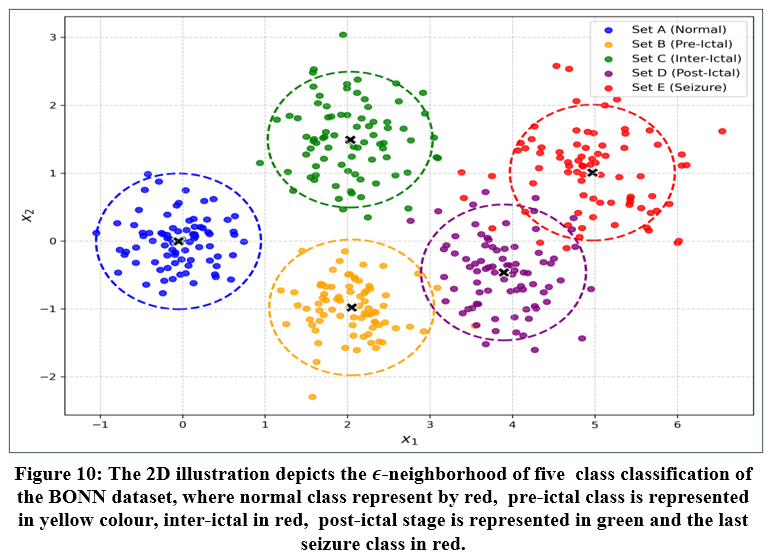 |
Figure 10: The 2D illustration depicts the -neighborhood of five class classification of the BONN dataset, where normal class represent by red, pre-ictal class is represented in yellow colour, inter-ictal in red,post-ictal stage is represented in green and the last seizure class in red.
|
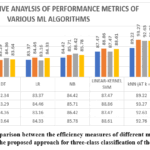 |
Figure 11: Comparison between the efficiency measures of different machine learning algorithms and the proposed approach for three-class classification of the BONN dataset.
|
Figure 11 shows five class classification, the suggested method shows 94.61% accuracy and 94.89 precise value. Further, the recall and F-scores are 95.95% and 95.87%, respectively. In second position is the KNN at k=3, having 89.22% accuracy, 93.27% precision, and 92.63% recall. Then linear-kernel SVM attained 87.47, 88.86, 87.47, and 88.61% accuracy, precision, recall, and F-scores, respectively. The other ML approaches NB, LR and DT gives the accuracy value of 84.42%, 83.37% and 82.34% respectively.
CHB-MIT dataset detection
To measure the classification efficacy of the suggested method on this dataset, 3810 samples are divided in a ratio of 55:45, where 2095 instances are used for training and 1715 for testing purposes. LabelEncoderencoded the Cammeo and Osmancik classes into 0 and 1, respectively. Figure 7 illustrates the 2D representation of the -neighborhood generated for this dataset.
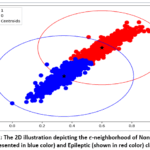 |
Figure 12: The 2D illustration depicting the -neighborhood of Non-Epileptic (represented in blue color) and Epileptic (shown in red color) classes.
|
Figure 12. The 2D visualization demonstrates the ϵ-neighborhood regions for non-epileptic (blue) and Epileptic (red) EEG signal classes. The spatial clustering reflects the separability and neighborhood density of both groups within the feature space.
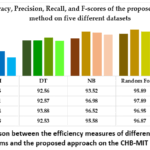 |
Figure 13: Comparison between the efficiency measures of different machine learning algorithms and the proposed approach on the CHB-MIT dataset
|
Figure 13 portrays a comparison between the accuracy, precision, recall, and F-scores of different ML classifiers and the proposed algorithm. As is evident, using the present method, the highest accuracy achieved is 98.0%. Similarly, the recall, precision, and the harmonic mean between these two are 96.94, 99.01, and 97.93%, respectively. The second highest scorer is Random Forest with accuracy value 95.89. The rest of the baseline approaches NB, DT, and SVM gives the accuracy value 93.52, 92.56 and 87.35 respectively.
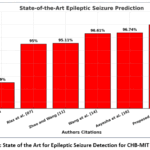 |
Figure 14: State of the Art for Epileptic Seizure Detection for CHB-MIT Dataset.
|
Figure 14 provides a supplementary validation, plotting the proposed model classification accuracy of 98% against results obtained from the established CHB-MIT dataset in earlier publications. The graph incontestably documents the proposed method’s dominance, recording accuracy levels that consistently exceed those of prior systems and underscoring the framework’s readiness for deployment in real-world settings for proactive seizure warning.
Discussion
The proposed approach demonstrates promising effectiveness across two benchmark datasets for epileptic seizure detection, namely the CHB-MIT and BONN EEG datasets. The experimental results indicate that the method achieves consistently high performance in both binary and multiclass classification scenarios. The key advantages of the proposed technique can be summarized as follows.
Efficiency on large datasets
Traditional K-Nearest Neighbor (KNN) classifiers generally perform well on small datasets; however, their effectiveness often degrades as the dataset size increases due to higher computational complexity and sensitivity to data distribution. The proposed method effectively overcomes this limitation, achieving an accuracy of 98.0% on the CHB-MIT dataset. Furthermore, on the BONN dataset, the model attains 97.89% accuracy for two-class classification, 96.21%for three-class classification, and 94.61% for five-class classification. These results demonstrate the scalability and robustness of the approach across varying dataset sizes and classification complexities.
Capability to handle both binary and multiclass classification:
Another significant advantage of the proposed technique is its ability to efficiently distinguish between different numbers of classes, including two, three, and five classes. This flexibility makes the approach suitable for practical clinical scenarios where seizure detection may require different levels of granularity. The method performs reliably, provided that the data distribution is reasonably balanced and not excessively dense.
Balanced mathematical formulation using neighborhood, distance, and weight:
The proposed model incorporates a weighted distance mechanism, wherein data points located farther from the centroid exert less influence on label assignment. This weighting strategy, combined with neighborhood-based decision making, reduces the adverse effects of outliers and noisy samples, thereby improving classification stability and overall predictive accuracy.
Despite these advantages, certain limitations and alternative interpretations should be acknowledged. First, the performance of the proposed method may be affected by overlapping class distributions, particularly in multiclass seizure classification, where EEG patterns often exhibit high inter-class similarity. Second, although the neighborhood-based weighting mechanism reduces noise sensitivity, the model may still be influenced by highly noisy or artifact-contaminated EEG signals, especially in real-world clinical environments. Third, the issue of patient-independent generalization has not been explored in depth. Since EEG characteristics vary significantly across patients, further investigation is required to assess the robustness of the proposed method in cross-patient and cross-dataset scenarios.
Conclusion
This study presents an integrated KNN–KMC–based classification framework that leverages neighborhood structure, distance measures, and weighted decision boundaries for the detection of epileptic seizures from EEG signals. By combining clustering and neighborhood-based classification, the proposed approach effectively mitigates the adverse effects of noise, outliers, and ambiguous class boundaries, which are common challenges in EEG-based seizure analysis. The simulation results show an accuracy of 96.50% for binary class, 94.30% for three class and 92.7% for five class classification on the BONN dataset. To check the model robustness and generalizability the model is also evaluated on another widely used CHB-MIT dataset. The high AUC value obtained on the CHB-MIT dataset further indicates the model’s effectiveness in distinguishing seizure and non-seizure patterns.Rather than solely emphasizing numerical performance, the key contribution of this work lies in its balanced mathematical formulation, which enables more reliable decision-making in high-dimensional EEG feature spaces. The use of clustering before classification improves class separability, and the weighted neighborhood mechanism reduces sensitivity to noisy samples and irregular data distributions. As cluster separability improves, the classification boundaries become more stable, leading to enhanced predictive performance.
Despite the method’s ability to efficiently handle both multi-class and binary-class classification problems, and its proven effectiveness when applied to large datasets, its performance tends to deteriorate under high noise conditions. Specifically, when there is a significant overlap between data samples belonging to two or more classes within a given neighborhood, the classifier’s ability to distinguish between these classes becomes less reliable. This overlap introduces ambiguity and increases the likelihood of misclassification. Furthermore, while the method shows promise in dealing with moderately high-dimensional data, its scalability and robustness in scenarios involving an extremely large number of features remain uncertain. Therefore, additional experimental studies and optimization strategies are required to assess and enhance the technique’s feasibility, stability, and computational efficiency when applied to highly complex, feature-rich datasets.
Acknowledgement
The authors would like to express their sincere gratitude to the Computer Science department of Graphic Era Deemed to be University, Dehradun, for providing the necessary research facilities, resources, and support throughout the course of this study. The authors also acknowledge the valuable guidance and constructive feedback received from faculty members and peers, which significantly contributed to the improvement of this work. Additionally, the authors extend their appreciation to the open-source data repositories and researchers whose publicly available datasets and prior studies have laid the foundation for this research.
Funding Sources
The author(s) received no financial support for the research, authorship, and/or publication of this article.
Conflict of Interest
The authors do not have any conflict of interest.
Data Availability Statement
This statement does not apply to this article.
Ethics Statement- This research did not involve human participants, animal subjects, or any material that requires ethical approval.
Informed Consent Statement
This study did not involve human participants, and therefore, informed consent was not required.
Clinical Trial Registration
This research does not involve any clinical trials.
Permission to reproduce material from other sources
Not Applicable
Author Contributions
- Shiv Ashish Dhondiyal: Conceptualization, Methodology, Writing – Original Draft.
- Sushil Chandra Dimri: Data Curation, Software Implementation, Formal Analysis, Data Preprocessing, Result Validation.
References
- Madiha K, Ali R, Adnan A, Rustam F, et al. Diagnosing epileptic seizures using combined features from independent components and prediction probability from EEG data. Digit Health. 2024. doi:10.1177/20552076241277185.
CrossRef - Ramya S, Uma M. Evaluation of wavelet transformed features on detection of epileptic seizures using 2D scalogram images of EEG signals. In: Proceedings of the 5th International Conference on Inventive Computation Technologies (ICOAC 2023). IEEE; 2023. doi:10.1109/icoac59537.2023.10249921.
CrossRef - Brari Z, Bouzouita I, Belghith S. A comparative study of derivative-based and wavelet-based approaches for epilepsy EEG analysis. In: Proceedings of the 8th International Conference on Advanced Technologies for Signal and Image Processing (ATSIP 2024). IEEE; 2024. doi:10.1109/atsip62566.2024.10638845.
CrossRef - Alalayah KM, Senan EM, Atlam HF, Ahmed IA, Shatnawi HSA. Effective early detection of epileptic seizures through EEG signals using classification algorithms based on t-distributed stochastic neighbor embedding and k-means. Diagnostics. 2023;13(11):1957. doi:10.3390/diagnostics13111957.
CrossRef - Meshram PS, Gharpure DC. Detection of epileptic seizures on EEG signals using decision tree, KNN, SVM and ensemble classifiers. NeuroQuantology. 2022;20(5):NQ22730. doi:10.14704/nq.2022.20.5.NQ22730.
CrossRef - Tran LV, Nguyen TT, Pham TD, et al. Application of machine learning in epileptic seizure detection using EEG signals. Diagnostics. 2022;12(11):2879. doi:10.3390/diagnostics12112879.
CrossRef - Farooq MS, Riaz M, Abid A. Epileptic seizure detection using machine learning classifiers including KNN. Diagnostics. 2023;13(6):1058. doi:10.3390/diagnostics13061058.
CrossRef - Wang B, Li Y, Zhao X, Liu J, et al. Automated detection of epileptic seizures in EEG signals using ML and deep learning methods. Brain Sci. 2025;15(8):842. doi:10.3390/brainsci15080842.
CrossRef - Hemachandira VS, Viswanathan R. A framework on performance analysis of mathematical model-based classifiers in detection of epileptic seizure from EEG signals with efficient feature selection. J Healthc Eng. 2022;2022:7654666. doi:10.1155/2022/7654666.
CrossRef - Kapoor B, Nagpal B, Jain PK, Abraham A, Gabralla LA. Epileptic seizure prediction based on hybrid seek optimization tuned ensemble classifier using EEG signals. Sensors. 2023;23(1):423. doi:10.3390/s23010423
CrossRef - Liu Q, Zhao X, Hou Z, Liu H. Epileptic seizure detection based on the kernel extreme learning machine. Technol Health Care. 2017;25(1 suppl):399-409.
CrossRef - Boonyakitanont P, Lek-uthai A, Chomtho K, Songsiri J. A review of feature extraction and performance evaluation in epileptic seizure detection using EEG. Biomed Signal Process Control. 2020;57:101702. doi:10.1016/j.bspc.2019.101702.
CrossRef - Ahmad I, Ullah M, Khan A, Kim D. EEG-based epileptic seizures detection via machine and deep learning: a comprehensive review. Brain Sci. 2022;12(6):771. doi:10.3390/brainsci12060771.
CrossRef - Li Z, Wang Y, Zhang H, Chen X. An epileptic seizure detection technique using EEG signals with mobile application development. Appl Sci. 2023;13(17):9571. doi:10.3390/app13179571.
CrossRef - Singh A, Gupta S, Kumar R. A review of machine learning approaches for epileptic seizure detection using EEG signals. Brain Inform. 2020;7:5. doi:10.1186/s40708-020-00105-1.
CrossRef - Statsenko Y, Babushkin V, Talako T, et al. Automatic detection and classification of epileptic seizures from EEG data: finding optimal acquisition settings and testing interpretable machine learning approach. Biomedicines. 2023;11(9):2370. doi:10.3390/biomedicines11092370.
CrossRef - Acharya UR, Oh SL, Hagiwara Y, Tan JH, Adeli H. Machine learning approaches for epileptic seizure detection in EEG signals. Biocybern Biomed Eng. 2020;40(4):1328-1341. doi:10.1016/j.bbe.2020.07.004.
CrossRef - Dastgoshadeh L, Rabiei H. Detection of epileptic seizures through EEG signals using entropy features and machine learning. Neuroinformatics. 2023. doi:10.1007/s12021-023-09665-8.
CrossRef - Diez GT, Martinez JF, Garcia M. KNN-based classification of epileptic EEG signals. In: Proceedings of the IEEE International Conference on Bioinformatics and Biomedicine (BIBM 2021). IEEE; 2021:179-184. doi:10.1109/BIBM52529.2021.9669441.
- Durand H, Sharma R, Gupta P. Combination of clustering and KNN for robust epileptic seizure detection from EEG. IEEE Access. 2021;9:89822-89834. doi:10.1109/ACCESS.2021.3082837
- Islam MT, Hossain MA. EEG signal classification using enhanced KNN and clustering for seizure detection. J Med Syst. 2021;45(6). doi:10.1007/s10916-021-01766-3.
- Khan R, Kim T. Machine learning framework for epileptic seizure detection using EEG signals. IEEE Trans Neural Syst Rehabil Eng. 2021;29:2329-2339. doi:10.1109/TNSRE.2021.3096745.
- Ullah MA, Ahmad I, Kim D. Deep and machine learning techniques for automated EEG-based epileptic seizure detection. J Neurosci Methods. 2021;347:108958. doi:10.1016/j.jneumeth.2020.108958.
CrossRef - Zhang Y, Wang S. Unsupervised clustering and KNN for epileptiform spike detection in EEG. Biomed Signal Process Control. 2021;68:102843. doi:10.1016/j.bspc.2021.102843.
CrossRef - Subasi A, Ercelebi E. Classification of EEG signals using wavelet transform and KNN. Expert Syst Appl. 2012;39(1):1305-1312. doi:10.1016/j.eswa.2011.08.168.
CrossRef - Das S, Bhattacharyya A, Konar A. Machine learning-based EEG epileptic seizure detection using time-frequency features. Comput Biol Med. 2018;93:303-314. doi:10.1016/j.compbiomed.2017.12.013.
CrossRef - Roy AR, Mahadevappa M, Bhat MS. Hybrid clustering and KNN classification approach for epileptic EEG signals. Comput Methods Programs Biomed. 2020;197:105775. doi:10.1016/j.cmpb.2020.105775.
CrossRef - Nguyen NP, Tran LV, Pham TD. Performance comparison of machine learning classifiers for EEG-based seizure detection. IEEE J Biomed Health Inform. 2020;24(3):858-867. doi:10.1109/JBHI.2019.2943241.
- Chowdhuri I, Pal SC. Hydrochemical properties of groundwater and land use and land cover changes impact on agricultural productivity: an empirical observation and integrated framework approaches. J Geochem Explor. 2024;258:107402. doi:10.1016/j.gexplo.2024.107402.
CrossRef - Deng G, Jiang H, Zhu S, et al. Projecting the response of ecological risk to land use/land cover change in ecologically fragile regions. Sci Total Environ. 2024;914:169908. doi:10.1016/j.scitotenv.2024.169908.
CrossRef - Xu G, Ren T, Chen Y, Che W. A one-dimensional CNN-LSTM model for epileptic seizure recognition using EEG signal analysis. Front Neurosci. 2020;14:578126.
CrossRef - Ahmad I, Wang X, Zhu M, et al. EEG-based epileptic seizure detection via machine/deep learning approaches: a systematic review. Comput Intell Neurosci. 2022;2022:6486570.
CrossRef - Nahzat S, Yaganoglu M. Classification of epileptic seizure dataset using different machine learning algorithms and PCA feature reduction technique. J Investig Eng 2021;4(2):47-60.
- Tawfik M, Mahyoub E, Ahmed ZA, Al-Zidi NM, Nimbhore S. Classification of epileptic seizure using machine learning and deep learning based on electroencephalography (EEG). In: Communication and Intelligent Systems: Proceedings of ICCIS 2021. Springer Nature; 2022:179-199.
CrossRef - Dastgoshadeh M, Rabiei Z. Detection of epileptic seizures through EEG signals using entropy features and ensemble learning. Front Hum Neurosci. 2023;17:1084061. doi:10.3389/fnhum.2022.1084061.
CrossRef - Singh N, Dehuri S. Multiclass classification of EEG signal for epilepsy detection using DWT based SVD and fuzzy KNN classifier. Intell Decis Technol. 2020;14:239-252. doi:10.3233/IDT-190043.
CrossRef - Vimala BB, Srinivasan S, Mathivanan SK, Muthukumaran V, et al. Image noise removal in ultrasound breast images based on hybrid deep learning technique. Sensors. 2023;23(3):1167.
CrossRef - Ozdemir MA, Cura OK, Akan A. Epileptic EEG classification by using time-frequency images for deep learning. Int J Neural Syst. 2021;31(8):2150026.
CrossRef - Al-Yaseen W, Jehad A, Abed Q, Idrees A. The use of modified K-means algorithm to enhance the performance of support vector machine in classifying breast cancer. Int J Intell Eng Syst. 2021;14:190-200. doi:10.22266/ijies2021.0430.17.
CrossRef - Fergus P, Hignett D, Hussain A, Al-Jumeily D, Abdel-Aziz K. Automatic epileptic seizure detection using scalp EEG and advanced artificial intelligence techniques. Biomed Res Int. 2015;2015:986736. doi:10.1155/2015/986736
CrossRef - Fonseca J, Douzas G, Bacao F. Improving imbalanced land cover classification with K-means SMOTE: detecting and oversampling distinctive minority spectral signatures. Information. 2021;12:266. doi:10.3390/info12070266.
CrossRef - Jain M, Kaur G, Saxena V. A K-means clustering and SVM based hybrid concept drift detection technique for network anomaly detection. Expert Syst Appl. 2022;193:116510. doi:10.1016/j.eswa.2022.116510.
CrossRef - Nanda A, Barik RC, Bakshi S. SSO-RBNN driven brain tumor classification with saliency-K-means segmentation technique. Biomed Signal Process Control. 2023;81:104356. doi:10.1016/j.bspc.2022.104356.
CrossRef - Zhang X, Zhang X, Huang Q, Chen F. A review of epilepsy detection and prediction methods based on EEG signal processing and deep learning. Front Neurosci. 2024. doi:10.3389/fnins.2024.1468967.
CrossRef - Prabhu A, Prasad GMS, Sharma T, Bhatt C, Taranath NL. Epileptic seizure detection and analysis using machine learning. In: Proceedings of the International Conference on Advances in Information Technology (ICAIT 2024). IEEE; 2024. doi:10.1109/icait61638.2024.10690319.
CrossRef - Meesala G, Kumar L, Pandey M, Khare N. Epileptic seizure detection using variational quantum classifier. In: Proceedings of the International Conference on Computational Intelligence for Green and Sustainable Technology (ICCIGST 2024). IEEE; 2024. doi:10.1109/iccigst60741.2024.10717599.
CrossRef - Wen TY, Mohd Aris SA. Hybrid approach of EEG stress level classification using K-means clustering and support vector machine. IEEE Access. 2022;10:18370-18379. doi:10.1109/ACCESS.2022.3148380.
CrossRef - Raghu S, Sriraam N. Classification of focal and non-focal EEG signals using neighborhood component analysis and machine learning algorithms. Expert Syst Appl. 2018;113:18-32. doi:10.1016/j.eswa.2018.06.031.
CrossRef - Wei S, Hou H, Sun H, Li W, Song W. The classification system of literary works based on K-means clustering. J Interconnect Netw. 2022;22. doi:10.1142/S0219265921410012.
CrossRef - Indu R, Dimri SC, Malik P. A modified KNN algorithm to detect Parkinson’s disease. Netw Model Anal Health Inform Bioinform. 2023;12. doi:10.1007/s13721-023-00420-7.
CrossRef - Peng P, Xie L, Zhang Z, et al. Domain adaptation for epileptic EEG classification using adversarial learning and Riemannian manifold. Biomed Signal Process Control. 2022;75:103555. doi:10.1016/j.bspc.2022.103555.
CrossRef - Zhang Z, Li X, Geng F, Huang K. A semi-supervised few-shot learning model for epileptic seizure detection. Annu Int Conf IEEE Eng Med Biol Soc. 2021;2021:600-603. doi:10.1109/EMBC46164.2021.9630363.
CrossRef - Hu X, Xie Y, Zhao H, Sheng G, Lai KW, Zhang Y. Electroencephalography (EEG) based epilepsy diagnosis via multiple feature space fusion using shared hidden space-driven multi-view learning. PeerJ Comput Sci. 2024;10:e1874. doi:10.7717/peerj-cs.1874.
CrossRef - Guhdar M, Mstafa R, Mohammed A. Hybrid deep learning model for epileptic seizure classification by using 1D-CNN with multi-head attention mechanism. arXiv. 2025. doi:10.48550/arXiv.2501.10342.
CrossRef - Cao X, Zheng S, Zhang Z, et al. A hybrid CNN-Bi-LSTM model with feature fusion for accurate epilepsy seizure detection. BMC Med Inform Decis Mak. 2025;25. doi:10.1186/s12911-024-02845-0.
CrossRef
 PlumX:
 Views: 329
  PDF Downloads:
3
PDF Downloads:
3