Statistical Features Based Decision for Placement of Optical Sensor on Prefrontal Lobe for the Acquisition of Cranial PPG Signal in Emotion Analysis
 and Revati Shriram
 Download this article as:
ABSTRACT:In this work, the effect of sensor placement on the prefrontal lobe for emotion classification is analyzed with the objective of achieving maximum classification accuracy. Photoplethysmography (PPG) signals are acquired from the prefrontal region by positioning sensors at the left, central, and right prefrontal locations.Prefrontal PPG signals are recorded for two emotional states, namely happy, sad. A six-level wavelet decomposition is performed on the acquired PPG signals to obtain approximation (A6) and detail (D6) coefficients. Statistical features such as mean, variance,energy, and entropy are extracted from the wavelet-decomposed signals.The extracted features from the original PPG signal, as well as from the A6 and D6 components, effectively discriminate among different emotional states. The results demonstrate significant variations in statistical feature values across emotions. Furthermore, box plot analysis reveals that the differentiation between happy and sad emotions is more pronounced in the central prefrontal PPG signals compared to the left and right prefrontal signals. Consequently, features derived from the central prefrontal PPG signal are identified as more suitable for emotion classification. Central Prefrontal CPPG: Difference in mean between Happy and Sad is 35.58 and difference in variance between Happy and Sad 2924.66 for central A6 scale. For central D6 scale difference in variance between Happy and Sad is 1.14E+006. Difference in energy between Happy and Sad is 7176 and difference in entropy between Happy and Sad is 8.8E+006 for central A6 scale. For central D6 scale difference in energy between happy and sad 4422.59 and difference in entropy between Happy and Sad is 1.14E+006.
KEYWORDS:Classification; Emotions; Prefrontal Photoplethysmogram; Statistical Features; Wavelet
Introduction
Human emotions can be identified through the analysis of physiological signals. Emotion recognition research has shown significant advancement and is broadly categorized into two approaches first based on multichannel physiological signals and second based on multimodal signals. Feature extraction and dimensionality reduction play a crucial role in improving the performance of emotion recognition systems.
Electroencephalography (EEG) is a key component in multichannel emotion recognition systems. In multimodal emotion recognition, fusion of two or more physiological signalssuch as EEG, ECG, PPG, GSR, and EMGis commonly employed to enhance classification accuracy. Cranial photoplethysmography (cPPG) is a novel signal acquired through the combination of EEG and PPG, obtained by placing an optical reflectance-type PPG sensor on the prefrontal lobe.
An optical sensor comprising an infrared (IR) light source and an optical detector is positioned on the prefrontal lobe while subjects are exposed to auditory stimuli associated with happy and sad emotions. The cPPG signal is recorded by placing the sensor at the left, central, and right positions of the prefrontal lobe.
The objective of this study is to identify the optimal sensor placement on the prefrontal lobe that provides maximum signal discrimination for accurate emotion detection.1-10
Materials and Methods
The CPPG signal is recorded under two emotional states, namely happy and sad. These emotions are elicited by having the subject listen to Hindi songs corresponding to each emotional category for a few minutes. During each emotional stimulus, the CPPG signal is acquired for a duration of 5 seconds.
CPPG sensors are properly positioned on the left, central, and right prefrontal regions of the subject’s scalp. For each emotional state, CPPG signals are recorded from all three prefrontal locations.
To ensure high-quality signal acquisition and to minimize the effects of noise and motion artifacts, the subject is instructed to remain still throughout the measurement process.10-12 System block diagram and subject while signal acquisition is shown in figure1.
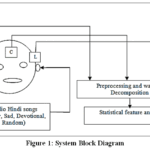 |
Figure 1: System Block Diagram
|
Statistical Features
CPPG signal is decomposed and features that can discriminate between different activity. The features used include some wavelet based features and some statistical features of CPPG signal Wavelet Based Features: Mean, variance, Energy, entropy, used as parameters after wavelet decomposition shown in Figure 2.13-23 CPPG is captured for various emotions. After training the classifier with features calculated from CPPG signals of 10 patients, the KNN classifier was then tested with the features from 10 specimens that were not included for training the classifier.
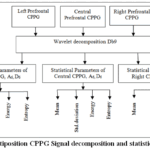 |
Figure 2: Mulitiposition CPPG Signal decomposition and statistical parameters
|
The study was carried out in Cummins College of Engineering for Pune. India, the following parameters were recorded before capturing the signal are subject name, age, height, body temperature, blood pressure, heart rate, sugar and SPO2. All the volunteers were healthy for the duration of the experiment as shown in table 1. Oral consent was taken before capturing the data . Data collection was done on subjects in the age group of 20-60 years. A six level wavelet decomposition of CPPG signal is performed using Daubechies 9 and statistical features are calculated.The CPPG signals for happy and sad emotions are decomposed using wavelet transform to different wavelet sub-bands based on their frequency content.
Table 1: Parameters Recorded Before CPPG Acquisition
|
Subject |
Age |
Gender |
Height (cm) |
Weight (Kg) |
BP mm Hg |
Sugar mg/dL |
HR BPM |
Body Temp.(ºF) |
Spo2 (%) |
|
1 |
47 |
Female |
164 |
65.2 |
176/93 |
120 |
104 |
93.7 |
99 |
|
2 |
51 |
Female |
149 |
59 |
140/80 |
101 |
73 |
92.2 |
98 |
|
3 |
53 |
Male |
149 |
40.8 |
127/60 |
110 |
104 |
91.8 |
99 |
|
4 |
49 |
Male |
170 |
76.5 |
127/80 |
167 |
106 |
93.2 |
99 |
|
5 |
31 |
Male |
169 |
75.4 |
138/91 |
98 |
94 |
91.2 |
99 |
|
6 |
23 |
Female |
163 |
50.3 |
136/79 |
100 |
81 |
92.2 |
98 |
|
7 |
46 |
Female |
153 |
53.7 |
127/69 |
120 |
100 |
93 |
99 |
|
8 |
33 |
Female |
156 |
51 |
108/71 |
107 |
89 |
92.2 |
99 |
|
9 |
39 |
Female |
170 |
39 |
128/66 |
115 |
91 |
93.1 |
98 |
|
10 |
28 |
Male |
165 |
67 |
146/101 |
96 |
93 |
93 |
99 |
|
11 |
43 |
Female |
161 |
46.9 |
117/74 |
101 |
80 |
92.1 |
98 |
|
12 |
22 |
Female |
155 |
53 |
128/93 |
82 |
108 |
91.2 |
98 |
|
13 |
22 |
Female |
163 |
59.8 |
122/79 |
87 |
86 |
93.3 |
97 |
|
14 |
36 |
Male |
163 |
91.8 |
132/82 |
110 |
117 |
92.8 |
98 |
|
15 |
21 |
Female |
43.6 |
93.3 |
110/79 |
95 |
77 |
93.3 |
98 |
|
16 |
49 |
Male |
163 |
60.5 |
102/72 |
170 |
90 |
93.1 |
98 |
|
17 |
57 |
Female |
164 |
76 |
131/68 |
140 |
81 |
93 |
98 |
|
18 |
38 |
Female |
163 |
45.5 |
113/77 |
79 |
93 |
93.5 |
93 |
|
19 |
42 |
Female |
165 |
74.4 |
115/77 |
91 |
78 |
92.5 |
99 |
|
20 |
32 |
Male |
161 |
64.3 |
127/73 |
98 |
80 |
92.8 |
98 |
|
21 |
33 |
Male |
167 |
70 |
133/75 |
249 |
73 |
92.8 |
99 |
The CCPG signal is acquired using instrumentation amplifier and AVR ATmega 8535 microcontroller is used for digitizing the signal with sampling frequency 100 samples per second and transmitting the data on to the computer. Hardware filters are incorporated to remove the artifact 40 Hz LPF and 50 Hz notch filter. It is on this platform the signal is further processed and analysed.
Support Vector Machines (SVM) linear, K nearest neighbour (KNN) and Artificial Neural Network ( ANN) are used to classify the emotions using CPPG signal. After training the classifier with features calculated from CPPG signals of 10 patients, the KNN classifier is tested with the features from 10 specimens that were not included for training the classifier.
Features: Mean, variance, standard deviation, Energy, entropy, used as parameters after wavelet decomposition.13
Mean at each decomposition level is calculated using equation (1)13

Standard deviation at each decomposition level is calculated using equation (2) 13

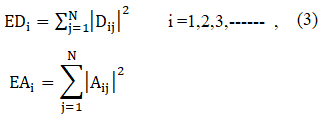
Energy at each decomposition level is calculated using equation (3)13
Where,
N = The number of coefficients of detail or approximation at each decomposition level.
Entropy at each decomposition level is calculated using equation (4).13
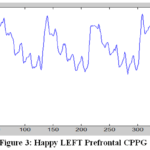 |
Figure 3: Happy LEFT Prefrontal CPPG
|
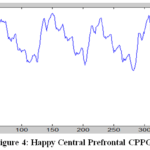 |
Figure 4: Happy Central Prefrontal CPPG
|
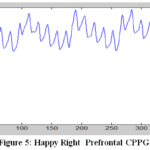 |
Figure 5: Happy Right Prefrontal CPPG
|
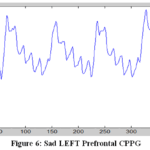 |
Figure 6: Sad LEFT Prefrontal CPPG
|
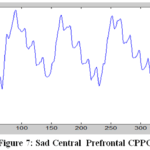 |
Figure 7: Sad Central Prefrontal CPPG
|
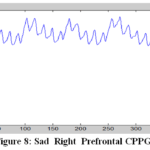 |
Figure 8: Sad Right Prefrontal CPPG
|
Db9 shows similarity with the shape of the normal PPG signal. Therefore, it is chosen for analysis of the CPPG signals. The wavelet function of Daubechies 9 is shown in the Figure 9.
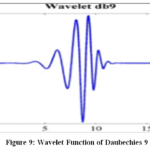 |
Figure 9: Wavelet Function of Daubechies 9
|
Six level wavelet decomposition of CPPG signal is performed. Spectral analysis of all six levels is performed. The signal frequency is detected in D6 level. Statistical feature of main signal and A6 and D6 are extracted.13
The spectral analysis of reconstructed signals it is found that the centre frequency of A6 is at 1.953 Hz. The higher frequency part of the signal is found in D4 –scale and the centre frequency is 17.58 Hz, D5-9.766Hz and D6- 3.906 Hz. Centre frequency of D1- 140.6 Hz, D2-74.22 and D3 – 46.88 Hz consist of predominantly the noise part of the signal. The signal frequency is detected in D6 and A6 level. Statistical feature of main signal and A6 and D6 are extracted.
Results
CPPG (Cranial Photoplethysmogram) for different emotions are shown in Figure 3 to Figure 8. Table 2, Table 3 and Table 4 shows the statistical parameters of left central and right Prefrontal PPG Signal.
Table 2: Statistical Parameters of Left Prefrontal PPG
|
Left Prefrontal PPG |
||||
|
Emotion |
Mean |
Variance |
Energy |
Entropy |
|
SAD |
121.50 |
258.19 |
5993139.25 |
-57842681.89 |
|
HAPPY |
122.69 |
115.99 |
6052535.75 |
-58359672.86 |
|
SAD |
121.44 |
1251.33 |
6382699.00 |
-62787104.60 |
|
HAPPY |
117.08 |
4436.93 |
7235298.50 |
-74469620.57 |
|
SAD |
123.35 |
176.03 |
6141018.50 |
-59347302.77 |
|
HAPPY |
121.67 |
163.15 |
5971241.50 |
-57534151.38 |
|
SAD |
126.29 |
1051.62 |
6782334.50 |
-66915188.30 |
|
HAPPY |
121.46 |
118.62 |
5933948.75 |
-57102198.69 |
|
SAD |
122.30 |
164.24 |
6033766.25 |
-58199318.32 |
|
HAPPY |
125.82 |
95.33 |
6354586.50 |
-61558914.31 |
|
SAD |
120.93 |
176.63 |
5905765.50 |
-56852170.75 |
|
HAPPY |
122.91 |
165.76 |
6093346.50 |
-58834470.02 |
|
SAD |
123.90 |
186.96 |
6199764.00 |
-59981930.14 |
|
HAPPY |
123.19 |
271.47 |
6163226.00 |
-59655984.38 |
|
SAD |
121.62 |
77.65 |
5932345.50 |
-57052965.90 |
|
HAPPY |
124.20 |
166.74 |
6221614.25 |
-60198825.77 |
|
SAD |
120.21 |
115.83 |
5811880.00 |
-55805411.63 |
|
HAPPY |
122.55 |
56.94 |
6015181.00 |
-57914536.77 |
|
SAD |
125.77 |
180.89 |
6383732.75 |
-61939565.95 |
|
HAPPY |
121.89 |
158.32 |
5990628.75 |
-57735845.53 |
Table 3: Statistical Parameters of Central Prefrontal PPG
|
Central Prefrontal PPG |
||||
|
Emotion |
Mean |
Variance |
Energy |
Entropy |
|
SAD |
117.98 |
490.98 |
5749671.50 |
-55449269.20 |
|
HAPPY |
124.69 |
425.87 |
6372786.75 |
-62023464.36 |
|
SAD |
122.69 |
861.06 |
6348831.75 |
-62135940.83 |
|
HAPPY |
114.33 |
421.21 |
5383184.00 |
-51526512.95 |
|
SAD |
121.23 |
185.63 |
5937802.25 |
-57196190.36 |
|
HAPPY |
124.30 |
128.21 |
6215475.75 |
-60102292.73 |
|
SAD |
125.22 |
225.11 |
6345862.25 |
-61568915.50 |
|
HAPPY |
123.48 |
160.45 |
6147902.50 |
-59407911.58 |
|
SAD |
121.80 |
169.15 |
5986897.25 |
-57703230.42 |
|
HAPPY |
123.76 |
613.97 |
6355847.50 |
-61992517.56 |
|
SAD |
123.62 |
91.12 |
6133529.75 |
-59201761.91 |
|
HAPPY |
122.67 |
243.22 |
6101333.50 |
-58984357.10 |
|
SAD |
126.12 |
678.48 |
6616660.00 |
-64827108.74 |
|
HAPPY |
123.25 |
474.64 |
6250374.25 |
-60755524.91 |
|
SAD |
119.68 |
85.84 |
5748726.25 |
-55114393.04 |
|
HAPPY |
121.11 |
58.68 |
5875524.50 |
-56434863.17 |
|
SAD |
123.89 |
163.77 |
6189172.75 |
-59849542.52 |
|
HAPPY |
123.22 |
453.04 |
6238078.75 |
-60611195.63 |
|
SAD |
119.68 |
85.84 |
5748726.25 |
-55114393.04 |
|
HAPPY |
121.11 |
58.68 |
5875524.50 |
-56434863.17 |
Table 4: Statistical Parameters of Right Prefrontal PPG
|
Right Prefrontal PPG |
||||
|
Emotion |
Mean |
Variance |
Energy |
Entropy |
|
SAD |
121.65 |
62.25 |
5929380.00 |
-57009034.48 |
|
HAPPY |
121.16 |
56.82 |
5879506.25 |
-56475762.62 |
|
SAD |
120.41 |
745.83 |
6081507.25 |
-59173711.44 |
|
HAPPY |
120.02 |
226.05 |
5837606.75 |
-56168627.94 |
|
SAD |
120.10 |
1121.57 |
6201227.25 |
-60764754.48 |
|
HAPPY |
123.20 |
111.51 |
6100548.00 |
-58865566.59 |
|
SAD |
122.71 |
104.26 |
6049464.50 |
-58316793.34 |
|
HAPPY |
123.57 |
73.62 |
6121497.00 |
-59058573.28 |
|
SAD |
124.11 |
1380.30 |
6694805.00 |
-66230731.17 |
|
HAPPY |
126.34 |
779.94 |
6679131.75 |
-65570404.48 |
|
SAD |
122.32 |
244.06 |
6067493.25 |
-58621569.11 |
|
HAPPY |
120.23 |
109.37 |
5811590.25 |
-55798019.33 |
|
SAD |
122.45 |
519.28 |
6189147.00 |
-60137348.55 |
|
HAPPY |
124.73 |
307.32 |
6329844.25 |
-61466021.15 |
|
SAD |
122.77 |
185.15 |
6087916.25 |
-58791822.09 |
|
HAPPY |
120.29 |
62.86 |
5798853.25 |
-55625779.55 |
|
SAD |
121.79 |
38.21 |
5933568.25 |
-57033698.85 |
|
HAPPY |
122.42 |
53.50 |
6001315.50 |
-57764969.89 |
|
SAD |
123.03 |
48.42 |
6059063.25 |
-58374528.52 |
|
HAPPY |
121.77 |
161.12 |
5980902.50 |
-57633818.45 |
Figure 10, Figure 11, Figure 12 and Figure 13 shows the plot for mean, variance, energy and entropy respectively.
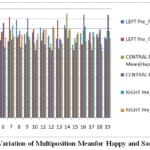 |
Figure 10: Variation of Multiposition Meanfor Happy and Sad Emotions
|
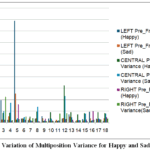 |
Figure 11: Variation of Multiposition Variance for Happy and Sad Emotions
|
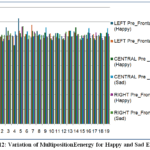 |
Figure 12: Variation of Multiposition Eenergy for Happy and Sad Emotions
|
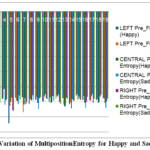 |
Figure 13: Variation of Multiposition Entropy for Happy and Sad Emotions
|
Table 5, Table 6 and Table 7 shows the statistical features. Box plots provide a visualization of summary statistics for sample data which is nothing but the statistical parameters for each CPPG of the three positions for a number of subjects. The sample data is calculated for 21 subjects for happy and sad the box-plots are plotted. Each box-plot contains the following features:
Table 5: Statistical values of Central Prefrontal CPPG signal
|
Central Prefrontal CPPG |
||
|
Statistical Parameter |
Happy |
Sad |
|
Mean |
123.083 |
122.687 |
|
Variance |
421.207 |
225.108 |
|
Energy |
15665.1 |
15548.2 |
|
Entropy |
-6.0066E+007 |
-6.02E+007 |
|
Central: A6 |
||
|
Mean |
934.02 |
969.568 |
|
Variance |
6357 |
3432.34 |
|
Energy |
899187 |
962977 |
|
Entropy |
-2.27E+008 |
-2.99E+008 |
|
Central: D6 |
||
|
Mean |
6337.6 |
4585.37 |
|
Variance |
7.55E+007 |
4.15E+007 |
|
Energy |
6337.6 |
4585.37 |
|
Entropy |
-4.99E+010 |
-2.24E+010 |
Table 6: Statistical values of Left Prefrontal CPPG signal
|
Left Prefrontal CPPG |
||
|
Statistical Parameter |
Happy |
Sad |
|
Mean |
122.885 |
121.617 |
|
Variance |
162.895 |
176.625 |
|
Energy |
15272.3 |
15095.2 |
|
Entropy |
-5.89E+007 |
-5.813E+007 |
|
Left: A6 |
||
|
Mean |
940.053 |
944.013 |
|
Variance |
3354.72 |
1969.59 |
|
Energy |
884758 |
891916 |
|
Entropy |
-2.69E+008 |
-2.67E+008 |
|
Left: D6 |
||
|
Mean |
2996.35 |
2640.63 |
|
Variance |
1.711E+007 |
1.6025E+007 |
|
Energy |
3178.28 |
2688.58 |
|
Entropy |
-1.122E+010 |
-8.99E+009 |
Table 7: Statistical Values of Right Prefrontal CPPG Signal
|
Left Prefrontal CPPG |
||
|
Statistical Parameter |
Happy |
Sad |
|
Mean |
122.749 |
122.325 |
|
Variance |
114.271 |
123.875 |
|
Energy |
15165.2 |
15196.2 |
|
Entropy |
-5.8315E+007 |
-5.8374E+007 |
|
Right: A6 |
||
|
Mean |
937.214 |
944.294 |
|
Variance |
1295.76 |
2580 |
|
Energy |
879257 |
892011 |
|
Entropy |
-2.647E+008 |
-2.735E+008 |
|
Right: D6 |
||
|
Mean |
2156.49 |
1915.01 |
|
Variance |
9.228E+006 |
8.085E+006 |
|
Energy |
15665.1 |
15548.2 |
|
Entropy |
-5.34E+009 |
-4.38E+009 |
Discussions
Statistical Analysis at Central Prefrontal CPPG
For central PPGsignal mean and variance values for happyare124.69 and 425.87 respectively and for sad 117.98and 490.98respectively. Difference in mean between Happy and Sad is 6.71and difference in variance between Happy and Sad 65.11.
For central A6 scale mean and variance values for happy are 934.02 and 6357 respectively and for sad 969.568 and 3432.34 respectively. Difference in mean between Happy and Sad is 35.58 and difference in variance between Happy and Sad 2924.66.
For central D6 scale mean and variance values for happy are 6337.6 and 9.228E+006 respectively and for sad 1915.01 and 8.085E+006 respectively. Difference in mean between happy and sad is 4422.59. For central D6 scale difference in variance between Happy and Sad is 1.14E+006.
For central PPG signal energy and entropy values for happy are6372786.75 and-62023464.36 respectively and for sad5749671.50 and -55449269.20respectively. Difference in energy between Happy and Sad is 623115.25 and difference in entropy between Happy and Sad is 6.57E+006
For central A6 scale energy and entropy values for happy are 899187 and -2.647E+008 respectively and for sad 892011 and -2.735E+008 respectively. Difference in energy between Happy and Sad is 7176 and difference in entropy between Happy and Sad is 8.8E+006.
For central D6 scale energy and entropy values for happy 6337.6 and 9.228E+006 respectively and for sad 1915.01 and 8.085E+006 respectively. For central D6 scale difference in energy between happy and sad 4422.59 and difference in entropy between Happy and Sad is 1.14E+006.
Statistical Analysis at Left Prefrontal CPPG
For left PPG signal mean and variance values for happy are 122.69and115.99respectively and for sad are 121.50 and 258.19respectively. Difference in mean between Happy and Sad is 1.19and difference in variance between happy and sad 142.2.
For left A6 scale mean and variance values for happy are 940.053 and 3354.72respectively and for sad are 944.013 and 1969.59 respectively. Difference in mean between Happy and Sad is 3.96 and difference in variance between happy and sad 1385.13.
For left D6 scale mean and variance values for happy are 2996.35 and 1.711E+007 respectively and for sad are 2640.63 and 1.6025E+007 respectively. Difference in mean between happy and sad is 355.72 and difference in variance between Happy and Sad is 1.08E+006.
For left PPG signal energy and entropy values for happy are 6052535.75 and-58359672.86respectively and for sad are5993139.25 and -57842681.89respectively. Difference in energy between Happy and Sad is 59396.25 and difference in entropy between Happy and Sad 5.16E+005.
For left A6 scale energy and entropy values for happy are 884758 and-2.69E+008 respectively and for sad are 891916and -2.67E+008 respectively. Difference in energy between Happy and Sad is 7158 and difference in entropy between Happy and Sad 2.0E+006.
For left D6 scale energy and entropy values for happy are 3178.28 and -1.122E+010 respectively and for sad are 2688.58 and -8.99E+009 respectively. Difference in energy between Happy and Sad is 489 and difference in entropy between Happy and Sad is 2.23E+009.
Statistical Analysis at Right Prefrontal CPPG(pending)
For right A6 scale mean and variance values for happy are 937.214 and 1295.76 respectively and for sad are 944.294 and 2580 respectively. Difference in mean between Happy and Sad is 7.08 and difference in variance between happy and sad is 1284.24.
For right A6 scale mean and variance values for happy are 937.214and 1295.76respectively and for sad are 944.294 and 2580respectively. Difference in mean between Happy and Sad is 7.08 and difference in variance between happy and sad is 1284.24.
For right D6 scale mean and variance values for happy are 2156.49and 9.228E+006respectively and for sad are 1915.01 and 8.085E+006 respectively. Difference in mean between happy and sad is 241.48 and difference in variance between Happy and Sad is 1.143E+006.
For right A6 scale energy and entropy values for happy are 879257 and -2.647E+008 respectively and for sad are 892011 and -2.735E+008 respectively. Difference in energy between Happy and Sad is 12754 and difference in entropy between Happy and Sad 9.0 E+006.
For right A6 scale energy and entropy values for happy are 879257and -2.647E+008respectively and for sad are 892011 and-2.735E+008 respectively. Difference inenergy between Happy and Sad is 12754 and difference in entropy between Happy and Sad 9.0 E+006.
For rightD6 scale energy and entropy values for happy 15665.1 and -5.34E+009respectively and for sad 15548.2 and -4.38E+009respectively. Difference in energy between Happy and Sad is116.9 and difference in entropy between Happy and Sad is 9.6E+008.
The CPPG signals for happy and sad emotions are decomposed using wavelet transform to different wavelet sub-bands based on their frequency content. Support Vector Machines (SVM) linear, K nearest neighbour (KNN) and ANN are used to classify the emotions using CPPG signal..
For all feature comparisons f-Test two sample for variances is carried out with α=0.05 and p value =0.00022 is shown in Table 8. The accuracy of the KNN classifier is observed to be 80%, SVM classifier 60% and ANN classifier 70%. Results are shown in Table 9.
Table 8 : F-Test Two-Sample for Variances
|
F-Test Two-Sample for Variances |
||
|
Variable 1 |
Variable 2 |
|
|
Mean |
526.3161087 |
323.7651451 |
|
Variance |
562277.6722 |
89496.79592 |
|
Observations |
18 |
18 |
|
df |
17 |
17 |
|
F |
6.282657009 |
|
|
P(F<=f) one-tail |
0.000220186 |
|
|
F Critical one-tail |
2.271892889 |
|
Table 9: Classification Report
|
Classification Report |
|||||||
|
Classifier |
TP |
TN |
FP |
FN |
Accuracy(%) |
Sensitivity(%) |
Specificity(%) |
|
KNN |
4 |
3 |
1 |
2 |
70 |
66.66 |
75 |
|
SVM Linear |
2 |
3 |
3 |
2 |
50 |
50 |
50 |
|
ANN |
3 |
3 |
2 |
2 |
60 |
60 |
60 |
Conclusion
The signal is recorded at three positions: left, central and right prefrontal position. The signal is decomposed at sixth level by Daubechies wavelet, level as the central frequency of 6th level matches with signal frequency. After sixth level decomposition statistical analysis was done. The above analysis reveals that these multi position, subbands level statistical features can help to detect and localize the activity and emotions. It is observed that statistical values are different for different emotions. As the difference in the statistical parameters was found to be more in central prefrontal PPG with respect to left and right prefrontal PPG. So the features of central PPG can be used for classification of emotions. It reduces the data base and system complexity for optimal result.
Acknowledgement
We would like to express our sincere gratitude to all those who contributed to the successful completion of our research paper titled “EEG-Based Analysis of Chakra Meditation Using Audio Frequencies.” First and foremost, we are deeply thankful to Dr. Padma Pushpakala and Dr. M Sundararajan for their invaluable guidance, constant encouragement, We are also grateful to the Department of Instrumentation and Control, Cummins College of Engineering for Women, Pune, India, for providing the necessary resources and a conducive environment to carry out this research.
Funding Sources
The author(s) received no financial support for the research, authorship, and/or publication of this article
Conflict of Interest
The author(s) do not have any conflict of interest.
Data Availability Statement
This statement does not apply to this article. The Data is captured in the Cummins college of Engineering for Women.
Ethics Statement
Verbal consent was recorded from the participants before participating in this study.
Informed Consent Statement
This study did not involve human participants, and therefore, informed consent was not required.
Clinical Trial Registration
This research does not involve any clinical trials.
Permission to reproduce material from other sources
Not Applicable
Author Contributions
- Nivedita Daimiwal: Conceptualization, Methodology, Writing – Original Draft, Data Acquisition. Analaysis.
- Revati Shriram: Formal Analysis, Validation, Writing – Review & Editing
References
- M. Alarcao, M.J. Fonseca, Emotions recognition using EEG signals: A surveyIEEE Trans. Affect.Comput. 2017;10 (3): 74-393
CrossRef - Zheng, J. Zhu, B. Lu, Identifying stable patterns over time for emotion recognition from EEG,IEEE Trans. Affect. Comput.2017;10 (3): 417-429.
CrossRef - Yin, X. Zheng, B. Hu, Y. Zhang, X. Cui,EEG emotion recognition using fusion model of graph convolutional neural networks and LSTM, Appl. Soft Comput. 2021;100 :106954
CrossRef - Cvetkovic, D., Derya,E., Cosic,IWavelet Transform Feature extraction from PPG,ECG and EEG signal responses to ELF PEMF exposure. Digital signal processing. 2008;18(5):861-874.
CrossRef - Elgendi,M.The Analysis of Fingertip Photoplethysmogram Signals. Current Cardiology Reviews.2012;8: 14-25.
CrossRef - Gil, E. and Laguna, P.PTT Variability for Discrimination of Sleep Apnea Related Decreases in the Amplitude Fluctuations of PPG Signal in Children. IEEE Transactions on Biomedical Engineering. 2010; 57(5):1079-88.
CrossRef - Hayato,F. And Haruki, K. Estimating Heart Rate using Wrist-type Photoplethysmography and Acceleration sensor while running. 34th Annual International Conference of the IEEE EMBS San Diego, California USA. 28 August – 1 September, 2012:2901-4.
CrossRef - Kamshilin, A. and Miridonov, S. Photoplethysmography Imaging of high spatial resolution, Biomedical optical express. 2011; 2(4):996-1006.
CrossRef - Laulkar,R. and Daimiwal,N. Acquisition of PPG signal for diagnosis of parameters related to heart. Physics and Technology of Sensors,ISPTS, 1st International Symposium, IEEE Conference Publications. 2012.
CrossRef - May,J.M. and Kyriacou,P.Development of an Opoelectronic sensor for the Investigation of Photoplethysmographic signal from the anterior Fontanel of the Newborn’,33rd Annual International Conference of the IEEE EMBS,Boston USA,September,2011.
CrossRef - Murthy,V., Ramamoorthy,S. ANALYSIS OF PHOTOPLETHYSMOGRAPHIC SIGNALS OF CARDIOVASCULAR PATIEN. Proceedings of the 23rd Annual EMBS International Conference, October 25-28, Istanbul, Turkey, 2001.
- Sangurmath,S . and Daimiwal,N. Non-Invasive Blood Flow Measurement Using Optical Sensor. Intl J EnggSciAdvResearch Sep;1(3):121-124 . 2015.
- Sharma, L.N., Tripathy.R.K., and Dandapat.S. Multiscale Energy and Eigenspace Approach to Detection and Localization ofMyocardial Infarction. IEEE TRANSACTIONS ON BIOMEDICAL ENGINEERING,VOL.2015;62(7):1827-1837.
CrossRef - Sundararanjan,MOptical Sensor Based instrument for Correlative Analysis of Human ECG and Breathing Signal”, International Journal of Electronic Engineering Research 2009; 1:287-298.
- Wu, T. , Guo-Zheng,Y., Bang-Hua,Y. EEG feature extraction based on wavelet packet decomposition for brain computer interface, Measurement. 2008;41: 618–625.
CrossRef - Zaman,T. and Kyriacou, P. Development of a Reflectance Photoplethysmographic Sensor used for the Assessment of Free Flap Perfusion’, 33rd Annual International Conference of the IEEE EMBS Boston, Massachusetts USA, August 30 – September 3, 2011.
- Himanshu KUMAR, Nagarajan GANAPATHY,Classification of Emotional States Using EEG Signals and Wavelet Packet Transform Features.© 2022 European Federation for Medical Informatics (EFMI) and IOS Press.
- Jae A, Wave Detection in Acceleration Plethysmogram, Health Inform Res.,2015; 21(2): 111–117.
CrossRef - Wang X. Y., Zhou H. L., Xue W. C., Zhu Z. B., Jiang W. N., Feng J. W., et al. (2022). The hybrid discrete-dimensional frame method for emotional film selection. Psychol.2022; 42: 30077–30092.
CrossRef - Virtanen P., Gommers R., Oliphant T. E., Haberland M., Reddy T., Cournapeau D., et al. (2020). SciPy 1.0: fundamental algorithms for scientific computing in Python. Nat. Methods.2020;17:261–272.
CrossRef - Sarma P., Barma S. Emotion recognition by distinguishing appropriate EEG segments based on random matrix theory. Signal Proces.2021;70(1):102991.
CrossRef - Paul A., Chakraborty A., Sadhukhan D., Pal S., Mitra M. A simplified PPG based approach for automated recognition of five distinct emotional states. Tools Appl. 2024;83:30697–30718.
CrossRef - Ma H., Zhang D., Wang Y., Ding Y., Yang J., Li K. Prediction of early improvement of major depressive disorder to antidepressant medication in adolescents with radiomics analysis after ComBat harmonization based on multiscale structural MRI. BMC Psychiatry. 2023;23(1):466
CrossRef

Accepted on: 5-06-2026
Second Review by: Dr. Anjaneyulu Vinukonda and Dr. Abeer Gatea
Final Approval by: Dr H Fai Poon