
Manuscript accepted on :04-02-2026
Published online on: 27-02-2026
Plagiarism Check: Yes
Reviewed by: Dr. Hassan Shora
Second Review by: Dr. Patel Maulik
Final Approval by: Dr. Anton R Keslav
Hala Sabry Alsaedy1* , Ragaa Ramadan Mohamed 1, Mai Elsaied Abdelal1, Alshaymaa Abd Elbadie Abd Elalim2, Eman Refaat Youness3 and Ahmed El-Sisi4
1Department of Internal Medicine, Faculty of Medicine for Girls, Al-Azhar University, Egypt
2Department of Clinical Pathology, Faculty of Medicine for Girls, Al-Azhar University, Egypt.
3Medical biochemistry Department, National Research Center, Egypt
4 Department of Internal Medicine and nephrology, Institute of Urology and Nephrology, El-Mataria, Egypt
Corresponding Author E-mail:hala_sabry6@yahoo.com
DOI : https://dx.doi.org/10.13005/bpj/3387
Abstract
This prospective cohort study evaluated the impact of Ramadan fasting on 162 patients with chronic kidney disease (CKD) and end-stage renal disease (ESRD) on regular hemodialysis. Participants were categorized based on fasting behavior and renal status. Biochemical and clinical parameters were assessed before, during, and after Ramadan. Results indicated that fasting was generally well-tolerated, though significant transient increases in blood urea, potassium, and phosphate were observed during fasting periods, particularly among ESRD patients fasting on dialysis days. Serum sodium and eGFR showed significant declines over time in both fasting and non-fasting CKD groups. No adverse effects on albumin or creatinine stability were noted in appropriately supervised patients. The study concludes that Ramadan fasting can be safe for stable CKD and ESRD patients with careful monitoring, dietary management, and individualized medical supervision to mitigate metabolic fluctuations.
Keywords
Chronic Kidney Disease; End-Stage Renal Disease; Fasting; Hemodialysis; Ramadan
Download this article as:| Copy the following to cite this article: Alsaedy H. S, Mohamed R. R, Abdelal M. E, Elalim A. A. E. A, Youness E. R, El-Sisi A. Effect of Ramadan Fasting on Chronic Kidney Disease Patients. Biomed Pharmacol J 2026;19(1). |
| Copy the following to cite this URL: Alsaedy H. S, Mohamed R. R, Abdelal M. E, Elalim A. A. E. A, Youness E. R, El-Sisi A. Effect of Ramadan Fasting on Chronic Kidney Disease Patients. Biomed Pharmacol J 2026;19(1). Available from: https://bit.ly/4aZeB8v |
Introduction
Chronic kidney disease (CKD) is characterized by kidney damage or an estimated glomerular filtration rate (eGFR) below 60 ml/min/1.73 m², lasting for a minimum of three months, regardless of etiology. It is a condition characterized by a gradual decrease of kidney function, ultimately necessitating renal replacement therapy (dialysis or transplantation).1
Hemodialysis (HD) is an artificial method for eliminating surplus fluids, minerals, and poisons from the blood with compromised renal function. HD is a widely utilized renal replacement therapy and a life-sustaining intervention for cases with CKD. The technique is related to elevated morbidity, cardiovascular risk, malnutrition, and death.2
Ramadan is a sacrosanct month for Muslims globally; it is the ninth lunar month of the Islamic calendar. Fasting Ramadan constitutes the fourth of the five pillars of Islam, a religious duty on every adult, rational, and healthy Muslim, who are required to fast from sunrise to sunset. This duration may range from twelve to twenty-two hours, contingent upon seasonal and regional characteristics. Individuals who are severely unwell, possess substantial health issues, menstruation females, pre-pubertal kids, and travelers are exempt from fasting. Ramadan fasting has been demonstrated to be related to favorable effects on lipid profiles, fasting blood glucose, and body weight among healthy subjects.3
Cases with CKD and those undergoing hemodialysis are exempt from fasting because of their health condition; yet, some individuals persist on fasting because of the exquisite spiritual nature of the holy month.4 The significant alteration in the timing and composition of patients’ meals throughout the breaking of their fast, including the abundance of festive Ramadan foods, dried fruits, juices, and particularly fluid intake, raises concerns among healthcare professionals regarding the safety of Ramadan fasting for cases with CKD and under their supervision.3
However, fasting during Ramadan in CKD and ESRD patients is not without risks. Potential complications include acute kidney injury, hyperkalemia, worsening systolic hypertension, and significant interdialytic weight gain in hemodialysis patients, particularly in those with advanced disease (stages 4–5) or unstable clinical conditions.5 Patients with unstable kidney disease, acute intercurrent illness, or those within the first year of a kidney transplant are generally advised to avoid fasting due to heightened risks of dehydration and metabolic disturbances.6
Some research advises against fasting, as those with CKD and those undergoing HD carry an elevated risk of dehydration during prolonged fasting periods and, conversely, are susceptible to fluid overload from high fluid consumption following breaking the fast after sunset.7 Ramadan fasting did not correlate with significant adverse effects in kidney transplant cases or urinary risk factors for calculus development.8
The aim of this prospective cohort research was to evaluate the impact of daily and partial Ramadan fasting on key biochemical and clinical markers in patients with CKD and those undergoing hemodialysis who chose to fast, compared to CKD and hemodialysis cases who chose not to fast throughout Ramadan.
Materials and Methods
This prospective cohort study was conducted between February and April 2024 and included 162 adult patients were collected from Al-Zahraa University Hospital, Hemodialysis Unit and The National Institute of Nephrology and Urology at El-Mataria, they were divided into 48 patients with CKD (stages 1–5), staged based on eGFR determined utilizing the simplified Modification of Diet in Renal Disease (MDRD) equation, which includes serum creatinine, age & sex and 114 patients with ESRD on regular hemodialysis for more than 3 months. Patients were classified into five subgroups according to their renal status and fasting behavior, CKD Group I included CKD (stage 1–5) patients who did not fast, CKD Group II included CKD (stage 1–5) patients who fast during Ramadan, ESRD Group I included ESRD patients on HD who did not fast during Ramadan, ESRD Group II included ESRD patients who fasted only on non-dialysis days and ESRD Group III included ESRD patients who fasted on both dialysis and non-dialysis days.
Inclusion Criteria
All participants were aged ≥18 years, diagnosed with CKD (stage 1 or higher, based on eGFR) and ESRD patients on maintenance hemodialysis for >3 months
Exclusion Criteria
This study excluded clinically unstable patients in the past 3 months, patients with psychiatric instability, with uncontrolled diabetes or recurrent hypoglycemia, with active infection or inflammatory disease and hematologic disorders or malignancy.
Diagnostic Criteria
Hypertension was defined as systolic blood pressure ≥140 mmHg and/or diastolic ≥90 mmHg, or current use of antihypertensive medication. Diabetes mellitus was diagnosed according to American Diabetes Association (ADA) criteria (fasting glucose ≥126 mg/dL, HbA1c ≥6.5%, or use of antidiabetic drugs). Dehydration was clinically assessed based on symptoms (thirst, dry mucosa, reduced skin turgor) and biochemical markers (elevated serum sodium, urea).
Methods
All patients were subjected to:
A comprehensive clinical assessment. Biochemical and hematological parameters were measured at three time points: two weeks before Ramadan (baseline), on the 15th day of Ramadan, and two weeks after Ramadan. The average daily fasting duration during Ramadan was approximately 15 hours. Fasting during dialysis was permitted only for stable patients under medical supervision.
Dialysis Protocol for (ESRD Group)
Hemodialysis was performed three times per week, each session lasting approximately 4 hours, using high-flux dialyzers and bicarbonate-based dialysate. Dialysate potassium concentration: 2.0–3.0 mmol/L based on pre-dialysis serum K+ Machines: Fresenius 4008S or equivalent. Access type: Arteriovenous (AV) fistula or tunneled central venous catheter. Blood flow rate: 250–350 mL/min. Dialysate flow rate: 500 mL/min. Anticoagulation: Unfractionated heparin unless contraindicated. Dry weight: Determined pre-Ramadan and used to guide ultrafiltration targets. Patients were monitored for intradialytic complications, especially those fasting during dialysis. Fasting on dialysis days was allowed only for stable patients under medical supervision.
Each participant underwent
Comprehensive medical history and clinical examination, laboratory investigations at three time points (two weeks before Ramadan, day 15 of Ramadan and two weeks after Ramadan). In hemodialysis patients, blood samples were withdrawn immediately before the dialysis session to avoid dilutional effects and ensure accurate pre-dialysis values.
Blood Sampling
Five milliliters (5ML) of venous blood were collected from each patient using standard aseptic techniques, 2Ml were placed into Ethylenediaminetetraacetic acid (EDTA) (K3EDTA) vacutainer for CBC assay. CBC was done immediately samples were centrifuged at 2000-3000 rpm for 20 minutes. The separated serum was used the immediate assay of Blood Urea, Ceatinine, S.uric acid, sodium, potassium, calcium, phosphate and Albumin
Laboratory tests included
complete blood count (CBC), serum creatinine, blood urea, serum sodium, potassium, calcium, phosphorus, and serum uric acid. eGFR calculated for CKD patients using the simplified MDRD equation [eGFR (mL/min/1.73 m²)=186 × (Serum Creatinine)^-1.154 × (Age)^-0.203 × (0.742 if female)].
Patient Guidance and Monitoring
All patients were advised to continue prescribed medications and dietary guidelines, to avoid high-potassium foods, to drink 1.5–2 liters of water during non-fasting hours, to monitor daily weight and to report symptoms including fatigue, dizziness, shortness of breath, or persistent headache. Patients at risk of hyperkalemia were advised to stop Angiotensin-converting enzyme inhibitors (ACE) inhibitors or Angiotensin receptor blockers (ARBs) and switch to alternative antihypertensives. Calcium or sodium polystyrene sulfonate was prescribed when necessary.
Comparative analyses were performed in two stages, a comparison between fasting and non-fasting groups for both CKD and ESRD cases to assess overall impact of fasting and within group longitudinal comparison fasting and non-fasting (CKD and ESRD) to evaluate changes over time, before, during, and after Ramadan.
Ethical consideration
The study protocol was approved by the Ethical Committee of Al-Azhar Faculty of Medicine for Girls (No. 2304). Written informed consent was obtained from all participants prior to inclusion.
Statistical Analysis
Material has been gathered, revised, coded, and input into the Statistical Package for Social Science (IBM SPSS) (IBM Corp. Released 2020). IBM SPSS Statistics for Windows, Version 27.0. Armonk, NY: IBM Corp. The quantitative information was given as means, standard deviations, and ranges for parametric information, and as medians and inter-quartile ranges (IQR) for non-parametric information. Qualitative variables have been expressed as counts and percentages. The comparison of groups of qualitative information was conducted utilizing the Chi-square test and/or Fisher’s exact test where the expected count in any cell was
Material has been gathered, revised, coded, and input into the Statistical Package for Social Science (IBM SPSS) (IBM Corp. Released 2020). IBM SPSS Statistics for Windows, Version 27.0. Armonk, NY: IBM Corp. The quantitative information was given as means, standard deviations, and ranges for parametric information, and as medians and inter-quartile ranges (IQR) for non-parametric information. Qualitative variables have been expressed as counts and percentages. The comparison of groups of qualitative information was conducted utilizing the Chi-square test and/or Fisher’s exact test where the expected count in any cell was below five. The comparison of two independent groups with quantitative data and parametric distribution has been carried out utilizing the independent t-test, whereas the comparison with non-parametric distribution has been performed utilizing the Mann-Whitney test. The comparison of multiple independent groups with quantitative information and a parametric distribution has been conducted utilizing the One-Way ANOVA test, followed by post hoc analysis with the LSD test. For non-parametric distribution, the Kruskal-Walli’s test has been utilized, followed by post hoc analysis utilizing the Mann-Whitney test. The comparison of several paired groups with quantitative information and a parametric distribution was conducted utilizing the Repeated Measures ANOVA test. The p-value was deemed significant if P-value under 0.05.
Results
Table 1 demonstrates that there were no statistically significant differences between Group I and Group II in terms of gender distribution (p = 0.350) or mean age (p = 0.225) of the CKD patients.
Table 1: Comparison between Group I and Group II regarding demographic data of CKD patients
|
CKD |
Group I |
Group II |
Test value |
P-value |
Sig. |
|
|
No. = 15 |
No. = 33 |
|||||
|
Sex |
Male |
9 (60.0%) |
15 (45.5%) |
0.873* |
0.350 |
NS |
|
Female |
6 (40.0%) |
18 (54.5%) |
||||
|
Age (years) |
Mean ± SD |
54.93 ± 15.17 |
59.76 ± 11.31 |
-1.229• |
0.225 |
NS |
P-value > 0.05: Non-significant; P-value < 0.05: Significant; P-value < 0.01: Highly significant
*: Chi-square test; •: Independent t-test
Table 2 demonstrates that during Ramadan, Group II showed significantly higher blood urea levels compared to Group I with a p-value of 0.030. Additionally, both groups exhibited a significant increase in blood urea levels during Ramadan followed by a significant decrease after Ramadan (p < 0.001 for both). The table also shows that the creatinine level did not change over time in group I (p = 0.107) while it was significantly increased in group II during Ramadan and after Ramadan than at baseline with p-value <0.001. Regarding Serum sodium levels were significantly higher in group I compared to group II before Ramadan, during Ramadan and after Ramadan. Within-group analysis there were no significant changes in sodium levels over time in both groups (group I: p = 0.741; group II: p = 0.220). Also, the table shows that there was no statistically significant difference between group I and group II regarding potassium level before Ramadan (p = 0.438). However, during Ramadan, potassium level was significantly higher in group II compared to group I. After Ramadan, the difference between the two groups was again non-significant (p = 0.284). Both groups exhibited highly significant increase in potassium levels over time (p < 0.001 for each group). Also, regarding calcium level, before Ramadan, no significant difference existed between group I and group II (p = 0.222). During Ramadan, group I showed significantly higher calcium levels compared to group II. After Ramadan, no significant difference between both groups (p = 0.371). Both groups maintained stable calcium levels over time, with no significant change. The table also shows that during Ramadan, group II showed significantly higher phosphate levels than group I Also, After Ramadan, group II maintaining higher levels versus group I While Group I exhibited no significant changes within-group over time (p = 0.142), group II showed highly significant increase (p < 0.001). Also, Before Ramadan, group I had significantly lower albumin levels compared to group II while no significant difference during (p = 0.136) and after (p = 0.200) Ramadan. Group I exhibited a significant increase within-group over time (p = 0.025). Conversely, group II maintained stable albumin levels throughout (p = 0.808). Also, both groups exhibited highly significant declines in eGFR over time. In Group I, eGFR progressively decreased from before to during and after Ramadan, with all time points being significantly different. In Group II, eGFR remained stable from before to during, but significantly declined after Ramadan.
Table 2: Comparison between Group I and Group II regarding kidney function tests and of CKD patients
|
CKD |
Group I |
Group II |
Test value |
P-value |
Sig. |
||
|
No. = 15 |
No. = 33 |
||||||
|
Blood urea (mg/dl) |
|||||||
|
Before |
Median (IQR) |
90 (49 – 119)a |
78 (65 – 110)a |
-0.534≠ |
0.593 |
NS |
|
|
Range |
18.7 – 139 |
45 – 195 |
|||||
|
During |
Median (IQR) |
109 (65 – 160)b |
130 (120 – 178)b |
-2.175≠ |
0.030 |
S |
|
|
Range |
35 – 180 |
68 – 190 |
|||||
|
After |
Median (IQR) |
90 (55 – 120)a |
88 (70 – 102)a |
-0.367≠ |
0.713 |
NS |
|
|
Range |
30 – 240 |
42 – 160 |
|||||
|
Test value / P-value |
23.065 / <0.001 (HS) |
25.922 / <0.001 (HS) |
|||||
|
Creatinine (mg/dl) |
|||||||
|
Before |
Median (IQR) |
2.5 (2 – 3.4) |
2.4 (1.8 – 3.1)a |
-0.579≠ |
0.562 |
NS |
|
|
Range |
1 – 5.4 |
1.5 – 5.5 |
|||||
|
During |
Median (IQR) |
2.7 (2.2 – 3.7) |
2.8 (2.2 – 3.7)b |
-0.111≠ |
0.911 |
NS |
|
|
Range |
1.2 – 6.5 |
1.3 – 5.8 |
|||||
|
After |
Median (IQR) |
2.5 (2.2 – 3.5) |
2.4 (2.1 – 3.5)b |
-0.390≠ |
0.697 |
NS |
|
|
Range |
1.5 – 7 |
1.2 – 5.6 |
|||||
|
Test value / P-value |
4.478 / 0.107 (NS) |
14.966 / <0.001 (HS) |
|||||
|
UA (mg/dl) |
|||||||
|
Before |
Mean ± SD |
6.55 ± 0.70 |
6.52 ± 0.98 |
0.112• |
0.911 |
NS |
|
|
Range |
5.4 – 8.1 |
4.7 – 8.7 |
|||||
|
During |
Mean ± SD |
5.91 ± 1.28 |
6.37 ± 0.97 |
-1.394• |
0.170 |
NS |
|
|
Range |
4.1 – 8.2 |
4.7 – 8.7 |
|||||
|
After |
Mean ± SD |
6.49 ± 1.05 |
6.66 ± 0.79 |
-0.636• |
0.528 |
NS |
|
|
Range |
5 – 8.5 |
4.8 – 8.2 |
|||||
|
Test value / P-value |
1.556 / 0.459 (NS) |
5.136 / 0.077 (NS) |
|||||
|
S. Na (mmol/L) |
|||||||
|
Before |
Mean ± SD |
140.33 ± 4.10 |
136.61 ± 1.73 |
4.461• |
0.000 |
HS |
|
|
Range |
136 – 150 |
135 – 142 |
|||||
|
During |
Mean ± SD |
139.07 ± 3.22 |
136.85 ± 1.91 |
2.989• |
0.004 |
HS |
|
|
Range |
134 – 145 |
135 – 142 |
|||||
|
After |
Mean ± SD |
137.80 ± 1.97 |
136.33 ± 1.02 |
3.410• |
0.001 |
HS |
|
|
Range |
135 – 141 |
135 – 138 |
|||||
|
Test value / P-value |
0.300 / 0.741 |
1.565 / 0.220 |
|||||
|
K (mmol/L) |
|||||||
|
Before |
Mean ± SD |
4.48 ± 0.68a |
4.33 ± 0.56a |
0.783• |
0.438 |
NS |
|
|
Range |
3.7 – 6 |
3.5 – 6.9 |
|||||
|
During |
Mean ± SD |
5.35 ± 0.76b |
6.06 ± 0.91b |
-2.628• |
0.012 |
S |
|
|
Range |
4.23 – 6.9 |
3.9 – 7.5 |
|||||
|
After |
Mean ± SD |
4.73 ± 0.65c |
4.53 ± 0.53c |
1.085• |
0.284 |
NS |
|
|
Range |
3.8 – 5.8 |
3.5 – 6 |
|||||
|
Test value / P-value |
62.922 / < 0.001 |
71.278 / < 0.001 |
|||||
|
Ca (mg/dl) |
|||||||
|
Before |
Mean ± SD |
8.44 ± 0.91 |
8.70 ± 0.53 |
-1.239• |
0.222 |
NS |
|
|
Range |
6.5 – 9.8 |
6.9 – 10 |
|||||
|
During |
Mean ± SD |
9.45 ± 0.69 |
8.90 ± 0.42 |
3.443• |
0.001 |
HS |
|
|
Range |
8.5 – 10.4 |
8.2 – 10 |
|||||
|
After |
Mean ± SD |
8.85 ± 0.44 |
8.70 ± 0.55 |
0.904• |
0.371 |
NS |
|
|
Range |
7.9 – 9.5 |
6.9 – 9.5 |
|||||
|
Test value / P-value |
0.525 / 0.573 |
3.069 / 0.061 |
|||||
|
PO4 (mg/dl) |
|||||||
|
Before |
Mean ± SD |
3.83 ± 1.03 |
3.87 ± 0.55a |
-0.160• |
0.874 |
NS |
|
|
Range |
2.2 – 6 |
2.4 – 4.8 |
|||||
|
During |
Mean ± SD |
4.23 ± 1.10 |
5.02 ± 1.23b |
-2.123• |
0.039 |
S |
|
|
Range |
2.7 – 6.3 |
3.2 – 6.8 |
|||||
|
After |
Mean ± SD |
3.71 ± 0.76 |
4.20 ± 0.38c |
-2.960• |
0.005 |
HS |
|
|
Range |
2.4 – 4.7 |
3.4 – 4.9 |
|||||
|
Test value / P-value |
2.017 / 0.142 |
27.585 / 0.000 |
|||||
|
Alb (g/dl) |
|||||||
|
Before |
Mean ± SD |
3.91 ± 0.34a |
4.44 ± 0.41 |
-4.320• |
0.000 |
HS |
|
|
Range |
3.4 – 4.5 |
3.8 – 5 |
|||||
|
During |
Mean ± SD |
4.20 ± 0.47a |
4.40 ± 0.41 |
-1.516• |
0.136 |
NS |
|
|
Range |
3.5 – 5 |
3.6 – 5 |
|||||
|
After |
Mean ± SD |
4.25 ± 0.38b |
4.43 ± 0.45 |
-1.301• |
0.200 |
NS |
|
|
Range |
3.7 – 5 |
3.4 – 5.1 |
|||||
|
Test value / P-value |
3.929 / 0.025 |
0.110 / 0.808 |
|||||
|
eGFR |
|||||||
|
Before |
Median (IQR) |
36 (25 – 51)a |
35 (26 – 44)a |
-0.156≠ |
0.876 |
NS |
|
|
Range |
12 – 77 |
14 – 73 |
|||||
|
During |
Median (IQR) |
31 (22 – 47)b |
31 (22 – 45)a |
-0.367≠ |
0.713 |
NS |
|
|
Range |
10 – 69 |
9 – 77 |
|||||
|
After |
Median (IQR) |
27 (19 – 35)c |
22 (18 – 33)b |
-0.134≠ |
0.894 |
NS |
|
|
Range |
8 – 49 |
8 – 60 |
|||||
|
Test value / P-value |
24.740 / 0.000 |
21.330 / 0.000 |
|||||
P-value > 0.05: Non-significant; P-value < 0.05: Significant; P-value < 0.01: Highly significant
•: Independent t-test; ≠: Mann-Whitney test
Different superscript letter indicate significant difference between different follow up times
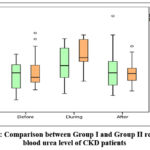 |
Figure 1: Comparison between Group I and Group II regarding blood urea level of CKD patients |
Table (3) shows that Within-group analysis revealed no significant changes in Hb levels over time in group I, while group II showed a statistically significant change (p = 0.037).
Also, group I had significantly higher white blood cell counts compared to group II before Ramadan, during Ramadan, and after Ramadan.
Also, group I had significantly higher platelet counts compared to group II before Ramadan and after Ramadan. Within-group analysis revealed statistically significant changes in platelet levels over time in both group I (p = 0.010) and group II (p = 0.017).
Table 3: Comparison between Group I and Group II regarding complete blood picture of CKD patients
|
CKD |
Group I |
Group II |
Test value |
P-value |
Sig. |
|
|
No. = 15 |
No. = 33 |
|||||
|
Hemoglobin (g/dl) |
||||||
|
Before |
Mean ± SD |
10.58 ± 1.74 |
9.95 ± 1.13a |
1.500• |
0.140 |
NS |
|
Range |
7.4 – 13.8 |
8.2 – 15 |
||||
|
During |
Mean ± SD |
10.02 ± 0.72 |
9.84 ± 1.13a,b |
0.575• |
0.568 |
NS |
|
Range |
8.6 – 11.5 |
8.5 – 15 |
||||
|
After |
Mean ± SD |
10.05 ± 0.82 |
9.66 ± 1.09b |
1.214• |
0.231 |
NS |
|
Range |
8.5 – 11.5 |
8 – 14.5 |
||||
|
Test value / P-value |
3.074 / 0.059 |
3.508 / 0.037 |
||||
|
WBCs (10e3/uL) |
||||||
|
Before |
Mean ± SD |
7.44 ± 1.51 |
5.83 ± 1.41 |
3.588• |
0.001 |
HS |
|
Range |
5 – 10.2 |
4 – 9 |
||||
|
During |
Mean ± SD |
6.65 ± 1.62 |
5.62 ± 1.48 |
2.173• |
0.035 |
S |
|
Range |
4.2 – 9 |
4 – 9 |
||||
|
WBCs After |
Mean ± SD |
7.23 ± 1.29 |
5.90 ± 1.64 |
2.775• |
0.008 |
HS |
|
Range |
4.8 – 9 |
4 – 10 |
||||
|
Test value / P-value |
0.526 / 0.576 |
0.457 / 0.619 |
||||
|
PLT (10e3/uL) |
||||||
|
Before |
Median (IQR) |
194 (167 – 290)a |
180 (166 – 190)a,c |
-2.288≠ |
0.022 |
S |
|
Range |
85 – 310 |
122 – 200 |
||||
|
During |
Median (IQR) |
190 (175 – 210)a |
185 (179 – 190)b |
-1.222≠ |
0.222 |
NS |
|
Range |
80 – 310 |
125 – 220 |
||||
|
After |
Median (IQR) |
190 (180 – 210)b |
175 (160 – 190)c |
-2.515≠ |
0.012 |
S |
|
Range |
70 – 240 |
140 – 200 |
||||
|
Test value / P-value |
5.055 / 0.010 |
4.621 / 0.017 |
||||
P-value > 0.05: Non-significant; P-value < 0.05: Significant; P-value < 0.01: Highly significant
•: Independent t-test; ≠: Mann-Whitney test
Different superscript letter indicate significant difference between different follow up times
Table (4) demonstrates that before Ramadan, non-hypertensive patients had significantly higher blood urea levels compared to hypertensive patients. This difference disappeared during Ramadan, but reappeared after Ramadan. Within-group analysis showed statistically significant changes in blood urea levels over time for both non-hypertensive (p=0.018) and hypertensive (p<0.001) patients.
The table also shows that non-hypertensive CKD patients had significantly higher creatinine levels compared to hypertensive patients before Ramadan and after Ramadan, with no significant difference during Ramadan. Within-group analysis revealed no significant changes in creatinine levels over time for non-hypertensive patients, while hypertensive patients showed statistically significant changes (p=0.009).
The table also demonstrates that both groups showed significant declines in eGFR over time (nonhypertensive: p=0.003; hypertensive: p=0.001)
Table 4: Relation between presence of hypertension and kidney function tests of CKD patients in different follow up period
|
Group II (CKD) |
Hypertension |
Test value |
P-value |
Sig. |
||
|
No |
Yes |
|||||
|
No. = 12 |
No. = 21 |
|||||
|
Blood urea (mg/dl) |
||||||
|
Before |
Median (IQR) |
100 (94.5 – 122.5)a,c |
70 (62 – 82)a |
-2.642≠ |
0.008 |
HS |
|
Range |
66 – 179 |
45 – 195 |
||||
|
During |
Median (IQR) |
133 (120 – 180)b |
130 (110 – 170)b |
-0.282≠ |
0.778 |
NS |
|
Range |
110 – 185 |
68 – 190 |
||||
|
After |
Median (IQR) |
101 (93 – 121)c |
79 (70 – 90)a |
-2.116≠ |
0.034 |
S |
|
Range |
42 – 145 |
49 – 160 |
||||
|
Test value / P-value |
6.259 / 0.018 |
20.868 / 0.000 |
||||
|
Creatinine (mg/dl) |
||||||
|
Before |
Median (IQR) |
2.95 (2.3 – 3.45) |
2.1 (1.7 – 2.55)a |
-2.102≠ |
0.036 |
S |
|
Range |
1.6 – 5.5 |
1.5 – 4.1 |
||||
|
During |
Median (IQR) |
3.45 (2.3 – 4.15) |
2.7 (2.2 – 3.4)b |
-1.199≠ |
0.231 |
NS |
|
Range |
1.6 – 5.8 |
1.3 – 4.3 |
||||
|
After |
Median (IQR) |
3.3 (2.4 – 3.75) |
2.2 (1.9 – 3)a |
-2.192≠ |
0.028 |
S |
|
Range |
1.4 – 5.6 |
1.2 – 5 |
||||
|
Test value / P-value |
0.727 / 0.467 |
7.100 / 0.009 |
||||
|
UA (mg/dl) |
||||||
|
Before |
Mean ± SD |
6.74 ± 1.14 |
6.39 ± 0.87 |
1.009• |
0.321 |
NS |
|
Range |
5.2 – 8.7 |
4.7 – 7.8 |
||||
|
During |
Mean ± SD |
6.57 ± 0.98 |
6.26 ± 0.97 |
0.866• |
0.393 |
NS |
|
Range |
5.6 – 8.7 |
4.7 – 8.2 |
||||
|
After |
Mean ± SD |
6.97 ± 0.83 |
6.49 ± 0.73 |
1.735• |
0.093 |
NS |
|
Range |
5.9 – 8.2 |
4.8 – 7.8 |
||||
|
Test value / P-value |
1.523 / 0.242 |
0.672 / 0.465 |
||||
|
eGFR |
||||||
|
Before |
Median (IQR) |
30 (25 – 39)a |
38 (30 – 47)a |
-1.480≠ |
0.139 |
NS |
|
Range |
14-65 |
16 – 73 |
||||
|
During |
Median (IQR) |
27.5 (15 – 43.5)a |
34 (24 – 47)a |
-1.180≠ |
0.238 |
NS |
|
Range |
9-65 |
11– 77 |
||||
|
After |
Median (IQR) |
18.5 (14 – 25.5)b |
28 (21 – 39)b |
-1.780≠ |
0.075 |
NS |
|
Range |
11–60 |
8 – 56 |
||||
|
Test value / P-value |
10.276 / 0.003 |
11.589 / 0.001 |
||||
P-value > 0.05: Non-significant; P-value < 0.05: Significant; P-value < 0.01: Highly significant
•: Independent t-test; ≠: Mann-Whitney test
Different superscript letter indicate significant difference between different follow up times
Table 5 shows no significant differences in blood urea levels between non-diabetic and diabetic CKD patients before, during, or after Ramadan. However, both groups showed highly significant within-group changes over time (non-diabetic: p=0.002; diabetic: p<0.001). Also, the table shows no significant differences in creatinine levels between non-diabetic and diabetic CKD patients before, during, or after Ramadan. Diabetic patients showed statistically significant changes (p=0.047). Regarding eGFR level, non-diabetic CKD patients had significantly higher eGFR than diabetic patients before Ramadan. Both groups showed significant declines in eGFR over time (non-diabetic: p=0.005; diabetic: p=0.001).
Table 5: Relation between presence of diabetes mellitus (DM) and kidney function tests of CKD patients in different follow up period.
|
Group II (CKD) |
DM |
Test value |
P-value |
Sig. |
||
|
No |
Yes |
|||||
|
No. = 13 |
No. = 20 |
|||||
|
Blood urea |
||||||
|
Before |
Median (IQR) |
82 (66 – 100)a |
75 (63.5 – 122.5)a,c |
-0.148≠ |
0.883 |
NS |
|
Range |
49 – 195 |
45 – 179 |
||||
|
During |
Median (IQR) |
160 (120 – 180)b |
128 (110 – 164)b |
-1.019≠ |
0.308 |
NS |
|
Range |
110 – 190 |
68 – 190 |
||||
|
After |
Median (IQR) |
85 (65 – 99)a |
89 (74 – 105.5)c |
-0.737≠ |
0.461 |
NS |
|
Range |
42 – 145 |
55 – 160 |
||||
|
Test value / P-value |
13.403 / 0.002 |
13.295 / 0.000 |
||||
|
Creatinine |
||||||
|
Before |
Median (IQR) |
2.1 (1.7 – 2.4) |
2.47 (1.99 – 3.4)a |
-1.385≠ |
0.166 |
NS |
|
Range |
1.5 – 4 |
1.6 – 5.5 |
||||
|
During |
Median (IQR) |
2.4 (1.9 – 3.4) |
2.95 (2.35 – 3.95)b |
-1.346≠ |
0.178 |
NS |
|
Range |
1.6 – 4.2 |
1.3 – 5.8 |
||||
|
After |
Median (IQR) |
2.2 (1.9 – 2.8) |
2.75 (2.15 – 3.6)a,b |
-1.217≠ |
0.223 |
NS |
|
Range |
1.4 – 5 |
1.2 – 5.6 |
||||
|
Test value / P-value |
2.637 / 0.121 |
3.650 / 0.047 |
||||
|
UA |
||||||
|
Before |
Mean ± SD |
6.77 ± 0.95 |
6.35 ± 0.98 |
1.215• |
0.233 |
NS |
|
Range |
5.6 – 8.7 |
4.7 – 8.2 |
||||
|
During |
Mean ± SD |
6.45 ± 1.00 |
6.32 ± 0.97 |
0.383• |
0.705 |
NS |
|
Range |
5.2 – 8.7 |
4.7 – 8.2 |
||||
|
After |
Mean ± SD |
6.85 ± 0.70 |
6.53 ± 0.84 |
1.138• |
0.264 |
NS |
|
Range |
5.9 – 8 |
4.8 – 8.2 |
||||
|
Test value / P-value |
2.284 / 0.139 |
0.628 / 0.498 |
||||
|
eGFR |
||||||
|
Before |
Median (IQR) |
42 (34 – 62)a |
30.5 (25– 40)a |
-2.417≠ |
0.016 |
S |
|
Range |
16 – 73 |
14 – 52 |
||||
|
During |
Median (IQR) |
42 (24 – 56)a |
30.5 (17 – 39)a |
-1.567≠ |
0.117 |
NS |
|
Range |
15 – 77 |
9 – 52 |
||||
|
After |
Median (IQR) |
29 (21 – 47)b |
20.5 (15 – 32)b |
-1.900≠ |
0.057 |
NS |
|
Range |
8–60 |
10 – 49 |
||||
|
Test value / P-value |
10.215 / 0.005 |
11.476 / 0.001 |
||||
P-value > 0.05: Non-significant; P-value < 0.05: Significant; P-value < 0.01: Highly significant
•: Independent t-test; ≠: Mann-Whitney test
Different superscript letter indicate significant difference between different follow up times
Table 6 shows that there was no statistically significant difference between group I, II and III regarding sex and age of ESRD patients.
Table 6: Comparison between Group I, Group II and Group III groups regarding demographic data of ESRD patients
|
ESRD |
Group I |
Group II |
Group III |
Test value |
P-value |
Sig. |
|
|
No. = 32 |
No. = 60 |
No. = 22 |
|||||
|
Sex |
Male |
22 (68.8%) |
35 (58.3%) |
15 (68.2%) |
1.269* |
0.530 |
NS |
|
Female |
10 (31.3%) |
25 (41.7%) |
7 (31.8%) |
||||
|
Age (years) |
Mean ± SD |
55.94 ± 9.26 |
51.00 ± 10.26 |
51.00 ± 9.87 |
2.855• |
0.062 |
NS |
|
Range |
38 – 69 |
22 – 67 |
22 – 62 |
||||
P-value > 0.05: Non-significant; P-value < 0.05: Significant; P-value < 0.01: Highly significant
*: Chi-square test; •: One Way ANOVA test
Table 7 reveals significant differences in blood urea levels between groups before Ramadan (p=0.023), with group I showing highest values compared to group II and group III. During Ramadan, there was also significant difference between groups (p=0.006), with group III demonstrating highest values versus both group I (p=0.003) and group II (p=0.007). No significant differences were observed post- Ramadan (p=0.714). Within-group analysis showed significant changes over time for group II (p<0.001) and group III (p<0.001), peaking during Ramadan. Regarding uric acid there was statistically significant differences during Ramadan (p=0.013), with group III showing lower levels versus group I and group II. Group I and II demonstrated significant within-group fluctuations (p=0.006 and p=0.002 respectively), peaking during Ramadan. Table 7 Shows significant post-Ramadan differences in sodium levels between groups (p=0.001), with group III maintaining highest values versus group I and group II. Group I demonstrated significant within-group fluctuations (p=0.007), decreasing post-Ramadan, while group III showed progressive increases (p=0.044). Regarding potassium level, significant difference were observed during (p<0.001) and after Ramadan (p=0.001). Group III showed remarkably elevated potassium during Ramadan versus group I and group II. All groups exhibited significant within-group changes (p<0.001 for all), peaking during Ramadan. While regarding calcium level, all groups showed significant within-group fluctuations (Group I: p=0.005; Group II: p=0.001; Group III: p=0.006), with lowest values during Ramadan period. Regarding phosphate level, there was statistically significant differences between groups during Ramadan (p<0.001), with group I showing highest values versus group II and group III. Group I and II demonstrated significant within-group changes (p<0.001 and p=0.045 respectively). Also, no significant difference between groups regarding albumin level. Also, group II and III showed significant within-group increase post-Ramadan (p<0.001 and p=0.039 respectively).Regarding dry weight, highly significant difference between groups occurred during Ramadan (p<0.001), with Group III showing highest values versus Group II. All groups demonstrated significant within-group fluctuations (p<0.001 for all).
Table 7: Comparison between Group I, Group II and Group III groups regarding kidney function tests and laboratory data of ESRD patients
|
ESRD |
Group I |
Group II |
Group III |
Test value |
P-value |
Sig. |
P1 |
P2 |
P3 |
||
|
No. = 32 |
No. = 60 |
No. = 22 |
|||||||||
|
Blood urea |
|||||||||||
|
Before |
Median (IQR) |
120.5 (108 – 149.5) |
105 (89.5 – 131.5) a,c |
110 (97 – 136) a,c |
7.528≠ |
0.023 |
S |
0.006 |
0.113 |
0.496 |
|
|
Range |
99 – 202 |
71 – 169 |
82 – 168 |
||||||||
|
During |
Median (IQR) |
127 (100 – 143.5) |
125.5 (112.5 – 150) b |
151.5 (123 – 180) b |
10.295≠ |
0.006 |
HS |
0.313 |
0.003 |
0.007 |
|
|
Range |
59 – 180 |
71 – 180 |
110 – 190 |
||||||||
|
After |
Median (IQR) |
117.5 (99.5 – 151) |
115.5 (100 – 130) c |
111.5 (98 – 132) c |
0.673≠ |
0.714 |
NS |
– |
– |
– |
|
|
Range |
65 – 204 |
69 – 198 |
58 – 224 |
||||||||
|
Test value / P-value |
0.409 / 0.623 |
10.881 / 0.000 |
11.406 / 0.000 |
||||||||
|
Creatinine |
|||||||||||
|
Before |
Median (IQR) |
7.55 (6 – 9.75) |
7.6 (6.45 – 9.45) |
6.75 (6 – 9.5) |
0.961≠ |
0.619 |
NS |
– |
– |
– |
|
|
Range |
4.6 – 15.9 |
2.3 – 13.6 |
2.6 – 11.7 |
||||||||
|
During |
Median (IQR) |
7 (6.15 – 9) |
7 (6.2 – 8.25) |
6.9 (6.3 – 8.3) |
0.015≠ |
0.993 |
NS |
– |
– |
– |
|
|
Range |
3.4 – 17 |
2.9 – 14.2 |
4.6 – 13 |
||||||||
|
After |
Median (IQR) |
7.8 (6.85 – 9.9) |
7.6 (6.2 – 8.75) |
7.4 (6.2 – 7.9) |
1.421≠ |
0.491 |
NS |
– |
– |
– |
|
|
Range |
4.2 – 14.7 |
2.3 – 12.4 |
4 – 11.7 |
||||||||
|
Test value / P-value |
1.852 / 0.173 |
1.951 / 0.152 |
0.142 /0.811 |
||||||||
|
UA |
|||||||||||
|
Before |
Mean ± SD |
6.51 ± 1.60a,c |
6.69 ± 1.57a |
5.90 ± 1.23 |
2.177• |
0.118 |
NS |
– |
– |
– |
|
|
Range |
4.2 – 9.7 |
1.9 – 9.4 |
3.9 – 9.2 |
||||||||
|
During |
Mean ± SD |
7.21 ± 1.26b |
7.06 ± 1.15a |
6.30 ± 1.04 |
4.540• |
0.013 |
S |
0.559 |
0.005 |
0.010 |
|
|
Range |
4.4 – 10.9 |
3.8 – 8.9 |
2.8 – 7.4 |
||||||||
|
After |
Mean ± SD |
6.16 ± 1.63c |
6.18 ± 1.14b |
6.06 ± 1.63 |
0.063• |
0.939 |
NS |
– |
– |
– |
|
|
Range |
3.6 – 10.1 |
3.8 – 8.6 |
2.6 – 10.4 |
||||||||
|
Test value / P-value |
5.498 / 0.006 |
7.172 / 0.002 |
0.900 /0.404 |
||||||||
|
S. Na (mmol/L) |
|||||||||||
|
Before |
Mean ± SD |
138.50 ± 3.33a,c |
138.30 ± 3.44 |
139.05 ± 3.02a |
0.402• |
0.670 |
NS |
– |
– |
– |
|
|
Range |
131 – 145 |
132 – 146 |
134 – 146 |
||||||||
|
During |
Mean ± SD |
140.19 ± 4.76b |
139.28 ± 4.51 |
140.23 ± 5.31a,b |
0.536• |
0.586 |
NS |
– |
– |
– |
|
|
Range |
129 – 150 |
130 – 154 |
127 – 148 |
||||||||
|
After |
Mean ± SD |
136.91 ± 3.95c |
139.27 ± 5.37 |
141.82 ± 3.47b |
7.239• |
0.001 |
HS |
0.023 |
0.000 |
0.031 |
|
|
Range |
128 – 149 |
129 – 162 |
136 – 147 |
||||||||
|
Test value / P-value |
5.668 / 0.007 |
0.953 / 0.382 |
3.408 / 0.044 |
||||||||
|
K (mmol/L) |
|||||||||||
|
Before |
Mean ± SD |
6.16 ± 0.39a |
6.08 ± 0.32a |
6.23 ± 0.20a |
1.861• |
0.160 |
NS |
– |
– |
– |
|
|
Range |
5.2 – 7.4 |
4.7 – 6.7 |
6 – 6.7 |
||||||||
|
During |
Mean ± SD |
7.08 ± 0.67b |
6.76 ± 0.53b |
8.79 ± 0.76b |
88.391• |
0.000 |
HS |
0.019 |
0.000 |
0.000 |
|
|
Range |
6.2 – 8.4 |
6 – 8.6 |
7.7 – 9.8 |
||||||||
|
After |
Mean ± SD |
7.21 ± 0.84b |
6.68 ± 0.76b |
6.46 ± 0.56b |
7.781• |
0.001 |
HS |
0.002 |
0.000 |
0.261 |
|
|
Range |
5.7 – 9.1 |
4.8 – 8.8 |
5.4 – 8 |
||||||||
|
Test value / P-value |
26.213 / 0.000 |
29.116 / 0.000 |
144.812 / 0.000 |
||||||||
|
Ca (mg/dl) |
|||||||||||
|
Before |
Mean ± SD |
8.70 ± 0.72a |
8.61 ± 0.73a |
8.90 ± 0.68a |
1.352• |
0.263 |
NS |
– |
– |
– |
|
|
Range |
6.3 – 9.8 |
6.8 – 10.3 |
7.3 – 10 |
||||||||
|
During |
Mean ± SD |
8.21 ± 0.75b |
8.13 ± 0.89b |
8.32 ± 0.87b |
0.431• |
0.651 |
NS |
– |
– |
– |
|
|
Range |
6.3 – 9.8 |
6.3 – 9.8 |
7 – 10.9 |
||||||||
|
After |
Mean ± SD |
8.65 ± 1.06b |
8.41 ± 0.89b |
8.44 ± 0.73b |
0.745• |
0.477 |
NS |
– |
– |
– |
|
|
Range |
6.3 – 10.8 |
6.3 – 10.8 |
7 – 10.4 |
||||||||
|
Test value / P-value |
6.449 / 0.005 |
8.548 / 0.001 |
6.084 / 0.006 |
||||||||
|
PO4 (mg/dl) |
|||||||||||
|
Before |
Mean ± SD |
5.00 ± 1.12a |
5.02 ± 1.30a,b |
4.45 ± 1.36 |
1.739• |
0.181 |
NS |
– |
– |
– |
|
|
Range |
3.2 – 7.2 |
2.2 – 9.3 |
2.4 – 7.1 |
||||||||
|
During |
Mean ± SD |
6.65 ± 0.73b |
5.28 ± 1.48a |
4.64 ± 1.23 |
19.400• |
0.000 |
HS |
0.000 |
0.000 |
0.042 |
|
|
Range |
5 – 8.2 |
2.2 – 9.8 |
2.7 – 7 |
||||||||
|
After |
Mean ± SD |
4.33 ± 1.13c |
4.76 ± 1.36b |
4.27 ± 1.04 |
1.929• |
0.150 |
NS |
– |
– |
– |
|
|
Range |
2.2 – 6.4 |
2 – 7.9 |
2.8 – 6.1 |
||||||||
|
Test value / P-value |
40.622 / 0.000 |
3.190 / 0.045 |
0.897 /0.415 |
||||||||
|
Alb (g/dl) |
|||||||||||
|
Before |
Mean ± SD |
3.94 ± 0.31 |
3.95 ± 0.47a |
3.95 ± 0.38a,b |
0.008• |
0.992 |
NS |
– |
– |
– |
|
|
Range |
3.2 – 4.4 |
2.7 – 4.6 |
3.3 – 4.7 |
||||||||
|
During |
Mean ± SD |
3.92 ± 0.34 |
3.80 ± 0.56b |
3.82 ± 0.46a |
0.662• |
0.518 |
NS |
– |
– |
– |
|
|
Range |
3.1 – 4.5 |
1.8 – 4.9 |
2.6 – 4.5 |
||||||||
|
After |
Mean ± SD |
3.92 ± 0.42 |
4.11 ± 0.38c |
4.09 ± 0.40b |
2.505• |
0.086 |
NS |
– |
– |
– |
|
|
Range |
2.9 – 4.8 |
2.9 – 4.9 |
3 – 4.7 |
||||||||
|
Test value / P-value |
0.058 / 0.938 |
9.813 / 0.000 |
3.642 /0.039 |
||||||||
|
Dry weight |
|||||||||||
|
Before |
Mean ± SD |
78.19 ± 14.04a |
73.77 ± 14.04a |
75.59 ± 16.84a,c |
0.955• |
0.388 |
NS |
– |
– |
– |
|
|
Range |
49 – 103 |
49 – 120 |
50 – 118 |
||||||||
|
During |
Mean ± SD |
79.31 ± 14.23b |
74.86 ± 14.26b |
90.02 ± 15.59b |
8.796• |
0.000 |
HS |
0.164 |
0.009 |
0.000 |
|
|
Range |
49 – 104 |
49 – 122 |
59 – 121 |
||||||||
|
After |
Mean ± SD |
78.59 ± 14.40c |
74.23 ± 14.18c |
75.82 ± 17.36c |
0.894• |
0.412 |
NS |
– |
– |
– |
|
|
Range |
49 – 104 |
48 – 121 |
50 – 119.5 |
||||||||
|
Test value / P-value |
54.897 / 0.000 |
63.100 / 0.000 |
22.287 / 0.000 |
||||||||
P-value > 0.05: Non-significant; P-value < 0.05: Significant; P-value < 0.01: Highly significant
•: One Way ANOVA test; ≠: Kruskal-Wallis test
Different superscript letter indicate significant difference between different follow up times
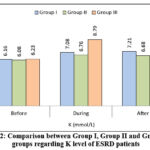 |
Figure 2: Comparison between Group I, Group II and Group III groups regarding K level of ESRD patients
|
Table (8) demonstrates that hemoglobin levels in Group II showed significant within-group fluctuations (p=0.002), with lowest values during Ramadan compared to baseline. Groups I and III maintained stable hemoglobin levels throughout the study.
Regarding WBCs, there were significant differences between-groups at all time points. Group I consistently showed highest WBC counts versus Group II and Group III. All groups maintained stable WBC levels over time (p>0.05 for all).
Regarding platelets level, no significant differences were observed between groups at any time point. However, all groups showed significant within-group declines.
Table 8: Comparison between Group I, Group II and Group III groups regarding CBC of ESRD patients
|
ESRD |
Group I |
Group II |
Group III |
Test value |
P-value |
Sig. |
P1 |
P2 |
P3 |
|
|
No. = 32 |
No. = 60 |
No. = 22 |
||||||||
|
Hb (g/dl) |
||||||||||
|
Before |
Mean ± SD |
10.18 ± 1.40 |
10.37 ± 1.48a |
10.33 ± 1.79 |
0.168• |
0.845 |
NS |
– |
– |
– |
|
Range |
7.5 – 12.7 |
7.5 – 13.9 |
7.7 – 13.8 |
|||||||
|
During |
Mean ± SD |
9.67 ± 1.28 |
9.77 ± 1.76b |
9.73 ± 1.39 |
0.043• |
0.958 |
NS |
– |
– |
– |
|
Range |
7.2 – 12.3 |
5.8 – 14.8 |
7.6 – 12.2 |
|||||||
|
After |
Mean ± SD |
9.99 ± 1.35 |
10.09 ± 1.48a,b |
10.21 ± 1.86 |
0.135• |
0.873 |
NS |
– |
– |
– |
|
Range |
6.8 – 12.8 |
6.3 – 13.7 |
6.9 – 16 |
|||||||
|
Test value / P-value |
3.193 / 0.061 |
6.424 / 0.002 |
2.278 / 0.116 |
|||||||
|
WBCs (10e3/uL) |
||||||||||
|
Before |
Mean ± SD |
8.44 ± 2.02 |
7.18 ± 2.36 |
6.21 ± 1.58 |
7.459• |
0.001 |
HS |
0.008 |
0.000 |
0.072 |
|
Range |
4.8 – 13.9 |
3 – 13.7 |
3.5 – 10.6 |
|||||||
|
During |
Mean ± SD |
8.41 ± 3.22 |
7.31 ± 2.46 |
6.30 ± 1.65 |
4.535• |
0.013 |
S |
0.053 |
0.004 |
0.115 |
|
Range |
4.1 – 22.9 |
3.3 – 12.7 |
3.2 – 10.7 |
|||||||
|
After |
Mean ± SD |
7.93 ± 2.10 |
7.15 ± 2.17 |
6.10 ± 1.59 |
5.194• |
0.007 |
HS |
0.087 |
0.002 |
0.041 |
|
Range |
4.3 – 12 |
3.2 – 12.4 |
3.6 – 10 |
|||||||
|
Test value / P-value |
0.481 / 0.573 |
0.159 / 0.851 |
0.533 / 0.586 |
|||||||
|
PLT (10e3/uL) |
||||||||||
|
Before |
Median (IQR) |
215.5 (188 – 269)a |
200 (159 – 253)a |
189.5 (159 – 245)a |
2.548≠ |
0.280 |
NS |
– |
– |
– |
|
Range |
109 – 345 |
70 – 401 |
127 – 424 |
|||||||
|
During |
Median (IQR) |
201 (161.5 – 218.5)b |
189 (158 – 232)a |
185.5 (152 – 245) a,b |
0.020≠ |
0.990 |
NS |
– |
– |
– |
|
Range |
102 – 315 |
73 – 384 |
116 – 364 |
|||||||
|
After |
Median (IQR) |
174.5 (132 – 194.5)b |
190 (144 – 244.5)b |
177.5 (144 – 223)b |
1.244≠ |
0.537 |
NS |
– |
– |
– |
|
Range |
80 – 352 |
51 – 306 |
95 – 287 |
|||||||
|
Test value / P-value |
8.435 / 0.001 |
5.642 / 0.007 |
4.141 / 0.024 |
|||||||
P-value > 0.05: Non-significant; P-value < 0.05: Significant; P-value < 0.01: Highly significant
•: One Way ANOVA test; ≠: Kruskal-Wallis test
Different superscript letter indicate significant difference between different follow up times
Table (9) shows no significant differences in kidney function parameters between hypertensive and non-hypertensive ESRD patients in Group III at any time point. For blood urea levels, no significant differences were observed before, during, or after Ramadan. However, hypertensive patients showed significant within-group blood urea fluctuations over time (p<0.001), peaking during Ramadan.
Table 9: Relation between presence of hypertension and kidney function tests of Group III in ESRD group at different follow up period
|
Group III (ESRD) |
Hypertension |
Test value |
P-value |
Sig. |
||
|
No |
Yes |
|||||
|
No. = 4 |
No. = 18 |
|||||
|
blood urea |
||||||
|
Before |
Median (IQR) |
115 (103.5 – 128) |
110 (90 – 143)a,c |
-0.128≠ |
0.898 |
NS |
|
Range |
97 – 136 |
82 – 168 |
||||
|
During |
Median (IQR) |
125 (118 – 158.5) |
159 (128 – 180)b |
-0.809≠ |
0.418 |
NS |
|
Range |
113 – 190 |
110 – 190 |
||||
|
After |
Median (IQR) |
119 (101 – 145.5) |
111.5 (97 – 125)c |
-0.681≠ |
0.496 |
NS |
|
Range |
99 – 156 |
58 – 224 |
||||
|
Test value / P-value |
0.793 / 0.490 |
10.772 / 0.000 |
||||
|
Creatinine |
||||||
|
Before |
Median (IQR) |
5.45 (3.8 – 8.3) |
7.2 (6.3 – 9.5) |
-1.321≠ |
0.186 |
NS |
|
Range |
2.6 – 10.7 |
2.7 – 11.7 |
||||
|
During |
Median (IQR) |
6.25 (5.45 – 6.65) |
7.15 (6.5 – 8.9) |
-1.831≠ |
0.067 |
NS |
|
Range |
4.8 – 6.9 |
4.6 – 13 |
||||
|
After |
Median (IQR) |
7.05 (5.85 – 7.85) |
7.4 (6.2 – 8) |
-0.554 |
0.579 |
NS |
|
Range |
5.4 – 7.9 |
4 – 11.7 |
||||
|
Test value / P-value |
0.217 / 0.747 |
0.453 / 0.582 |
||||
|
UA |
||||||
|
Before |
Mean ± SD |
5.88 ± 2.35 |
5.91 ± 0.95 |
-0.052• |
0.959 |
NS |
|
Range |
3.9 – 9.2 |
4.4 – 8.8 |
||||
|
During |
Mean ± SD |
6.45 ± 0.97 |
6.26 ± 1.08 |
0.321• |
0.751 |
NS |
|
Range |
5 – 7.1 |
2.8 – 7.4 |
||||
|
After |
Mean ± SD |
7.03 ± 2.38 |
5.84 ± 1.42 |
1.334• |
0.197 |
NS |
|
Range |
5.3 – 10.4 |
2.6 – 8.7 |
||||
|
Test value / P-value |
0.702 / 0.495 |
1.191 /0.311 |
||||
P-value > 0.05: Non-significant; P-value < 0.05: Significant; P-value < 0.01: Highly significant
•: Independent t-test; ≠: Mann-Whitney test
Different superscript letter indicate significant difference between different follow up times
Table 10 shows no significant differences in blood urea levels between diabetic and non-diabetic ESRD patients in group III before, during or after Ramadan. Non-diabetic patients showed significant within-group blood urea fluctuations (p=0.001), peaking during Ramadan, while diabetic patients maintained more stable levels (p=0.115).
Also, non-diabetic patients had significantly higher baseline uric acid levels compared to diabetics. This difference disappeared during and after Ramadan Both groups maintained stable uric acid levels over time.
Table 10: Relation between presence of diabetes mellitus and kidney function tests of Group III in ESRD group at different follow up period.
|
Group III (ESRD) |
DM |
Test value |
P-value |
Sig. |
||
|
No |
Yes |
|||||
|
No. = 14 |
No. = 8 |
|||||
|
Blood urea |
||||||
|
Before |
Median (IQR) |
107.5 (90 – 130)a,c |
130.5 (117.5 – 139.5) |
-1.236≠ |
0.216 |
NS |
|
Range |
82 – 168 |
110 – 143 |
||||
|
During |
Median (IQR) |
152.5 (120 – 180)b |
151 (135.5 – 174) |
-0.383≠ |
0.701 |
NS |
|
Range |
110 – 190 |
127 – 190 |
||||
|
After |
Median (IQR) |
111.5 (98 – 132)c |
107.5 (78.5 – 125.5) |
-0.596≠ |
0.551 |
NS |
|
Range |
78 – 224 |
58 – 135 |
||||
|
Test value / P-value |
9.289 / 0.001 |
3.810 / 0.115 |
||||
|
Creatinine |
||||||
|
Before |
Median (IQR) |
6.7 (6 – 8.6) |
8.75 (5.15 – 10.25) |
-0.639≠ |
0.523 |
NS |
|
Range |
2.7 – 11.7 |
2.6 – 10.7 |
||||
|
During |
Median (IQR) |
6.96.3 – 8.9) |
6.7 (5.6 – 7.4) |
-0.681≠ |
0.496 |
NS |
|
Range |
4.6 – 13 |
4.8 – 7.8 |
||||
|
After |
Median (IQR) |
6.95 (6.2 – 8) |
7.85 (5.9 – 7.9) |
-0.043≠ |
0.966 |
NS |
|
Range |
4.4 – 11.7 |
4 – 7.9 |
||||
|
Test value / P-value |
0.951 / 0.369 |
0.294 / 0.692 |
||||
|
UA |
||||||
|
Before |
Mean ± SD |
6.20 ± 1.14 |
4.58 ± 0.62 |
2.720• |
0.013 |
S |
|
Range |
5 – 9.2 |
3.9 – 5.4 |
||||
|
During |
Mean ± SD |
6.30 ± 1.11 |
6.27 ± 0.74 |
0.042• |
0.967 |
NS |
|
Range |
2.8 – 7.4 |
5.3 – 6.9 |
||||
|
After |
Mean ± SD |
6.23 ± 1.57 |
5.30 ± 1.91 |
1.031• |
0.315 |
NS |
|
Range |
4.1 – 10.4 |
2.6 – 7 |
||||
|
Test value / P-value |
0.056 / 0.905 |
2.735 / 0.167 |
||||
P-value > 0.05: Non-significant; P-value < 0.05: Significant; P-value < 0.01: Highly significant
•: Independent t-test; ≠: Mann-Whitney test
Different superscript letter indicate significant difference between different follow up times.
Discussion
Regarding CKD patients, this study demonstrated that there was no statistically significant difference between studied groups as regard age and sex.
Similarly, our findings were in line with Dogan et al.9 who investigated the effects of Ramadan fasting on renal functions in patients with CKD. They revealed that there was no statistically significant difference between fasting and non-fasting patients according to age and gender.
Our study found that there were no statistically significant differences in blood urea levels between Group I (non-ramadan fasting) and Group II (Ramadan fasting) before Ramadan or after Ramadan However, during Ramadan, Group II showed significantly higher blood urea levels compared to Group I. The rise in blood urea may be attributed to multiple factors, including reduced daytime fluid intake causing dehydration and increased protein consumption during iftar meals.
These findings align with those of Hassan et al. 10 who reported a significant increase in serum urea during the last week of Ramadan, which returned to baseline levels after Ramadan ended.
Also, the creatinine level did not change over time in group I (p = 0.107) while it was significantly increased in group II during Ramadan and after Ramadan than at baseline with p-value <0.001. Also, Malik and his colleagues 6 demonstrated that median creatinine before Ramadan was 1.69 mg/dl, and the median after Ramadan was 1.86 mg/dl (p <0.001). There was a statistically significant difference between the fasting groups before and after Ramadan with respect to creatinine levels. The impact of independent variable of fasting, using linear regression was found to be statistically significant (p post-<0.001). The eGFR was 14.826 points higher in those who fasted after Ramadan than in those who did not. However, Bernieh et al. 11 studied 31 CKD patients during Ramadan and reported no significant changes in serum creatinine or urea, suggesting that fasting was well tolerated in patients with stable disease.
Regarding eGFR, Also, no statistically significant differences between group I and group II regarding eGFR levels at any time point.
El-Wakil et al. 12 reported that after the month of Ramadan, the changes in the baseline values of eGFR between the fasting and non-fasting groups were not significantly different. These findings suggest that eGFR did not change significantly in the patients with CKD yet fasting during Ramadan may damage the kidney tubular cells of these patients.
Regarding uric acid level, there was no statistically significant difference between both groups before, during and after Ramadan and also no statistically significant change in the level of uric acid in both groups during the follow up period. However, Karatas et al.13 revealed that fasting had a positive effect on UA levels. Our study demonstrated that serum sodium levels were significantly higher in group I compared to group II before Ramadan, during Ramadan and after Ramadan. Within-group analysis there were no significant changes in sodium levels over time in both groups. This finding may be related to decreased fluid intake, use of diuretics, and potential subclinical dehydration. Similar observations were noted by Bernieh et al. 11 and El-Wakil et al.12, who reported mild reductions in sodium during fasting. However, Ansari et al. 14 found no significant change in serum sodium, suggesting that serum sodium balance may depend on individual hydration practices and medication use.
Our results showed a significant increase in serum potassium among patients who fasted during Ramadan. It is noteworthy that many commonly consumed foods and beverages during Ramadan are rich in potassium, including dates, bananas, dried apricots, watermelon, and cantaloupe, as well as natural fruit juices such as orange juice, mango juice, and mixed fruit juice. These may contribute to elevated serum potassium levels, particularly in the absence of proper dietary guidance. This agrees with findings by Hassan et al. 10, who reported mild hyperkalemia in fasting patients, especially those consuming potassium-rich foods or taking Renin angiotensin aldosterone system (RAAS) inhibitors. This emphasizes the importance of dietary counseling for potassium control.
The observed hyperkalemia may be explained by several physiological mechanisms during fasting, including relative insulinopenia and diminished catecholamine response, which impair cellular potassium uptake.15
Also, regarding calcium level during Ramadan, group I showed significantly higher calcium levels compared to group II. Both groups maintained stable calcium levels over time, with no significant change within-group. This finding is supported by Kara et al.16 and Bakhit et al.17, who both reported decreased calcium during fasting in CKD patients.
Additionally, we found that during Ramadan, group II showed significantly higher phosphate levels than group I. Also, after Ramadan, group II maintaining higher levels versus group I. While Group I exhibited no significant within-group changes over time (p = 0.142), group II showed highly significant increase (p < 0.001). This finding is consistent with Hassan et al. 10 who reported mild hyperphosphatemia in fasting CKD patients. Increased intake of phosphorus-rich foods during Ramadan (e.g., meat, dairy, processed foods) and inconsistent use of phosphate binders may explain this trend In contrast to our findings.
Also, before Ramadan, group I had significantly lower albumin levels compared to group II while no significant difference during and after Ramadan. Group I exhibited a significant within-group increase over time. This suggests that, under proper dietary and fluid intake guidance, Ramadan fasting may not have a detrimental effect on nutritional status, These findings are in agreement with Yousef et al. 18 who noted an improvement in inflammatory markers, which may reflect a favorable metabolic response to fasting under proper supervision who both reported no significant changes in serum albumin levels during Ramadan.
Our results suggest that Ramadan fasting may have a modest, non-harmful impact on hematological markers in CKD patients, particularly reflecting improved inflammatory profiles under proper monitoring. White blood cell (WBC) counts were consistently lower in the group II before, during, and after Ramadan compared to group I this may indicate reduced systemic inflammation or fewer exposure-related infections during fasting. Similar findings were reported by Yousef et al. 18, who documented reductions in chronic inflammatory markers among fasting CKD patients. Also, group I had significantly higher platelet counts compared to group II before Ramadan and after Ramadan, with no significant difference during Ramadan.
Within-group analysis revealed statistically significant changes in platelet levels over time in both groups. This dynamic pattern was statistically significant and may reflect transient hematologic changes due to fluid balance or dietary variations. Yassin et al. 19 also observed fluctuations in platelet related inflammatory markers in fasting patients, suggesting a possible anti-inflammatory effect of fasting.
Among hypertensive CKD patients, our study noted improvements in serum creatinine levels after Ramadan, along with a significant decrease in urea levels post-Ramadan compared to non-hypertensive patients. Karatas et al. 13 reported better blood pressure control and improved renal function in stable hypertensive patients during Ramadan. However, other studies such as Baloglu et al. 20 found that hypertension a predictive factor for developing AKI in CKD patients who fasted in Ramadan which in turn put a bad impact on CKD progression highlighted that hypertensive CKD patients may still face risks of renal deterioration, particularly if hydration is not adequately maintained.
Our study found that no significant differences in blood urea levels between non-diabetic and diabetic CKD patients However, both groups showed highly significant within-group changes over time. Also, no significant differences in creatinine levels were found between non-diabetic and diabetic CKD patients. While non-diabetic patients maintained stable creatinine levels over time, diabetic patients showed statistically significant changes.
Prospective observational study by Haroon et al. 21 assessed the safety of fasting in diabetic and non-diabetic patients with stable CKD during Ramadan and did not observe worsening of kidney disease in both diabetic and non-diabetic group rather seen statistically significant improvement in pre and post Ramadan values of systolic and diastolic blood pressure, serum creatinine and uric acid levels were found in both diabetic and non-diabetic group (P value <0.0001) which may be due to strict dietary compliance.
In patients with ESRD undergoing hemodialysis, our study found that no significant differences in demographic variables such as age, sex across the fasting, partially fasting, and non-fasting groups. This allowed for reliable comparisons between these subgroups. Similarly, our findings were in line with Khazneh et al. 22 found that no significant differences between three group as regard age and sex.
Blood urea levels were significantly higher in fully fasting ESRD patients compared to partial or non-fasting groups, while Khazneh et al. 22, found that no clinically significant differences between Ramadan fasting groups in creatinine, blood urea nitrogen, However, other studies such as Adanan et al. 23 observed a reduction in urea levels.
No significant difference was found in creatinine levels at any time point Which may reflect protective effects of regular dialysis. These results are partially consistent with Al Wakeel 3 who found no clinically significant differences between Ramadan fasting groups in creatinine levels, while Adanan et al. 23 reported that significant reduction in serum creatinine levels during Ramadan.
Serum sodium levels remained stable during Ramadan across all groups, but increased significantly post-Ramadan in the full fasting group. Similar findings were reported by Alshamsi et al. 24 who found no clinically significant differences between Ramadan fasting groups in serum sodium level.
Regarding potassium level, significant difference were observed during and after Ramadan. Group III showed remarkably elevated potassium during Ramadan versus group I and group II. These elevations are consistent with Al Wakeel 3 who revealed that hyperkalemia developed in 25.0% and 15.6% of the hemodialsysis patients during and after the fasting period and hyponatremia in 15.6% and 28.0%, respectively.
While regarding calcium level, all groups showed significant within-group fluctuations with lowest values during Ramadan period. This transient drop is in line with Chowdhury et al. 25, who observed a similar pattern in fasting dialysis patients.
Phosphorus levels decreased in the fasting group during Ramadan but remained highest in non-fasting patients. These changes may reflect alterations in dietary phosphate intake, binder adherence, and dialysis timing. Alshamsi et al. 24 demonstrated that in the context of hemodialysis cases, serum phosphorous was significantly higher in the fasting group during Ramadan that may be due to the type of food consumed in Ramadan or the reluctance of the patients taking the prescribed large calcium carbonate tablets during their breaking the fast meals.
Regarding albumin level, group II and III showed significant within-group increase post-Ramadan .These results are consistent with Imtiaz et al. 26 who found increased albumin levels due to maintained protein intake in both fasting and non fasting groups in a cohort of 32 hemodialysis patients who fasted during the month of Ramadan.
Regarding Dry weight, highly significant difference between groups occurred during Ramadan (p<0.001), with Group III showing highest values versus Group II All groups demonstrated significant within-group fluctuations (p<0.001 for all).
As reported by Khazneh et al. 22 who found that Ramadan fasting group and Partial Ramadan fasting group had slightly higher mean interdialytic weight gain by 0.6 kg and 0.4 kg than Ramadan non fasting group, respectively.
In ESRD patients hemoglobin levels declined significantly in both fasting groups during Ramadan, with partial recovery afterward. as reported by Adanan et al. 23 who found that no clinically significant differences between Ramadan fasting groups in hemoglobin levels.
Our study found that no significant differences in kidney function parameters (blood urea, creatinine and uric acid) between hypertensive and non-hypertensive ESRD patients in Group III at any time point.
Our study found that no significant differences in creatinine levels between diabetic and non-diabetic ESRD patients in Ramadan fasting group. Both groups maintained stable creatinine levels throughout the study period. Khazneh et al. 22 demonstrated that Mean serum creatinine was lower in diabetic patients than non-diabetic patients by 0.52 md/dl (95% CI -0.97, -0.07; p 0.023).
Practical Considerations and Risk Stratification: For diabetic CKD patients considering fasting, tools such as the DAR (Diabetes and Ramadan) risk calculator can help identify high-risk individuals who should avoid fasting. while those at low or moderate risk may fast under medical supervision.
Environmental factors such as hot climate, long fasting hours, and social customs promoting large, rich meals at Iftar also significantly influence fluid and electrolyte balance. Individualized patient education focusing on balanced fluid intake, controlled potassium and phosphate consumption, and appropriate medication timing is crucial.
Strengths and Limitations: This study’s strengths include its prospective design, well-defined patient groups, and repeated measurements. However, limitations include a relatively small sample size for subgroup analyses, single-center recruitment, and lack of detailed dietary records. Future multicenter studies with larger cohorts and dietary monitoring are recommended.
Recommendations
Review the patient’s previous fasting experience and assess clinical stability and conduct a comprehensive medical assessment 1–3 months before Ramadan. Review medication adherence and confirm appropriate dosing schedule is followed and adjust medication timing and switch to long-acting or patch-based formulations if needed.
Conclusion
Our study provides important insights into the impact of Ramadan fasting on patients with CKD and ESRD, including those with comorbid diabetes and hypertension. The findings suggest that Ramadan fasting is generally safe and well-tolerated among stable patients under careful medical supervision. However, transient metabolic shifts in urea, potassium, phosphate, and eGFR underscore the need for individualized pre-Ramadan assessment, tailored dietary and medication plans, and close monitoring throughout the fasting period.
Acknowledgment
The authors would like to express their gratitude to Internal Medicine department, Faculty of Medicine for Girls, Al-Azhar University, for their invaluable assistance and support throughout the research process.
Funding Sources
The author(s) received no financial support for the research, authorship, and/or publication of this article.
Conflict of Interest
The author(s) do not have any conflict of interest.
Data Availability Statement
This statement does not apply to this article.
Ethics Statement
The research has been permitted by the Ethical Committee of Al-Azhar Faculty of Medicine for Girls. Written informed consent has been obtained from all participants before inclusion.
Informed Consent Statement
This study did not involve human participants, and therefore, informed consent was not required.
Clinical Trial Registration
This research does not involve any clinical trials
Permission to reproduce material from other sources
Not Applicable
Author Contributions
- Hala Sabry Alsaedy Contributed to study design, oversaw clinical assessments, provided medical supervision for participants, and drafted and reviewed the manuscript;
- Ragaa Ramadan Mohamed: Assisted in patient recruitment, coordinated clinical follow-ups, and contributed to data collection and manuscript editing.
- Mai Elsaied Abdelal: Conceptualized the study, designed the methodology, supervised data collection, performed data analysis, and drafted the manuscript;
- Al-Shaymaa Abd El-Badie Abd Elaim: Conducted laboratory analyses, ensured quality control of biochemical data, and contributed to data interpretation and manuscript revision;
- Eman Refaat Youness: contributed to data interpretation and manuscript revision;
- Ahmed El-Sisi: Assisted in patient recruitment, coordinated clinical follow-ups, and contributed to data collection and manuscript editing.
References
- Aklilu AM. Diagnosis of Chronic Kidney Disease and Assessing Glomerular Filtration Rate. Med Clin North Am. 2023;107(4):641-658.
CrossRef - Ahmadmehrabi S, Tang WHW. Hemodialysis-induced cardiovascular disease. Semin Dial. 2018;31(3):258-267.
CrossRef - Al Wakeel JS. Kidney function and metabolic profile of chronic kidney disease and hemodialysis patients during Ramadan fasting. Iran J Kidney Dis. 2014;8(4):321-328.
- Megahed AF, El-Kannishy G, Sayed-Ahmed N. Status of fasting in Ramadan of chronic hemodialysis patients all over Egypt: A multicenter observational study. Saudi J Kidney Dis Transpl. 2019;30(2):339-349.
CrossRef - Boobes Y, Afandi B, AlKindi F, Tarakji A, Al Ghamdi SM, Alrukhaimi M, Hassanein M, AlSahow A, Said R, Alsaid J, Alsuwaida AO. Consensus recommendations on fasting during Ramadan for patients with kidney disease: review of available evidence and a call for action (RaK Initiative). BMC nephrology. 2024 Mar 6;25(1):84.
CrossRef - Malik S, Bhanji A, Abuleiss H, Hamer R, Shah SH, Rashad R, Junglee N, Waqar S, Ghouri N. Effects of fasting on patients with chronic kidney disease during Ramadan and practical guidance for healthcare professionals. Clinical Kidney Journal. 2021 Jun 1;14(6):1524-34.
CrossRef - Boobes Y, Bernieh B, Al Hakim MR. Fasting Ramadan in kidney transplant patients is safe. Saudi J Kidney Dis Transpl. 2009;20(2):198-200.
- Emara MH, Soliman HH, Elnadry M, et al. Ramadan fasting and liver diseases: A review with practice advices and recommendations. Liver Int. 2021;41(3):436-448.
CrossRef - Dogan I, Eser B, Kayadibi H. The effect of Ramadan fasting on renal functions in patients with chronic kidney disease. Turkish Journal of Biochemistry. 2019 Apr 24;44(2):189-96.
CrossRef - Hassan S, Hassan F, Abbas N, et al. Does Ramadan Fasting Affect Hydration Status and Kidney Function in CKD Patients?. Ann Nutr Metab. 2018;72(3):241-247.
CrossRef - Bernieh B, Al Hakim MR, Boobes Y, Abu Zidan FM. Fasting Ramadan in chronic kidney disease patients: clinical and biochemical effects. Saudi J Kidney Dis Transpl. 2010;21(5):898-902.
- El-Wakil HS, Desoky I, Lotfy N, Adam AG. Fasting the month of Ramadan by Muslims: could it be injurious to their kidneys?. Saudi J Kidney Dis Transpl. 2007;18(3):349-354.
- Karatas A, Canakci E, Arici YK, Kaya M, Sayim B. The effect of Fasting during Ramadan on the Kidney functions of Stage III-IV Chronic Kidney Disease Patients. Pak J Med Sci. 2021;37(4):972-978.
CrossRef - Ansari FA, Latief M, Manuel S, et al. Impact of Fasting during Ramadan on Renal Functions in Patients with Chronic Kidney Disease. Indian J Nephrol. 2022;32(3):262-265.
CrossRef - Coregliano-Ring L, Goia-Nishide K, Rangel EB. Hypokalemia in diabetes mellitus setting. Medicina. 2022 16;58(3):431.
CrossRef - Kara E, Sahin OZ, Kizilkaya B, et al. Fasting in Ramadan is not associated with deterioration of chronic kidney disease: A prospective observational study. Saudi J Kidney Dis Transpl. 2017;28(1):68-75.
CrossRef - Bakhit AA, Kurdi AM, Wadera JJ, Alsuwaida AO. Effects of Ramadan fasting on moderate to severe chronic kidney disease. A prospective observational study. Saudi Med J. 2017;38(1):48-52.
CrossRef - Yousef EA, Atwa MA, Mahmoud MA. Effect of Ramadan Fasting on Chronic Inflammation and Body Composition in Patients with Chronic Kidney Disease. Saudi J Kidney Dis Transpl. 2021;32(4):1013-1018.
CrossRef - Yassin, M. A., AlRasheed, M., Al-Eisa, T., et al. (2025). A multicenter mixed-methods study on the effects of intermittent fasting in patients with immune thrombocytopenia receiving thrombopoietin receptor agonists. Frontiers in Nutrition, 12, 1434484.
CrossRef - Baloglu, I., Turkmen, K., Kocyigit, I., et al. (2020). The effect of Ramadan fasting on kidney function in patients with chronic kidney disease. International Urology and Nephrology, 52(7), 1337–1343.
CrossRef - Haroon A, Riaz M, Rabbani B, Saeed A. Safety of fasting in diabetic and non-diabetic patients with stable chronic kidney disease during Ramadan. Pak J Med Sci. 2024;40(4):563-567.
CrossRef - Khazneh E, Qaddumi J, Hamdan Z, et al. The effects of Ramadan fasting on clinical and biochemical markers among hemodialysis patients: A prospective cohort study. PLoS One. 2019;14(6):e0218745.
CrossRef - Adanan NIH, Md Ali MS, Lim JH, et al. Investigating Physical and Nutritional Changes During Prolonged Intermittent Fasting in Hemodialysis Patients: A Prospective Cohort Study. J Ren Nutr. 2020;30(2):e15-e26.
CrossRef - Alshamsi S, Binsaleh F, Hejaili F, et al. Changes in biochemical, hemodynamic, and dialysis adherence parameters in hemodialysis patients during Ramadan. Hemodial Int. 2016;20(2):270-276.
CrossRef - Chowdhury A, Khan H, Lasker SS, Chowdhury TA. Fasting outcomes in people with diabetes and chronic kidney disease in East London during Ramadan 2018: The East London diabetes in Ramadan survey. Diabetes Res Clin Pract. 2019;152:166-170.
CrossRef - Imtiaz S, Nasir K, Dhrolia MF, Hussain M, Abbas HN, Ahmad A. Mortality trend among hemodialysis patients during the islamic month of Ramadan: a 24 years retrospective study. J Coll Physicians Surg Pak. 2015;25(3):189-192.

