
Manuscript accepted on :30-12-2025
Published online on: 18-02-2026
Plagiarism Check: Yes
Reviewed by: Dr. Rasika Karkare
Second Review by: Dr. Indira Priyadarsini
Final Approval by: Dr. Patorn Piromchai
Pooja Dwivedi1,2 , Sagar Barage2*, Ashish Kumar Jha3, Archi Agrawal1,3and Venkatesh Rangarajan1,3
1Department of Nuclear Medicine and Molecular Imaging, Advanced Centre for Treatment Research and Education in Cancer, Tata Memorial Centre, Homi Bhabha National Institute, Mumbai, India,
2Amity Institute of Biotechnology, Amity University Maharashtra, Mumbai-Pune Expressway, Bhatan, Panvel-410206, India
3Department of Nuclear Medicine and Molecular Imaging, Tata Memorial Hospital, Tata Memorial Centre, Homi Bhabha National Institute, Mumbai, India
Corresponding Author E-mail:shbarage@mum.amity.edu
DOI : https://dx.doi.org/10.13005/bpj/3380
Abstract
Independent validation is critical in radiomic research to mitigate bias and enhance clinical translatability. This study presents the development and external validation of a PET (Positron Emission Tomography) radiomics-based machine learning (ML) model for the non-invasive classification of non-small cell lung cancer (NSCLC) histological subtypes, adenocarcinoma and squamous cell carcinoma, and evaluates its clinical utility. Adhering to the CLEAR radiomics reporting guidelines, two retrospective PET datasets from different institutions were employed: one for model training and the other for external validation. Tumor segmentation was performed using a 40% SUVmax threshold, followed by radiomic feature extraction using IBSI-compliant software and ComBat harmonization. To address class imbalance, appropriate resampling techniques were applied, and recursive feature elimination identified the top five predictive features. Three ML models were trained and evaluated on unseen external data. Model performance was compared using Delong’s test, and clinical utility was assessed via decision and clinical impact curve analyses. The XGB model demonstrated superior performance with an accuracy of 80% and an AUC of 0.82 [95% CI: 0.73–0.91], along with favourable calibration (Brier score: 0.12). Decision curve analysis confirmed its net clinical benefit. These findings underscore the clinical relevance of PET radiomics combined with advanced ML techniques, offering a robust, non-invasive tool for histological subtype classification in NSCLC. The externally validated model demonstrates strong potential for integration into translational oncological workflows, aiding personalized treatment planning and improving diagnostic precision in real-world settings.
Keywords
External Validation; Histological Subtypes; Lung Cancer; Machine Learning; PET Radiomics
Download this article as:| Copy the following to cite this article: Dwivedi P, Barage S, Jha A. K, Agrawal A, Rangarajan V. External Validation of PET Radiomics-Based ML Model for Non-Invasive Lung Cancer Subtype Classification. Biomed Pharmacol J 2026;19(1). |
| Copy the following to cite this URL: Dwivedi P, Barage S, Jha A. K, Agrawal A, Rangarajan V. External Validation of PET Radiomics-Based ML Model for Non-Invasive Lung Cancer Subtype Classification. Biomed Pharmacol J 2026;19(1). Available from: https://bit.ly/4amtcMa |
Introduction
Lung cancer remains the leading cause of cancer-related death in this report, accounting for approximately 18.7% of all cancer deaths worldwide.1 Lung cancer is a highly heterogeneous malignant epithelial tumor characterized by distinct pathological and clinical features.2 It is conventionally categorized into two major types: small-cell lung cancer (SCLC) and non-small-cell lung cancer (NSCLC). NSCLC constitutes approximately 85% of all cases and encompasses distinct subtypes, including lung adenocarcinoma (LUAD), lung squamous cell carcinoma (LUSC), and large cell carcinoma, each with unique pathological and molecular characteristics.3 Accurate staging and histopathological grading are fundamental to determining optimal therapeutic approaches in lung cancer management.4 Non-small cell lung carcinoma (NSCLC), particularly when poorly differentiated, often necessitates further characterization through immunohistochemistry and molecular profiling.5 For peripheral pulmonary lesions, CT-guided transthoracic needle aspiration remains the preferred initial diagnostic modality, with the adequacy of the obtained tissue sample being critical for both diagnostic precision and subsequent treatment planning.6 However, in cases involving small or peripherally located tumors, conventional needle biopsy techniques frequently yield insufficient tissue and demonstrate limited diagnostic accuracy.7 Moreover, CT-guided biopsy may be contraindicated or technically unfeasible in certain clinical scenarios, especially when lesions are deeply situated or in proximity to vital structures such as airways or major vessels.8,9 In patients with compromised clinical status or unfavorable anatomical conditions, biopsy procedures may be inadvisable.10 Therefore, developing an accurate and objective noninvasive method is crucial as a complementary approach.
Hybrid imaging modalities integrating ¹⁸F-fluorodeoxyglucose (FDG) positron emission tomography (PET) with computed tomography (CT) and magnetic resonance imaging (MRI) have emerged as pivotal tools in the non-invasive evaluation of lung cancer. These techniques facilitate comprehensive anatomical and metabolic characterization, thereby enhancing diagnostic accuracy and informing clinical decision-making.11–14 These methods typically assess tumor size or metabolic uptake as surrogates for disease status. However, such measurements may not fully capture the complexity and heterogeneity of tumor biology.
Radiomics extends beyond these conventional parameters by extracting a vast array of quantitative features from medical images.15 Recent advancements have facilitated the development of high-throughput processes for extracting quantitative features from medical images, turning them into analyzable datasets.16 This process, known as Radiomics, represents a rapidly growing area of medical research and suggests that medical images contain far more information than what is perceptible through visual inspection.17 This realization has given rise to the expansion in the area of radiomics, which involves the extraction as well as assessment of high-dimensional quantitative features from standard medical images using computational techniques.17,18 Additionally, analyzing a vast array of quantitative imaging features can help predict or uncover hidden genetic and molecular traits, providing valuable decision support.19,20
Previous investigations employing PET-based radiomic analysis have yielded promising results, especially in the context of differentiating lung cancer subtypes and enhancing diagnostic precision.21–29 Although prior studies have provided valuable insights, many were limited to single-center environments, which may constrain the generalizability of their findings.30 The clinical value of any radiomic studies is considered to be limited if they lack external validation and multicentre studies. Given its importance in evaluating generalizability, external validation serves as a critical step in assessing the performance of predictive models on independent datasets that were not involved in model development. This process ensures robustness, mitigates overfitting, and enhances confidence in the model’s applicability across diverse clinical settings. External validation is not only necessary to remove bias but also to provide a more realistic approach to clinical applicability. Moreover, the clinical relevance of the models through decision curve analysis and clinical impact curves is an important but often overlooked aspect in radiomics literature.30
The present study aims to address this gap by developing and externally validating PET-radiomics based on hyper-tuned ensemble and classical machine learning models using datasets from different institutions and evaluating their clinical relevance. Additionally, clinically relevant statistics on model applicability for decision support were also analysed. To the best of our understanding, this investigation represents the first externally validated assessment of a machine learning framework for non-small cell lung cancer (NSCLC) subtype classification utilizing PET-based radiomic features, while adhering to the standard guidelines of radiomic study reporting.
Materials and Methods
The research methodology follows CLEAR (CheckList for EvaluAtion of Radiomics research) guidelines.31 The flowchart that outlines the study’s primary methodological processes in the technological pipeline is described in the graphical details (Figure 1).
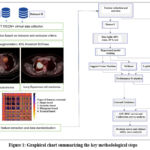 |
Figure 1: Graphical chart summarizing the key methodological steps
|
Data
Retrospective anonymised data from the Cancer Imaging Archive (TCIA),32 a public domain database was used in this investigation. Patients were included if they had histopathologically confirmed NSCLC subtypes and available PET data. PET scans without uptake, those with a lot of noise or artifacts, and those with a tumor volume less than 64 voxels were all excluded (the minimum number of voxels required for texture calculation). Dataset I,33 consisting of 211 patients with 124 LUAD and 32 LUSC patients for training the model and internal validation Dataset II,34 comprised 355 patients from a separate institution, where 124 eligible patients selected from this data consist of 95 LUAD and 29 LUSC patients for external validation. Detailed flowchart for patient selection is presented in Figure 2. Histopathological confirmed subtypes, LUAD, and LUSC of NSCLC served as non-radiomic predictors and reference standards. Comprehensive details on the acquisition and reconstruction protocols of these two datasets are given in Table 1.
Table 1: PET Imaging protocol, image acquisition, and processing
| Dataset | Make | Per bedtime in minute | Method of Reconstruction | Size of Matrix | Thickness of slice | Spacing of pixel | Spacing of slice |
| I | GE | 2-3 | 3D iterative | 128 | 3.27 | 3.91- 5.47 | 3.27 |
| GE | 0.5 | Vue point hd with TOF | 192 | 3.27 | 3.64 | 3.27 | |
| SIEMENS | 1- 3 | OSEM, Point spread function | 168 | 4-5 | 4.07 | 3-5 | |
| PHILIPS | 2-3 | Row action maximum likelihood algorithm | 144 | 4 | 4 | 4 | |
| GE | 1-5 | OSEM, Vue point HD with and without point spread function VPHDS | 128,192 | 3.27-4.25 | 3.64-5.47 | 3.27-4.25 | |
| II | SIEMENS | 0.6-2 | TOF with Point spread function | 200 | 2-3 | 4.07 | 2- 3 |
# TOF is time of flight
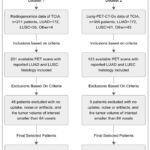 |
Figure 2: Flowchart of patient selection
|
Tumor segmentation
Tumor segmentation was independently performed by two experienced nuclear medicine physicists, with any discrepancies resolved through consensus. Final segmentations were reviewed and confirmed by a certified nuclear medicine physician to ensure clinical accuracy. All PET images were normalized to standardized uptake values (SUVs) based on patient body weight. Lesion delineation was achieved using a semiautomated thresholding approach, applying a 40% SUVmax cutoff derived from a three-dimensional region of interest (ROI). The segmentation process was conducted using LIFEx software (version 7.3.2).35,36
Radiomic Features Extraction
To mitigate the impact of varying voxel sizes PET images were interpolated to an isotropic voxel spacing of 2 mm³. From IBSI-compatible open-source radiomic software LIFEx version 7.3.2, one hundred and eleven IBSI (The Image Biomarker Standardization Initiative) compliant original radiomic features were retrieved.35,36 Twelve morphological, twenty-one intensity-based, twenty-three intensity histogram-based, and fifty-five textural features were among them. Textural features include the following categories;(a) Gray-Level Co-occurrence Matrix (GLCM): provides information on texture patterns including contrast, homogeneity, and correlation by encoding the frequency of voxel pairings with particular intensity combinations at a specified spatial relationship. (b)Gray-Level Run Length Matrix (GLRLM): Represents the consecutive voxels’ length with identical intensity values along a specified direction, capturing higher-order statistical information related to texture granularity and repetition. (c) Gray-Level Size Zone Matrix (GLSZM): Evaluates homogeneous zone size, defined as clusters of connected voxels sharing the same gray level. A large and flat matrix denotes homogeneity, whereas a small matrix implies heterogeneity within the region of concern. (d)Neighboring-Gray Tone Difference Matrix (NGTDM): provides a localized evaluation of texture variation by calculating the difference between the intensity of a voxel and the mean intensity of its neighbors in a specified distance.
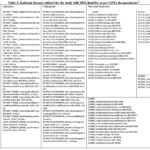 |
Table 2: Radiomic features utilized for the study with IBSI identifier as per LIFEx documentation35
|
Model Pipeline
ComBat harmonization method was utilized to ensure the accuracy and reproducibility of radiomics models in multicenter site settings.37,38 To address class imbalance in the internal dataset utilized for training, the minority class augmentation by Synthetic Minority Over-sampling Technique (SMOTE) was applied to ensure a balanced class distribution before model training in internal dataset. No augmentation was performed on the external dataset. To mitigate multicollinearity, a threshold cut-off of 0.95 was applied to identify very highly correlated features in the training set. The filtered 64 features out of 111 were subsequently applied to Dataset 2 to ensure consistency in feature representation.
For training the model, Dataset 1 was split into training and internal validation sets using an 80:20 split using random sampling. The five important features were chosen using the recursive feature elimination feature selection approach. Three machine learning classifiers were implemented: XGBoost, LR, and SVM. To optimize performance, parameter hyper-tuning of each training model was performed with 5-fold cross-validation.
Performance Metrics & Statistical Analysis
Descriptive statistics for the demographic variables in Dataset 1 and Dataset 2 were summarized using mean and standard deviation. Model evaluation was conducted independently for internal and external validation cohorts. Performance metrics included accuracy, precision, recall, F1 score, average precision, and the precision-recall curve for internal and external validation for each model. The area under the receiver operating characteristic curve (AUC-ROC), reported with corresponding 95% confidence intervals. Comparative analysis of AUC values was performed using DeLong’s test. Additionally, the tuned models were evaluated using RFE-selected features across internal and external validation cohorts. Performance metrics included accuracy, F1 score, and average precision (AP), with a focus on minority class discrimination. Model calibration was assessed through the Brier score, and calibration curves were produced to show how well projected probability and observed results agreed. To determine the clinical relevance of each predictive model, decision curve analysis was employed across a spectrum of threshold probabilities. Each model’s net benefit values were calculated and compared to the default approach of treating every patient versus none at all.
Clinical Impact Curves were constructed to quantify the number of individuals classified as high-risk and the proportion of true positives at varying thresholds, thereby evaluating the potential clinical utility of the models.All machine learning algorithms were implemented using the scikit-learn library (version 1.5.0) in Python 3.11.7. Statistical significance for comparative analyses was defined as a p-value less than 0.05. Matplotlib and Seaborn were used to visualize the data. Feature selector, classification algorithms, performance metrics, etc., were sourced from the scikit-learn framework.
Results
Patient demographic and clinical characteristics
The internal cohort (n = 156) and external cohort (n = 124) were comparable in terms of sex distribution and histological subtype, with adenocarcinoma comprising the majority of cases (78.2%), Table 3. The mean age was slightly higher in the internal cohort (68.76 ± 7.61 years) compared to the external cohort (66.94 ± 10.83 years). Smoking status differed across cohorts, with a higher proportion of smokers in the internal dataset (75%) versus the external dataset (54%). T-stage distribution was available for all external cases but partially missing in the internal cohort (31.4% not collected), which may reflect institutional documentation variability. Overall, the combined dataset (n = 280) provided a diverse and clinically representative sample for multicentre radiomic analysis.
Table 3: Patient Demographic and Clinical Characteristics
| Characteristic | Internal Dataset | External Dataset | All Patients |
| Patient no. | 156 | 124 | 280 |
| Age (years) | 68.76 ± 7.61 | 66.94 ± 10.83 | 65.16 ± 9.35 |
| Sex | |||
| Male | 99 | 73 | 172 |
| Female | 57 | 51 | 108 |
| T stage | |||
| Tis/T1/T2/T3/T4 | 5/49/37/12/3 | 0/69/33/17/5 | 5/118/70/29/8 |
| Not collected | 49 | 0 | 49 |
| Smoking Status | |||
| Smoker | 117 | 67 | 184 |
| Nonsmoker | 39 | 57 | 96 |
| Subtype | |||
| Adenocarcinoma | 124 | 95 | 219 |
| Squamous cell carcinoma | 32 | 29 | 61 |
SMOTE Resampling distribution
To mitigate class imbalance in the internal dataset, comprising 32 cases of squamous cell carcinoma and 124 cases of adenocarcinoma SMOTE applied prior to model training, synthetically generated new instances of the minority class (squamous cell carcinoma), resulting in a balanced distribution of 124 samples per class (Figure 3). This adjustment supports fairer model training and enhances minority class detection.
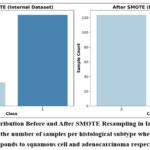 |
Figure 3: Class Distribution Before and After SMOTE Resampling in Internal dataset. Bar chart represents the number of samples per histological subtype where, Class 0 and 1 corresponds to squamous cell and adenocarcinoma respectively.
|
Performance and Discrimination Metrics
Internal Validation
All three models demonstrated strong performance on the internal validation cohort (Table 4). XGBoost achieved near-perfect classification metrics, including an accuracy of 0.98, F1 score of 0.98, AUC-ROC of 0.99, and the lowest Brier score (0.02), indicating both excellent discriminative ability and well-calibrated probability estimates. SVM also performed robustly, yielding an F1 score of 0.90 and AUC-ROC of 0.98, while LR showed consistent performance with an F1 score of 0.87 and AUC-ROC of 0.93. These results suggest that all models effectively captured radiomic patterns within the training domain, with XGBoost offering the most confident predictions.
External Validation
XGBoost retained the highest external accuracy (0.80), recall (0.96), and F1 score (0.85), with an AUC-ROC of 0.82 and Brier score of 0.12, confirming its robustness and reliability in probability estimation (Table 4). SVM maintained balanced generalization (F1 = 0.80, AUC = 0.69), while LR exhibited modest performance (F1 = 0.78, AUC = 0.61) and the highest Brier score (0.23), indicating reduced calibration and increased uncertainty in predicted probabilities.
Table 4: PET-based Radiomic Models Performance Metrics for internal and external validation
| Internal Validation Metrics | |||||||
| Model | Accuracy | Precision | Recall | F1 Score | AUC-ROC | AUC-ROC 95% CI | Brier Score |
| Logistic Regression | 0.88 | 0.95 | 0.80 | 0.87 | 0.93 | [0.85, 0.99] | 0.11 |
| XGBoost | 0.98 | 0.96 | 1.00 | 0.98 | 0.99 | [0.97, 1.00] | 0.02 |
| SVM | 0.96 | 1.00 | 0.92 | 0.90 | 0.98 | [0.95, 1.00] | 0.04 |
| External Validation Metrics | |||||||
| Model | Accuracy | Precision | Recall | F1 Score | AUC-ROC | AUC-ROC CI | Brier Score |
| Logistic Regression | 0.69 | 0.83 | 0.74 | 0.78 | 0.61 | [0.47, 0.75] | 0.23 |
| XGBoost | 0.80 | 0.81 | 0.96 | 0.85 | 0.82 | [0.73, 0.91] | 0.12 |
| SVM | 0.74 | 0.86 | 0.78 | 0.80 | 0.69 | [0.57, 0.81] | 0.22 |
Precision–Recall Curves
Internally, XGBoost achieved highest average precision (AP = 0.99), followed by SVM (AP = 0.98) and LR (AP = 0.94). Externally, AP values declined for all models with observed value for XGBoost was (0.91), followed by SVM (0.89), and lowest recorded in LR (0.80). Panel annotations in Figure 4 correspond to each model and validation type, facilitating visual comparison of precision recall curves.
 |
Figure 4: Multi-panel Precision–Recall (PR) Curves for minority class illustrating model performance for squamous cell carcinoma (minority class) across internal and external validation cohorts. Panels (a–c) depict internal validation results for XGBoost, Support Vector Machine (SVM), and Logistic Regression (LR), respectively.
|
Calibration and Statistical Comparison
AUC-ROC curves (Figure 5) and Calibration curves (Figure 6) further supported the observed trends. XGBoost exhibited the closest alignment between predicted probabilities and observed outcomes, indicating superior calibration. LR demonstrated relatively better calibration than SVM, despite its lower AUC, suggesting that its probability estimates may retain utility even with reduced discriminative power. Statistical comparison using DeLong’s test revealed a significant difference in AUC between XGBoost and SVM (p = 0.04), confirming XGBoost’s superior discriminative performance. Differences between LR and XGBoost (p = 0.32) and LR and SVM (p = 0.35) were not statistically significant, implying that LR’s calibration may offset its lower AUC in certain clinical contexts. These findings highlight XGBoost’s ability to capture complex radiomic signatures and its potential suitability for multicentre deployment in heterogeneous PET imaging environments. SVM offers a balanced alternative with stable generalization, while LR provides consistent calibration despite lower discriminative performance.
 |
Figure 5: AUC-ROC curves of internal and external validation curves for three machine learning models; Logistic Regression, XGBoost, and SVM, under internal (left panel) and external validation (right panel).
|
 |
Figure 6: Calibration curves evaluate the calibration of predicted probabilities against observed outcomes for the ML models with Internal Validation (left panel) and External Validation (right panel).
|
Individual Feature Analysis in External Validation
Feature-level evaluation revealed that GLCM_NormalisedInverseDifference and LocalIntensityPeak were the top-performing features in external validation, achieving AUCs of 0.68 and 0.66, respectively (Figure 7). These features, representing texture and intensity domains, demonstrated relatively strong discriminative power, suggesting that tumor heterogeneity, as captured through spatial and intensity variations, plays a critical role in subtype differentiation. In contrast, features such as GLSZM_ZoneSizeNonUniformity and GLCM_InverseVariance yielded lower AUCs (0.25 and 0.39), indicating limited predictive value in external datasets. This disparity highlights the importance of harmonization-aware feature selection and the need to prioritize biologically relevant and generalizable descriptors in multicenter radiomics workflows. The feature importance analysis confirms that both textural and intensity-based features contribute significantly to classification performance, reinforcing the hypothesis that radiomic heterogeneity metrics are key drivers of histological subtype discrimination.
 |
Figure 7: AUC score of individual features in external validation The top-performing features, representing texture and intensity domains, demonstrated relatively strong discriminative power for lung cancer subtype classification.
|
Decision and Clinical Impact Curves
Decision curve analysis (Figure 8) presented distinct variations in net clinical benefit across models and validation settings. In internal validation, all three models; XGBoost, SVM, and LR, outperformed the “Treat None” strategy across a wide range of threshold probabilities, with XGBoost and SVM demonstrating superior net benefit. The “Treat All” strategy consistently showed negative net benefit, reinforcing the value of model-guided stratification.
In external validation, net benefit declined across all models, reflecting reduced generalizability. However, XGBoost and SVM maintained positive margins over “Treat None,” particularly at threshold probabilities above 10%, indicating their continued clinical utility in guiding treatment decisions.
Clinical impact curves (Figure 9) further contextualized these findings by visualizing the number of individuals classified as high risk and true positives across varying thresholds. In internal validation, XGBoost identified the highest number of true positive cases with fewer high-risk misclassifications, followed by SVM and LR. In external validation, all models showed reduced true positive rates, but XGBoost retained the most favorable balance between sensitivity and specificity.
These curves emphasize the practical implications of model deployment in clinical settings, highlighting the trade-offs between overdiagnosis and missed detection. The superior performance of XGBoost across both decision and impact curves supports its potential integration into non-invasive diagnostic workflows for lung cancer subtype classification.
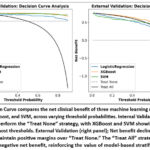 |
Figure 8: Decision Curve compares the net clinical benefit of three machine learning models: Logistic Regression, XGBoost, and SVM, across varying threshold probabilities.
|
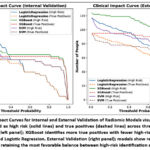 |
Figure 9: Clinical Impact Curves for Internal and External Validation of Radiomic Models visualize the number of individuals classified as high risk (solid lines) and true positives (dashed lines) across threshold probabilities.
|
Discussion
Overview and Methodological Contributions
To our best knowledge, the novelty in the present study lies in its externally validated PET radiomics-based machine learning framework for non-invasive histological subtype classification in NSCLC, with a specific focus on adenocarcinoma and squamous cell carcinoma. Unlike prior studies that often rely on single-center data or lack external validation, the present study approach not only leverages multicenter PET datasets but also adheres to CLEAR radiomics reporting standards, ensuring methodological transparency and reproducibility. Furthermore, the integration of ComBat harmonization, IBSI-compliant feature extraction, and rigorous feature selection enhances generalizability across heterogeneous imaging environments. This comprehensive pipeline addresses key limitations in prior radiomics literature, such as a lack of external validation and standardization, and thereby contributes a clinically relevant, reproducible work with strong translational potential for subtype-specific decision support in oncology. External validation represents a critical benchmark in predictive modeling, especially in radiomics where overfitting to internal datasets is a persistent concern. By demonstrating consistent performance across independent cohorts, the XGBoost model satisfies key criteria for generalizability, a prerequisite for clinical deployment. This distinguishes the present work from prior studies that relied solely on internal cross-validation, which, while useful for model selection, cannot substitute for true external testing.
Relative to existing literature, the present study demonstrates several methodological advancements. Earlier works, such as those by Ha et al.39 and Kim et al.,40 primarily employed univariate statistical analyses without external validation, limiting their reproducibility and clinical relevance. These studies often reported statistically significant associations between individual features and histological subtypes but failed to translate these findings into robust predictive models.
More recent efforts have adopted machine learning approaches, reporting comparable AUCs during internal validation. 21,23,25–28,41 However, these models predominantly utilized Logistic Regression (LR) or Support Vector Machines (SVM), which, while interpretable, may lack the flexibility to capture complex nonlinear relationships inherent in radiomic data. In contrast, XGBoost leverages gradient boosting, constructing an ensemble of decision trees where each tree corrects the residuals of its predecessors. This sequential learning mechanism enables the model to approximate intricate decision boundaries, making it particularly well-suited for high-dimensional, inter-correlated radiomic features.
Moreover, XGBoost incorporates regularization techniques (L1 and L2) that penalize model complexity and reduce overfitting, an essential consideration in radiomics where the number of features often exceeds the number of samples. Since XGBoost is an efficient implementation of extreme gradient boosting algorithms, which builds an ensemble of weak learners sequentially, where each new tree attempts to correct the residual errors made by the previous ones. This advanced model not only demonstrated the ability to model complex nonlinear interactions, robust handling of high-dimensional radiomic features, but also the inbuilt regularization that reduces overfitting. Moreover, when coupled with hyper tuning strategies, it yielded optimal predictive performance and generalized well to external datasets.
Feature Integration and Tumor Heterogeneity
A central finding of this study is the importance of multivariate feature integration in capturing the complex biological heterogeneity of NSCLC tumors. The inclusion of both textural features (e.g., GLCM, GLRLM, NGTDM) and intensity-based features (e.g., SUV metrics, histogram descriptors) enabled the model to characterize tumors across multiple dimensions, spatial complexity, metabolic activity, and voxel-level variation.
Among individual features, GLCM_NormalisedInverseDifference emerged as the most discriminative (AUC = 0.68) in external validation, highlighting the role of fine-grained texture patterns in distinguishing histological subtypes. This feature quantifies the homogeneity of gray-level differences, and its prominence suggests that subtle spatial regularities may encode biologically relevant information. However, the model’s full predictive capacity was realized only through the combined use of multiple features, supporting the superiority of ensemble learning and multivariate modeling over single-feature reliance.
This aligns with emerging consensus in radiomics literature that tumor heterogeneity is inherently multidimensional and cannot be adequately captured through univariate descriptors. The ability of XGBoost to model nonlinear interactions among features further enhances its suitability for radiomic applications, where feature interdependencies are common and biologically meaningful.
Model Performance and Generalizability
Among the evaluated classifiers, Extreme Gradient Boosting (XGBoost) consistently demonstrated superior performance across internal and external validation cohorts. During external validation, XGBoost achieved an AUC-ROC of 0.82 (95% CI: 0.73–0.91), the highest among all models, alongside a favorable Brier score (0.12), indicating both strong discriminative ability and well-calibrated probability estimates. These findings underscore the model’s robustness and generalizability across independent imaging cohorts, an essential criterion for clinical translation in multicentre radiomics.
Support Vector Machine (SVM) and Logistic Regression (LR) exhibited moderate external performance, with AUC-ROC values of 0.69 and 0.61, respectively. While LR showed reduced discriminative power, its calibration curve aligned more closely with observed outcomes than SVM, suggesting potential utility in clinical decision support where probability estimation is critical.
Precision recall curve importance
The imbalance training data is known to posed a risk of biased learning toward the majority class, potentially compromising minority class recall. Post-resampling with SMOTE, the balanced dataset of training model enabled the classifiers to learn more equitable decision boundaries, contributing to improved F1 scores and precision–recall behavior. Precision recall curve analysis highlighted the importance of evaluating minority-class performance in non-resampled external validation data. Where, XGBoost achieved the highest average precision (AP = 0.91) during external validation, followed by SVM (AP = 0.89) and LR (AP = 0.80). These results affirm the model’s ability to rank minority cases effectively across thresholds, a crucial consideration in unbalanced external clinical datasets in real clinical settings.
Calibration and Statistical Comparison
Calibration curves revealed that XGBoost predictions were most closely aligned with observed outcomes, followed by LR and SVM. DeLong’s test confirmed a statistically significant difference in AUC between XGBoost and SVM (p = 0.04), validating XGBoost’s superior discriminative performance. Differences between LR and XGBoost (p = 0.32) and LR and SVM (p = 0.35) were not statistically significant, suggesting that LR’s calibration may offset its lower AUC in certain clinical contexts.
Clinical Utility
Beyond statistical performance, the study evaluated the clinical utility of the proposed model using Decision Curve Analysis and Clinical Impact. These tools evaluate model-guided decisions’ net benefits throughout an array of threshold probabilities, offering a better understanding of clinical relevance than traditional metrics alone.
The XGBoost model demonstrated a consistently higher net clinical benefit, particularly at threshold probabilities above 10%, indicating that it could be deployed in clinical settings with relatively low risk tolerance. This is a significant improvement over earlier models by Zhang et al.,27 which required thresholds above 20% to achieve an actionable benefit. The lower threshold enhances the model’s applicability in early diagnostic workflows, where timely and accurate histological classification can inform treatment planning, biopsy decisions, and prognostic assessment.
Clinical impact curves further illustrated the model’s potential to reduce unnecessary interventions while maximizing true positive classifications. Such analyses are rarely included in radiomics studies but are essential for bridging the gap between algorithmic performance and real-world utility. By incorporating these evaluations, the present study advances the field toward decision-support integration, aligning with the goals of precision oncology.
Adherence to Radiomics Reporting Standards and Harmonization
A defining strength of this study is its strict adherence to radiomics reporting standards and harmonization protocols. Feature extraction was conducted using IBSI-compliant tools, ensuring reproducibility and standardization across imaging platforms. A key strength of this work is its adherence to established radiomics reporting standards, CLEAR, and the use of IBSI-compliant feature extraction tools, which were also inconsistent with earlier studies as reported in a systematic review and meta-analysis by Dwivedi et al.,30. The present study also followed the CLEAR checklist, promoting transparency in feature definitions, preprocessing steps, and model evaluation criteria.
To address inter-scanner variability, a major challenge in multicenter radiomics, the study employed ComBat harmonization, a statistical technique originally developed for genomics but now widely adopted in imaging. ComBat adjusts for batch effects while preserving biological signal, enabling the integration of heterogeneous datasets without compromising feature stability. This step is particularly critical in multicenter studies, where scanner differences can introduce confounding variability that undermines model generalizability.
Furthermore, the study adhered to Transparent Reporting of a multivariable prediction model for Individual Prognosis or Diagnosis (TRIPOD), Type 3 validation guidelines, which require external validation using independent datasets modeling. 42,43 This level of rigor is rarely achieved in radiomics literature, and the present study represented a significant methodological contribution. By demonstrating reproducibility across centers and scanners, the study sets a benchmark for future multicenter radiomics research and supports regulatory approval pathways.
Limitations
Despite its strengths, it is equally important to acknowledge several limitations that warrant discussion. First, the analysis was restricted to PET-derived radiomic features, excluding complementary modalities such as CT or MRI, which may provide additional anatomical and structural information. The integration of multimodal imaging could enhance model performance and offer a more comprehensive representation of tumor biology.
Future Directions
Building upon the current findings, several avenues for future research merit exploration to enhance the clinical utility and translational robustness of PET radiomics-based classifiers. Hybrid modeling approaches that combine handcrafted radiomic features with deep learning-derived embeddings offer promising potential. Techniques such as transfer learning, convolutional autoencoders, and attention-based architectures could capture higher-order abstractions and spatial hierarchies that are difficult to encode manually. Prospective validation in real-world clinical workflows is essential to assess model impact on diagnostic decision-making, treatment planning, and patient outcomes. Finally, federated learning frameworks should be investigated to enable collaborative model development across institutions without compromising patient privacy. Such approaches align with the principles of open science and may accelerate the adoption of radiomics in regulated clinical environments.
Conclusion
This study demonstrates the feasibility and translational potential of PET radiomics integrated with hyper tuned ensemble machine learning framework for non-invasive histological subtyping in non-small cell lung cancer. Through rigorous benchmarking and validation across independent imaging cohorts, the proposed framework addresses a longstanding challenge in radiomics research, ensuring model generalizability beyond internal datasets.
The adoption of standardized radiomics pipelines, IBSI-compliant feature extraction, ComBat harmonization, and external validation protocols reinforces methodological reproducibility and aligns with emerging standards in multicentre imaging studies. Notably, the inclusion of decision curve and clinical impact analyses extends the evaluation beyond statistical performance, offering insights into real-world utility and clinical relevance. By demonstrating robust performance across diverse cohorts and incorporating calibration-aware assessments, the study underscores the critical importance of external validation in radiomics workflows. These findings support the integration of PET radiomics-based decision-support systems into routine oncological practice, facilitating more personalized, efficient, and minimally invasive diagnostic pathways.
Taken together, the contributions of this work position PET radiomics as a clinically viable tool for precision oncology. Future research should prioritize multimodal imaging integration, hybrid modeling approaches that combine handcrafted and deep learning-derived features, and prospective clinical trials to fully realize the translational impact of radiomics in lung cancer management.
Acknowledgement
The authors would like to thank Amity University Maharashtra and ACTREC, Tata Memorial Centre for the successful execution of this research work.
Funding Sources
The author(s) received no financial support for the research, authorship, and/or publication of this article.
Conflict of Interest
The author(s) do not have any conflict of interest.
Data Availability Statement
This statement does not apply to this article, since the raw data utilized for the research is available in the public domain.
Ethics Statement
This research did not require ethical approval.
Informed Consent Statement
Informed consent was not required.
Clinical Trial Registration
This research does not involve any clinical trials.
Permission to reproduce material from other sources
Not Applicable
Author Contributions
Pooja Dwivedi: Conceptualization, Methodology, Analysis, & Writing
Sagar Barage: Analysis & Reviewing
Ashish Kumar Jha: Methodology & Analysis
Archi Agrawal: Visualization & Reviewing
Venkatesh Rangarajan: Visualization & Reviewing
References
- Bray F, Laversanne M, Sung H, et al. Global cancer statistics 2022: GLOBOCAN estimates of incidence and mortality worldwide for 36 cancers in 185 countries. CA Cancer J Clin. 2024;74(3):229-263.
CrossRef - Chen Z, Fillmore CM, Hammerman PS, Kim CF, Wong KK. Non-small-cell lung cancers: a heterogeneous set of diseases. Nat Rev Cancer. 2014;14(8):535-546.
CrossRef - Travis WD, Brambilla E, Nicholson AG, et al. The 2015 World Health Organization Classification of Lung Tumors: Impact of Genetic, Clinical and Radiologic Advances since the 2004 Classification. Journal of Thoracic Oncology.Elsevier Inc. 2015;10(9):1243-1260.
CrossRef - Thomas A, Liu S V, Subramaniam DS, Giaccone G. Refining the treatment of NSCLC according to histological and molecular subtypes. Nat Rev Clin Oncol.Nature Publishing Group. 2015;12(9):511-526.
CrossRef - Langer CJ, Besse B, Gualberto A, Brambilla E, Soria JC. The Evolving Role of Histology in the Management of Advanced Non–Small-Cell Lung Cancer. Journal of Clinical Oncology. 2010;28(36):5311-5320.
CrossRef - Rivera MP, Mehta AC, Wahidi MM. Establishing the Diagnosis of Lung Cancer. Chest. 2013;143(5):e142S-e165S.
CrossRef - Ebrahimi M, Auger M, Jung S, Fraser RS. Diagnostic concordance of non–small cell lung carcinoma subtypes between biopsy and cytology specimens obtained during the same procedure. Cancer Cytopathol. 2016;124(10):737-743.
CrossRef - Gal AA. Use and abuse of lung biopsy. Adv Anat Pathol. 2005;12(4):195-202.
CrossRef - Biancosino C, Krüger M, Vollmer E, Welker L. Intraoperative fine needle aspirations – diagnosis and typing of lung cancer in small biopsies: Challenges and limitations. Diagn Pathol. 2016;11:59.
CrossRef - De Margerie-Mellon C, De Bazelaire C, De Kerviler E. Image-guided biopsy in primary lung cancer: Why, when and how. Diagn Interv Imaging.Elsevier Masson SAS. 2016;97(10):965-972.
CrossRef - Heitzman ER. The role of computed tomography in the diagnosis and management of lung cancer. An overview. Chest. 1986;89(4 Suppl):237S-241S.
CrossRef - Sim AJ, Kaza E, Singer L, Rosenberg SA. A review of the role of MRI in diagnosis and treatment of early stage lung cancer. Clin Transl Radiat Oncol. 2020;24:16-22.
CrossRef - Lu J, Feng F, Jin Z. Cancer Diagnosis and Treatment Guidance: Role of MRI and MRI Probes in the Era of Molecular Imaging. Curr Pharm Biotechnol. 2014;14(8):714-722.
CrossRef - Francis IR. The clinical role of CT/PET in oncology: an update. Cancer Imaging. 2005;5(special issue A):S68-S75.
CrossRef - Mayerhoefer ME, Materka A, Langs G, et al. Introduction to Radiomics. Journal of Nuclear Medicine. 2020;61(4):488-495.
CrossRef - Chicklore S, Goh V, Siddique M, Roy A, Marsden PK, Cook GJR. Quantifying tumour heterogeneity in 18F-FDG PET/CT imaging by texture analysis. Eur J Nucl Med Mol Imaging. 2013;40(1):133-140.
CrossRef - Gillies RJ, Kinahan PE, Hricak H. Radiomics: Images Are More than Pictures, They Are Data. Radiology. 2016;278(2):563-577.
CrossRef - Lambin P, Rios-Velazquez E, Leijenaar R, et al. Radiomics: extracting more information from medical images using advanced feature analysis. Eur J Cancer. 2012;48(4):441-446.
CrossRef - Lambin P, Zindler J, Vanneste BGL, et al. Decision support systems for personalized and participative radiation oncology. Adv Drug Deliv Rev. 2017;109:131-153.
CrossRef - Lee G, Lee HY, Ko ES, Jeong WK. Radiomics and imaging genomics in precision medicine. Precision and Future Medicine. 2017;1(1):10-31.
CrossRef - Kirienko M, Cozzi L, Rossi A, et al. Ability of FDG PET and CT radiomics features to differentiate between primary and metastatic lung lesions. Eur J Nucl Med Mol Imaging. 2018;45(10):1649-1660.
CrossRef - Sha X, Gong G, Qiu Q, Duan J, Li D, Yin Y. Identifying pathological subtypes of non-small-cell lung cancer by using the radiomic features of 18F-fluorodeoxyglucose positron emission computed tomography. Transl Cancer Res. 2019;8:1741-1749.
CrossRef - Hyun SH, Ahn MS, Koh YW, Lee SJ. A Machine-Learning Approach Using PET-Based Radiomics to Predict the Histological Subtypes of Lung Cancer. Clin Nucl Med. 2019;44(12):956-960.
CrossRef - Han Y, Ma Y, Wu Z, et al. Histologic subtype classification of non-small cell lung cancer using PET/CT images. Eur J Nucl Med Mol Imaging. 2021;48(2):350-360.
CrossRef - Tang X, Liang J, Xiang B, et al. Positron Emission Tomography/Magnetic Resonance Imaging Radiomics in Predicting Lung Adenocarcinoma and Squamous Cell Carcinoma. Front Oncol. 2022;12.
CrossRef - Dondi F, Gatta R, Albano D, et al. Role of Radiomics Features and Machine Learning for the Histological Classification of Stage I and Stage II NSCLC at [18F]FDG PET/CT: A Comparison between Two PET/CT Scanners. J Clin Med. 2023;12(1).
CrossRef - Zhang Y, Liu H, Chang C, Yin Y, Wang R. Machine learning for differentiating lung squamous cell cancer from adenocarcinoma using Clinical-Metabolic characteristics and 18F-FDG PET/CT radiomics. PLoS One. 2024;19(4 April).
CrossRef - Ren C, Zhang J, Qi M, et al. Machine learning based on clinico-biological features integrated 18F-FDG PET/CT radiomics for distinguishing squamous cell carcinoma from adenocarcinoma of lung. Eur J Nucl Med Mol Imaging. 2021;48(5):1538-1549.
CrossRef - Shen H, Chen L, Liu K, et al. A subregion-based positron emission tomography/computed tomography (PET/CT) radiomics model for the classification of non-small cell lung cancer histopathological subtypes. Quant Imaging Med Surg. 2021;11(7):2918-2932.
CrossRef - Dwivedi P, Barage S, Jha A, et al. Artificial Intelligence Assisted 18F-FDG PET Radiomics in Classifying Histological Subtypes of Lung Cancer: Systematic Review and Meta-analysis. Nucl Med Mol Imaging. Published online May 17, 2025. doi:10.1007/s13139-025-00922-4
CrossRef - Kocak B, Baessler B, Bakas S, et al. CheckList for EvaluAtion of Radiomics research (CLEAR): a step-by-step reporting guideline for authors and reviewers endorsed by ESR and EuSoMII. Insights Imaging. 2023;14(1):75.
CrossRef - Clark K, Vendt B, Smith K, et al. The Cancer Imaging Archive (TCIA): Maintaining and Operating a Public Information Repository. J Digit Imaging. 2013;26(6):1045-1057. doi:10.1007/s10278-013-9622-7
CrossRef - Bakr S, Gevaert O, Echegaray S, et al. A radiogenomic dataset of non-small cell lung cancer. Sci Data. 2018;5(1):180202. doi:10.1038/sdata.2018.202
CrossRef - Li, P., Wang, S., Li, T., Lu, J., HuangFu, Y., & Wang, D. (2020). A Large-Scale CT and PET/CT Dataset for Lung Cancer Diagnosis (Lung-PET-CT-Dx) [Data set]. The Cancer Imaging Archive. https://doi.org/10.7937/TCIA.2020.NNC2-0461.
- Zwanenburg A, Vallières M, Abdalah MA, et al. The Image Biomarker Standardization Initiative: Standardized Quantitative Radiomics for High-Throughput Image-based Phenotyping. Radiology. 2020;295(2):328-338.
CrossRef - Nioche C, Orlhac F, Boughdad S, et al. LIFEx: A Freeware for Radiomic Feature Calculation in Multimodality Imaging to Accelerate Advances in the Characterization of Tumor Heterogeneity. Cancer Res. 2018;78(16):4786-4789.
CrossRef - Orlhac F, Eertink JJ, Cottereau AS, et al. A Guide to ComBat Harmonization of Imaging Biomarkers in Multicenter Studies. Journal of Nuclear Medicine. 2022;63(2):172-179.
CrossRef - Dwivedi P, Barage S, Singh R, et al. PET-based radiomic analysis in multicentre lung cancer study and impact of feature domain harmonization. Phys Eng Sci Med. Published online August 18, 2025. doi:10.1007/s13246-025-01625-y
CrossRef - Ha S, Choi H, Cheon GJ, et al. Autoclustering of Non-small Cell Lung Carcinoma Subtypes on 18F-FDG PET Using Texture Analysis: A Preliminary Result. Nucl Med Mol Imaging. 2014;48(4):278-286.
CrossRef - Kim DH, Jung J hoon, Son SH, et al. Prognostic Significance of Intratumoral Metabolic Heterogeneity on 18F-FDG PET/CT in Pathological N0 Non–Small Cell Lung Cancer. Clin Nucl Med. 2015;40(9):708-714.
CrossRef - Zhao H, Su Y, Wang M, et al. The Machine Learning Model for Distinguishing Pathological Subtypes of Non-Small Cell Lung Cancer. Front Oncol. 2022;12.
CrossRef - Park JE, Kim D, Kim HS, et al. Quality of science and reporting of radiomics in oncologic studies: room for improvement according to radiomics quality score and TRIPOD statement. Eur Radiol. 2020;30(1):523-536.
CrossRef - Moons KGM, Altman DG, Reitsma JB, et al. Transparent reporting of a multivariable prediction model for individual prognosis or diagnosis (TRIPOD): Explanation and elaboration. Ann Intern Med. 2015;162(1):W1-W73.
CrossRef

