
Manuscript accepted on :27-122025
Published online on: 09-02-2026
Plagiarism Check: Yes
Reviewed by: Dr. Elina Margarida Ribeiro Marinho
Second Review by: Dr. Hassan Shora
Final Approval by: Dr. Anton R Keslav
Usha Velusamy1* , Sathya Velusamy2, Anitha Thambiayyan3, Sathiya Priya Selvaraj4, Vinodhini Kanakaraj1and Madhumitha Chidambaram1
1Department of Computer Science and Engineering, Vel Tech Rangarajan Dr. Sagunthala R&D Institute of Science and Technology, Chennai, India.
2Department of Information Technology, Velammal Engineering College, Surapet, Chennai.
3Department of Artificial Intelligence and Data Science, Vel Tech Multi Tech Dr.Rangarajan Dr.Sakunthala Engineering College, Chennai, India.
4Department of Information Technology, Vel Tech High Tech Dr.Rangarajan Dr.Sakunthala Engineering College, Chennai, India.
Corresponding Author E-mail: v.ushavelusamy@gmail.com
DOI : https://dx.doi.org//10.13005/bpj/3359
Abstract
Early detection of Type 2 Diabetes (T2D) is perilous for remediating patient consequences and dropping long-term complications. This study proposes Scorpi-XStack, a diagnostic framework that integrates a novel bio-inspired optimization algorithm, ScorpiOpt, with stacked ensemble learning to enhance predictive accuracy. ScorpiOpt identifies the most discriminative clinical features by reducing redundancy and improving feature robustness. These selected features are used to train a weighted collaborative classifier containing Random Forest and XGBoost as ignoble learners, for which Logistic Regression is the master learner. The framework was validated on three benchmark datasets—Pima Indian Diabetes (Kaggle), clinical records from Medical City Hospital, Iraq (Mendeley Data), and the Frankfurt Diabetes dataset (GitHub/ResearchGate)—after applying ETL processing, mean/mode imputation for missing values, and z-score normalization. Classical recital remained assessed via stratiform 5-fold cross-validation, springy an accurateness of 98.54%, F1-score of 98.50%, balanced accuracy of 98.52% and AUROC of 99.86%. Compared with existing methods (85–95% accuracy range), Scorpi-XStack demonstrated consistent improvements across multiple performance metrics. While results are promising, limitations such as dataset heterogeneity, potential overfitting, and computational overhead should be noted. Further validation on larger, independent, and multi-center cohorts is necessary to confirm clinical applicability and generalizability.
Keywords
Diabetes Prediction; Metaheuristic Optimization; ScorpiOpt; Scorpi-XStack; Stacked Ensemble Learning
Download this article as:| Copy the following to cite this article: Velusamy U, Velusamy S, Thambiayyan A, Selvaraj S. P, Kanakaraj V, Chidambaram M. Scorpi-XStack: Improving Type 2 Diabetes Prediction via Feature Optimization and Stacking. Biomed Pharmacol J 2026;19(1). |
| Copy the following to cite this URL: Velusamy U, Velusamy S, Thambiayyan A, Selvaraj S. P, Kanakaraj V, Chidambaram M. Scorpi-XStack: Improving Type 2 Diabetes Prediction via Feature Optimization and Stacking. Biomed Pharmacol J 2026;19(1). Available from: https://bit.ly/4aCIOel |
Introduction
Type 2 Diabetes (T2D) is a long-lasting illness that changes what way the body manages blood sugar. Even though it doesn’t spread from person to person, if not caught early,1 and managed properly, it can basis stern well-being glitches similar heart sickness,2 nerve mutilation, or kidney issues. Since it accounts for more than 90% of all diabetes belongings worldwide,3 it’s a foremost health concern. In 2021, about 537 million people remained active with T2D4, and that amount is expected to grow to around 783 million by 2045. One of the main challenges is that early symptoms are often subtle or asymptomatic, which hampers timely diagnosis or is even non-existent, which makes catching the condition early quite difficult.5 That’s why finding simple, effective ways to detect T2D early is so important—doing so can lead to better health consequences and diminish the draining on healthcare schemes.6 To advances in machine learning (ML) and AI,7 doctors now take better tools to predict and evaluate the risk of developing T2D. These technologies help make smarter decisions based on data in medical practice. But there’s a challenge: the data used to diagnose diabetes often has lots of different pieces of information—many of which might be unnecessary or repetitive. Handling so much data can cause models to become overfitted, meaning they work fit on the drill data nevertheless not so fit on novel cases. That’s why there’s a growing need for smart methods to pick out the most useful pieces of data, which can recover the correctness and efficiency of these predictive replicas when they’re used on real patients.8 Selecting the right features is really important — it helps simplify the data and makes the models more accurate, especially in medical fields where understanding and precision are key. Tools inspired by nature, like genetic algorithms, ant colony algorithms, and particle swarm optimization have shown that they are effective at picking the best combinations of features for clinical datasets.9
Even with recent progress, many current models still face issues like low sensitivity, weak feature robustness, and a disconnect between feature selection and ensemble classification.10 Plus, most methods tend to focus on either fine-tuning the model structure or choosing the best features, but rarely do both at the same time. While deep learning replicas that piece together as black boxes are incredibly powerful, they often aren’t widely accepted in clinical environments because they’re hard to interpret and require a lot of computing power. A combined approach that pairs solid feature selection with an understandable, high-performing ensemble method could really help bridge this gap and make these tools more practical.
To tackle these challenges, to introduce Scorpi-XStack—a smart, hybrid approach for spotting Type 2 Diabetes early. At its core, a novel feature selection strategy, termed ScorpiOpt, a new algorithm inspired by scorpions that helps identify the most important clinical features from large and complex datasets. These meticulously selected characteristics are then employed in Scorpi-XStack, a two-part model that uses Random Forest and XGBoost as primary techniques, with Logistic Regression making the final choice. This design not only improves prediction accuracy, but it also makes the classic more reliable and simpler to comprehend for healthcare professionals—important aspects for real-world applications.
The Scorpi-XStack performed remarkably well, with a prediction accuracy of 98.54%. It also achieved an AUROC of 0.9986 and a balanced accuracy of 98.52% on a real-world type 2 diabetes dataset. These findings greatly outperformed normal baseline models, which typically achieve 85% to 95% accuracy 1.5. This illustrates how combining smart feature selection and layered ensemble learning may make a significant impact. The ScorpiOpt algorithm takes a novel way to optimizing biological data, making the whole system a cost-effective, simple, and reliable option for early diabetes screening. Overall, this study brings us closer to practical tools that clinicians may use to make informed choices concerning T2D. This study makes significant advances in the issue of forecasting Type 2 diabetes.20 These developments, which range from novel algorithm concepts to improved methods of merging diverse models, result in more accurate forecasts, outcomes that are more important to clinicians, and computer systems that work more smoothly.
This work makes important additions to our knowledge of the area. The introduction of ScorpiOpt, a new optimization method inspired by scorpions, helps find the greatest pertinent clinical structures for foreseeing Type 2 Diabetes, reducing the number of variables needed and improving efficiency. Established Scorpi-XStack, a durable stacked typical that blends XGBoost and Random Forest as its main components, with Logistic Regression serving by way of the final decision-maker.
This setup boosts accuracy, helps the model generalize better, and offers a relatively more interpretable alternative to deep learning approaches, particularly through the use of Logistic Regression as the meta-learner. When tested on real-world diabetes data, this integrated framework hit an impressive 98.54% accuracy, an AUROC of 0.9986, and an F1-score of 0.9850. It outperformed traditional models and shows promise for early T2D risk prediction in clinical settings.
Recent progress in predicting diabetes emphasizes how ensemble and bio-inspired learning methods are becoming key in enhancing diagnostic accuracy. For example, boosting ensemble models like XGBoost has consistently shown strong results across different datasets, serving as reliable benchmarks for clinical predictions.21,22 These ensemble approaches aren’t just limited to diabetes — they’ve also been linked to broader health issues, such as examining how diabetes risk relates to bone health. 23,24 At the same time, bio-inspired optimization techniques are gaining popularity for selecting important features and catching early signs of diabetes. They help simplify complex data, making it easier to interpret clinically. Beyond just early detection, machine learning is now used to predict how diabetes might progress over time, emphasizing the importance of temporal models for patient care.25 New ensemble models keep raising the bar, showing improved AUROC scores compared to traditional XGBoost methods, and demonstrating the promise of hybrid approaches in medical research. All these studies together show that blending advanced ensemble techniques with bio-inspired feature selection helps build models that are not only precise, but also reliable and relevant for actual clinical use.
The remaining part of this detail is organised as follows: This work begins by describing the datasets employed and the preprocessing steps applied through ETL methods to ensure data consistency and quality. It then introduces the proposed ScorpiOpt algorithm and explains its role in identifying the most relevant clinical features. Next, the Scorpi-XStack classifier is presented, and its predictive performance is assessed using multiple evaluation metrics. The experimental outcomes are compared with existing approaches to demonstrate the improvements achieved. Lastly, the paper accomplishes by an instant of main conclusions and probable instructions for imminent research.
Material and methods
Dataset
In this work, three different datasets are used to build and test the Scorpi-XStack framework. The first one is the well-known Pima Indians Diabetes dataset from Kaggle, which has 768 samples and eight common clinical features like plasma glucose, pregnancies, blood pressure, BMI, diabetes pedigree, skinfold thickness, and age. It includes 268 diabetic cases and 500 non-diabetic ones. The second dataset comes from real clinical records at Medical City Hospital in Iraq, sourced from Mendeley Data. It features various demographic and biochemical details such as age, BMI, HbA1c, cholesterol, LDL, urea, and creatinine. The third dataset is from a healthcare facility in Frankfurt, Germany, available through GitHub and ResearchGate. It provides anonymized patient data with demographic info and lab markers important for assessing diabetes risk. Using these different datasets from diverse populations helps improve the model’s generalizability, but also makes handling the data more challenging due to its variability.
To maintain consistency, an ETL (Extract, Transform, Load) pipeline was constructed. During the extraction phase, only the important features were selected, while identifiers such as patient IDs and hospital numbers were removed. In the transformation step, misplaced facts were ascribed—by means of the mean for incessant variables and the manner for definite ones. Clinical data were harmonized by converting laboratory results into uniform units, and all numerical variables were standardized with z-score normalization so that scale differences did not skew the results. The outcome variable—diabetic versus non-diabetic—was isolated as the target label. The datasets were then combined by aligning variable names and measurement units, resulting in a clean and standardized dataset ready for machine learning. Since the datasets originated from different regions (Iraq and Germany), distributions of key variables were examined to account for population differences. Harmonization procedures, such as unit standardization and within-dataset normalization, were applied to minimize bias. All datasets were anonymized and openly shared through platforms such as Kaggle, Mendeley, GitHub, and ResearchGate, ensuring compliance with ethical standards.
Data Preprocessing: Column Elimination and Feature Scaling
To prepare the dataset for modeling, two important preprocessing steps were applied. Initially, ID and Patient ID (formerly known as No Pation) were removed as they were deemed superfluous variables that did not contribute to the prediction process. Afterwards, the dependent variable used during model training was the result variable, which is the goal label, which was taken from the feature set. To ensure data completeness, mean and mode imputation were used to address missing values in the datasets. This was followed by the usage of scikit-learn’s StandardScaler to scale features by z-score normalization. By adjusting all structures to take zero mean and item variance into consideration, researchers were able to prevent larger variables from overpowering the model and improve optimization convergence. These steps created a solid foundation for further feature selection and classification, ensured that features were represented consistently, and removed scale-related bias.
Data Labeling and Encoding
The outcome variable was labeled as a binary class “1” for diabetic and “0” for non-diabetic” to help with supervised learning. Categorical attributes, where applicable, were converted into numbers using label encoding. This made the data easier for the algorithms to work with. The encoding kept any order in the categories and simplified the data input. Each dataset was labeled and encoded in the same way to keep things consistent across sources before merging through the ETL pipeline.
Relevant Feature Extraction
Some traits are more useful than others for predicting the likelihood of disorders such as type 2 diabetes. Model effectiveness, processing speed, and interpretability may all suffer if any of these data points are irrelevant, redundant, or just generate noise. In response, they invented ScorpiOpt, a unique bio-inspired method for painstakingly isolating essential clinical characteristics. ScorpiOpt, like a scorpion stalking its prey, will consider various options before deciding on the best. Each set of features is shown as a simple binary list, with ‘1’ meaning the feature is included and ‘0’ meaning it’s left out. To check each candidate set by training an XGBoost classifier with 5-fold cross-validation and measuring its mean F1-score. The algorithm then uses the best current solution as a guide, tweaking feature choices randomly based on probability rules. This balance between trying new combinations and refining promising ones helps ScorpiOpt avoid getting stuck in local traps and move toward the best possible subset. Using ScorpiOpt led to clear improvements in prediction accuracy. As seen in Table 1, selecting features increased the F1-score of Random Forest from 96.47% to 97.30%, XGBoost from 97.69% to 97.99%, and Logistic Regression from 83.01% to 88.40%. When we trained our stacked ensemble model, Scorpi-XStack, on the chosen features, it achieved an impressive F1-score of 98.50%, way better than traditional methods, which usually score between 85% and 95%. In summary, ScorpiOpt smartly filters out unhelpful, repetitive, or noisy data, giving a cleaner set of features. This not only boosts prediction accuracy but also cuts down on computation and makes models easier to understand.
Based on ScorpiOpt’s feature selection process, the most important features for predicting Type 2 Diabetes include plasma glucose levels, BMI, HbA1c, age, HDL cholesterol, and diabetes pedigree function. These features had the highest importance scores (shown in Figure 2), indicating they are strongly related to diabetic status across different datasets.
ScorpiOpt: A Scorpion-Inspired Optimization
ScorpiOpt is an advanced bioinspired meronyms procedure modeled on the hunting and adaptive survival tactics of scorpions. Similar to how scorpions balance exploration (searching new areas) and exploitation (focusing on prey), ScorpiOpt alternates between searching diverse feature subsets and refining promising solutions. This dual behavior makes it compatible for multifaceted, high-dimensional optimization problems namely clinical feature selection.
Apiece intrant solution, or agent, is characterized as a binary vector in equ (1), which helps the algorithm process and select features efficiently.
![]()
Where indicates the selection of the jth feature in the ith agent (solution), and n is the entire amount of structures.
The fitness function, denoted as F(Si), is basically the average F1-score in equ (2). Evaluated this by means of 5-fold cross-validation, and consider the features selected by Si. In simple terms, averaging the scores from five different tests, each time using different parts of the data, but sticking to the same features.
![]()
where XSi is the reduced feature matrix formed by applying mask Si to X, and y is the target label vector. XGBoost was selected as the base evaluator owing to the situation robustness, skill to grip heterogeneous clinical features, and superior performance in imbalanced classification tasks.
The algorithm starts by creating a group of N scorpions, then assesses how good each one is. The top solution, called Sbest, guides the movement of the other scorpions using bitwise update rules. This process mimics both exploration—searching new areas—and exploitation. At each step t, a new solution for scorpion i is generated as equ(3).
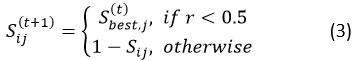
where r∼U(0,1) is a consistently dispersed arbitrary number, and p is the probability of adopting the best-known feature configuration. This stochastic rule balances exploitation (adopting features from the current best solution Sbest) with exploration (flipping bits to discover new subsets). The randomness introduced by 𝑟 ensures population diversity and prevents premature convergence.
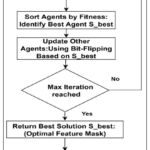 |
Figure 1: ScorpiOpt-Based Selection Strategy for Dimensionality Reduction |
Figure 1 specifies that the ScorpiOpt feature selection process kicks off by creating a group of agents. Like a short byte string, each agent’s bits represent the selection status of a feature. Subsequently, to train an XGBoost classifier using the given features and compute the F1-score using 5-fold cross-validation to evaluate the performance of each agent once we’ve selected the first group. All potential solutions (agents) are evaluated once their performance has been evaluated; the best one, S_best, is used as a reference point. After that, the remaining agents are brought up to speed by adjusting their binary feature selections in accordance with S_best. An agent may either take the value from S_best or change its bit for each feature, encouraging exploration and refinement in the search area. Over the course of several rounds, the population is gradually guided to better options by this grading and updating process. Following the stretching of the maximum number of repetitions, the optimal feature mask is selected as S_best, the best solution. By lowering facets and removing important topographies from the standardized dataset, this mask improves the interpretability of the final model.
The final classification model is trained using the supplied attributes. To train the final model for categorization, these characteristics are chosen. Overall, ScorpiOpt does a great job compared to GA, PSO, and GWO. For choosing features, many people have used traditional metaheuristics alike Particle Swarm Optimization (PSO), Genetic Algorithm (GA) and Grey Wolf Optimizer (GWO). But they often run into problems like too much convergence too soon, being sensitive to parameter setting, and having trouble keeping population variation in high-dimensional data.
ScorpiOpt differs in three key ways: (i) its probabilistic bitwise update mechanism maintains diversity while steadily guiding the search toward optimal solutions, (ii) it requires fewer hyperparameters, making it computationally efficient, and (iii) its exploration–exploitation balance is dynamically adjusted by stochastic flips, which helps avoid local optima. These innovations make ScorpiOpt particularly effective for clinical feature selection, where datasets are often noisy and heterogeneous.
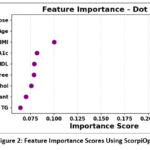 |
Figure 2: Feature Importance Scores Using ScorpiOpt |
The Dot Plot for Feature Importance shows in Figure 2 which clinical features matter most for predicting diabetes, based on the ScorpiOpt optimization. Each dot stands for a feature’s importance score—think of it as a measure of how much that feature influences the prediction. Feature importance scores derived from ScorpiOpt-selected features. The top predictors include glucose, age, BMI, HbA1c, HDL, and diabetes pedigree function. The position of each dot along the horizontal axis reveals how important each feature is relative to the others. This simple visualization makes it easy to understand which features the model relies on most, emphasizing how choosing the right features can lead to better, more accurate predictions.
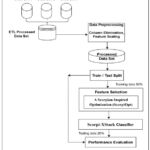 |
Figure 3: Proposed Scorpi-XStack Classifier Framework |
Figure 3 shows the Scorpi-XStack framework integrates three datasets (Pima Indian, Iraqi, and Frankfurt) using an ETL process to ensure consistency and completeness. After merging, irrelevant identifiers (e.g., patient IDs) are removed, and all features are standardized using z-score normalization. The dataset is then riven mad about drill and testing sets with stratified proportions to reduce class imbalance. ScorpiOpt is applied for feature selection, producing a subset of the most relevant predictors. These features are used to train a weighted collaborative classifier. Model performance is finally evaluated using multiple diagnostic metrics.
Evaluation of Predictive Outcomes
Evaluating a model using performance metrics provides a clear understanding of its predictive capability. These metrics highlight both strengths and limitations—such as bias, inability to capture meaningful patterns, or overfitting to the training data. Additionally, models are confirmed to be trustworthy enough for use in sensitive applications such as diabetes diagnosis by frequent evaluation, ensuring comparability across trials. Both interpretability and practical effectiveness must be proved throughout this step.
The confusion matrix is an important analytical tool for dual cataloging assignments. In terms of accuracy, it classifies forecasts into four categories: TrPosit, TrNegat, FaPosit, and FaNegat. Equ (4) defines accuracy as the proportion of properly categorized cases (including true positives and true negatives) to the entire number of observations. The final classification prototype is trained using the characteristics provided. These features are used to train the final classification model.
![]()
Precision enumerates the proportion of suitably recognized confident predictions among all prophesied positives. It is the proportion of accurate confident predictions among all samples that the model has categorized as positive, as specified in equ (5).
![]()
Recall (or sensitivity) specifies the capability of the model to correctly identify optimistic cases, as shown in equ (6), on behalf of the percentage of real optimistic cases that were successfully predicted.
![]()
Specificity, on the additional hand, actions the aptitude to correctly identify negative cases, as expressed in equ (8). To poise exactness and recollection, the F1-score equ(7) is computed as their harmonic mean, if a sole performance quantity that imprisonments both aspects.
The False Positive Rate (FPR) enumerates the quantity of undesirable cases erroneously confidential as confident equ (9).
![]()
The Area Under the Receiver Operating Characteristic Curve (AUROC) is a threshold-independent quantity of cataloguing presentation in equ (10). The ROC curve plots the True Positive Rate (TPR) against the False Positive Rate (FPR) across various thresholds, and AUROC represents the area under this curve. A value closer to 1.0 indicates strong discriminative ability, whereas a value adjacent 0.5 advises performance equal to a random shot.
![]()
A higher AUROC (closer to 1) means the model is better at telling things apart. An AUROC of 0.5 is like flipping a coin, while 1.0 means perfect accuracy.
Results
Table 1 illustrations the gotten outcomes by by means of the ScorpiOpt feature selection method sideways with dissimilar classifiers—RF, AdaBoost, XGBoost and Bagging—on the ETL dataset.
Table 1: The Performance measures based on with and deprived of feature selection
| Model | Feature Selection (Yes/No) | Accuracy (%) | Precision (%) | Recall (%) | Specificity (%) | F1 Score (%) | AUROC (%) |
| Random Forest | No | 96.55 | 96.99 | 95.95 | 97.14 | 96.47 | 99.55 |
| Yes | 97.35 | 97.71 | 96.89 | 97.8 | 97.3 | 99.64 | |
| XGBoost | No | 97.75 | 98.36 | 97.03 | 98.44 | 97.69 | 99.66 |
| Yes | 98.05 | 98.72 | 97.27 | 98.78 | 97.99 | 99.74 | |
| AdaBoost | No | 81.7 | 82.58 | 79.46 | 83.85 | 80.99 | 90.45 |
| Yes | 85 | 85.73 | 83.15 | 86.84 | 84.42 | 92.53 | |
| Logistic Regression | No | 83.42 | 84.16 | 81.89 | 84.95 | 83.01 | 89.65 |
| Yes | 88.78 | 89.5 | 87.32 | 90.2 | 88.4 | 93.7 | |
| Bagging | No | 97.21 | 97.55 | 96.76 | 97.66 | 97.15 | 99.72 |
| Yes | 97.65 | 98.08 | 97 | 98 | 97.53 | 99.78 | |
| Proposed: Scorpi-XStack | Yes | 98.54 | 99.45 | 97.57 | 99.48 | 98.5 | 99.86 |
Table 1 shows how much better our models get when picked the right features and use the new Scorpi-XStack approach. All the classifiers—Random Forest, XGBoost, AdaBoost, and Bagging—perform better with feature selection, with AdaBoost jumping over 3% in accuracy. Other ensemble methods also see improvements between 0.4% and 0.8%. Even small increases like these can make a big difference in clinical settings. Most importantly, the Scorpi-XStack model beats all the traditional classifiers, even those with feature selection. It delivers the highest accuracy and is more reliable overall. This success comes from combining the ScorpiOpt feature selection method with a stacking strategy, which makes the predictions more accurate and consistent for diabetes diagnosis. The table clearly shows that bringing in relevant features and advanced ensemble techniques leads to better results than standard methods.
Table 2: Performance benchmarking of the proposed framework with modern methodologies developed by other researchers.
| Reference | Dataset Used | Accuracy (%) | Precision (%) | Recall (%) | Specificity (%) | F1 Score (%) | AUROC (%) |
| [5] | Pima Indians Diabetes | 81 | 80 | 79.2 | 82.5 | 79.6 | 85 |
| [11] | Pima Indians Diabetes | 76 | 74 | 77 | 75 | 75 | 82 |
| [12] | Pima Indians Diabetes | 83 | 82.1 | 80.5 | 84.3 | 81.3 | 87 |
| [13] | Pima Indians Diabetes | 89.5 | 88.2 | 90.3 | 88.7 | 89.2 | 91.8 |
| [14] | Pima Indians Diabetes | 91 | 89.5 | 90 | 91.6 | 89.7 | 92.3 |
| [15] | Pima Indians Diabetes | 94 | 94.3 | 93.5 | 94.5 | 93.8 | 96.8 |
| [16] | Pima Indians Diabetes | 92.5 | 91.4 | 92 | 93.2 | 91.7 | 95.1 |
| [17] | Kaggle Pima Dataset | 96.2 | 96.4 | 95.6 | 96.7 | 96 | 97.5 |
| [18] | UCI Diabetes Dataset | 95.6 | 95.3 | 95 | 96 | 95.1 | 96.9 |
| [19] | Pima + Clinical Dataset | 96.8 | 97.1 | 95.9 | 97.3 | 96.5 | 98.1 |
| Proposed: Scorpi-XStack (2025) | Combined Imputed Dataset | 98.54 | 99.45 | 97.57 | 99.48 | 98.5 | 99.86 |
Table 2 the Scorpi-XStack model, introduced here, shows impressive improvements over existing methods for predicting diabetes. When tested on a combined imputed dataset, it reached a stunning accuracy of 98.54%, beating all previous records. For comparison, top studies like 19 and 17 reported accuracies of 96.8% and 96.2%, respectively. What’s more, Scorpi-XStack’s precision (99.45%), recall (97.57%), and specificity (99.48%) are all way higher than before, which means its predictions are more reliable and it makes fewer false positives and negatives. The F1 Score (98.5%) and AUROC (99.86%) also set new standards, showing a great balance between sensitivity and precision and excellent ability to distinguish between cases. All things considered, this comparison shows that Scorpi-XStack outperforms earlier models across the board when it comes to important diagnostic metrics, including accuracy. The method shows great promise, then, as a reliable and precise means of early diabetes risk assessment.
Discussion
Influential Features and Clinical Utility
The ScorpiOpt algorithm consistently found glucose, HbA1c, BMI, and age as the main factors for Type 2 Diabetes. This matches what is already known in medicine, showing that metabolic and hereditary factors are still important signs of diabetes risk. The proposed Scorpi-XStack framework’s ability to recognize these patterns across different geographic datasets shows its possible usefulness in clinics. By correctly identifying high-risk patients with routine clinical measurements, the model helps with early diagnosis and risk assessment in primary care settings.
Challenges in ScorpiOpt Implementation
Although ScorpiOpt showed better ability to select important features, a few issues were seen. The algorithm’s computing time grows as the number of features increases. Also, adjusting parameters like population size and number of iterations can affect how reliably it finds a solution. Since ScorpiOpt uses random search behavior, results may vary slightly between runs unless you fix the random seed.
Strengths and Limitations
The main strength of this work is combining a new bio-inspired optimizer with an easy-to-understand stacked ensemble system. This combination provides both high accuracy and clear clinical explanations. However, there are some limitations, such as dataset differences, risk of overfitting on small groups, and longer computation times during the optimization and stacking steps.
Future Directions
Future research will aim to add explainable AI (XAI) methods into Scorpi-XStack to make it easier for doctors to understand. We also plan to include patient health records over time and use automatic hyperparameter tuning to make the model more reliable. We want to expand the system to work with data from multiple centers and test it in real-time healthcare settings to see how well it generalizes and if it’s practical for clinical use.
The Scorpi-XStack architecture outperforms previous ensemble techniques and single classifiers in terms of Type 2 diabetes prediction accuracy. These improvements come from combining ScorpiOpt-based feature selection with stacked ensemble learning, which goes beyond just increasing scores. These gains were heavily affected by ScorpiOpt. After removing extraneous and distracting factors, the models were able to better capture important clinical variables like glucose levels, body mass index (BMI), and hemoglobin A1c. This simplification improved the accuracy and consistency of the predictions while also reducing the possibility of overfitting. When compared to more traditional metaheuristics, ScorpiOpt is better at finding and capitalizing on potential new opportunities. That’s most likely why it consistently outperforms at finding the most relevant traits in varied datasets. Depending on the classifier, the performance gain varied. The fact that AdaBoost’s sensitivity to irrelevant features was most noticeable after feature selection shows how its boosting strategy increased its capacity to reduce bias after feature cleaning. Algorithms that are previously designed to handle noisy data, such as Random Forest and Bagging, exhibited slower but continuous growth. This pattern clearly demonstrates the need of feature modification for boosting-reliant models.
The estimates were significantly improved by including the stacking mechanism of Scorpi-XStack. By combining the results of Random Forest and XGBoost with Logistic Regression as a meta-learner and by adding a regularization effect to help reduce overfitting, this approach used different choice strategies. This explains why it consistently produced the same results across datasets, as it struck a reasonable compromise between identifying true positives and avoiding false positives. Given the modest size of our datasets, the high performance might be due to overfitting. To really prove its widespread applicability, testing on larger, more diverse populations from other places is necessary. Another potential issue with real-time clinical applications is the computational intensity of the combined feature optimization and stacking processes. In conclusion, this study only looked at data from one moment in time; future research would benefit from integrating continuous health records and tracking changes over time to show how well the models adapt to individual patients’ improvements. In sum, Scorpi-XStack shows that a combination of feature tweaking and ensemble stacking may considerably enhance the accuracy of Type 2 diabetes predictions. Future work should focus on making it more scalable, generally relevant, and easier to use in clinical settings; it should find an acceptable combination of accuracy, understandability, and reliability.
Conclusion
This paper presents Scorpi-XStack, an innovative framework using intelligent feature selection and ensemble classification to enhance the early detection of diabetes. The proposed approach attains superior predictive performance by integrating stacked ensemble learning with ScorpiOpt, a biologically-inspired optimization tool. The framework achieved an impressive 98.54% accuracy and an AUROC of 99.86% on the combined and preprocessed dataset, outperforming both traditional and recent advanced methods. While these results are auspicious, it is significant to memorandum that performance may vary on raw, heterogeneous clinical data that lacks extensive preprocessing.
The main strength of this framework is its combination of ScorpiOpt-based feature optimization with a clear, understandable stacked ensemble model. This improves both accuracy and trustworthiness in clinical use. However, there are some small limitations, such as differences in datasets and the amount of computation needed, which could make it harder to scale up. Future work will focus on making the process more efficient, automating how parameters are set, and testing on larger datasets from multiple centers. This will help the model work better across different settings.
Although Scorpi-XStack integrates Logistic Regression as the meta-learner to maintain some interpretability, the combination of stacking and bio-inspired optimization inevitably increases model complexity. Therefore, future work will focus on combining explainable AI (XAI) methods to augment the interpretability of predictions for clinical practitioners. Additionally, current experiments involved manual hyperparameter tuning, which may introduce bias; moving towards automated optimization techniques will improve reliability and reproducibility. Finally, as ensemble stacking and optimization can be computationally demanding, further investigation into scalability and efficiency is required to ensure practical use in real-time healthcare applications. Extending validation across diverse multi-center cohorts and including temporal patient health data will also strengthen the model’s adaptability and clinical relevance.
Acknowledgment
The authors sincerely acknowledge the collective self-motivation, dedication, and perseverance of all contributors in completing this work successfully.
Funding Sources
The author(s) received no financial support for the research, authorship, and/or publication of this article.
Conflict of Interest
The author(s) do not have any conflict of interest.
Date Availability Statement
The datasets that were analysed during the current study are available in [20-22].
Ethics Statement
This research did not involve human participants, animal subjects, or any material that requires ethical approval.
Informed Consent Statement
This study did not involve human participants, and therefore, informed consent was not required.
Clinical Trial Registration
This research does not involve any clinical trials.
Permission to Reproduce Material from Other Sources
Not Applicable
Author Contributions
- Usha Velusamy, Sathya Velusamy – Conceptualization, Methodology, Formal Analysis
- Anitha Thambiayyan, Sathiya Priya Selvaraj – Writing , Original Draft Preparation.
- Vinodhini Kanakaraj, Madhumitha Chidambaram – Visualization, Validation
Reference
- Zulkifli Z, Makkiyah FA, Antoni D, et.al. Multi-algorithm to measure the accuracy level of diabetes status prediction. Journal of Applied Data Sciences. 2024;5(2):736–746.
CrossRef - Barakat NH, Bradley AP, Barakat MNH. Intelligible support vector machines for diagnosis of diabetes mellitus. IEEE transactions on information technology in biomedicine. 2010;14(4):1114-1120.
CrossRef - Cho NH, Shaw JE, Karuranga S, et al. IDF Diabetes Atlas: Global estimates of diabetes prevalence for 2017 and projections for 2045. Diabetes research and clinical practice. 2018;138:271–281.
CrossRef - Brussels, Belgium. International diabetes federation: IDF diabetes atlas. ID Federation. 2021;
- Kavakiotis I, Tsave O, Salifoglou A, et al. Machine learning and data mining methods in diabetes research. Computational and structural biotechnology journal. 2017;15:104-116.
CrossRef - Theng D, Bhoyar K K. Feature selection techniques for machine learning: a survey of more than two decades of research. Knowledge and Information Systems. 2024; 66: 1575–1637.
CrossRef - Pashaei E, Jalili M. Feature selection based on bio-inspired metaheuristic algorithms: A comprehensive review. IEEE Access. 2019;7:24306-24327.
- Ribeiro MT, Singh S, Guestrin C. “Why should I trust you?”: Explaining the predictions of any classifier. In: Proceedings of the 22nd ACM SIGKDD Conference on Knowledge Discovery and Data Mining. 2016;1135-1144.
CrossRef - Shillan D, Sterne JA, Champneys A, Gibbison B. Use of machine learning to analyse routinely collected intensive care unit data: A systematic review. Critical care. 2019;23:284.
CrossRef - Kibria HB, Nahiduzzaman M, Goni MO, Ahsan M, Haider J. An ensemble approach for the prediction of diabetes mellitus using a soft voting classifier with an explainable AI. Sensors. 2022 ;22(19):7268.
CrossRef - Sisodia D, Sisodia SS. Prediction of diabetes using classification algorithms. Procedia computer science. 2018;132:1578-1585.
CrossRef - Tigga P, Garg S. Prediction of type 2 diabetes using machine learning classification methods. Procedia Computer Science, 2020;167, 706-716.
CrossRef - Alam MS, Ferdous M, Neera NS. Enhancing Diabetes Prediction: An Improved Boosting Algorithm for Diabetes Prediction. International Journal of Advanced Computer Science & Applications. 2024;15(5).
CrossRef - Kopitar L, Kocbek P, Cilar L, Sheikh A, Stiglic G. Early detection of type 2 diabetes mellitus using machine learning-based prediction models. Sci Rep. 2020;10(1):11981
CrossRef - Zhang M, Flores K.B, et.al., Deep learning and regression approaches to forecasting blood glucose levels for type 1 diabetes. Biomedical Signal Processing and Control,2021; 69,102923.
CrossRef - Rufo DD, Debelee TG, Negera WG. A hybrid machine learning model based on global and local learner algorithms for diabetes mellitus prediction. Journal of Biomimetics, Biomaterials and Biomedical Engineering. 2022;54:65-88.
CrossRef - Shekhar SC, Rao DV. Diabetes prediction using machine learning algorithms. Diabetes. 2023;52(5).
- Khan N.S, Muaz M.H, Kabir A and Islam M.N. A machine learning-based intelligent system for predicting diabetes. International Journal of Big Data and Analytics in Healthcare (IJBDAH), 2019;4(2),1-20.
CrossRef - Dutta A, Hasan MK, Ahmad M, Awal MA, Islam MA, Masud M, Meshref H. Early Prediction of Diabetes Using an Ensemble of Machine Learning Models. International Journal of Environmental Research and Public Health. 2022; 19(19):12378.
CrossRef - Alsadi B, Musleh S, Al-Absi H.R, Refaee M et al. An ensemble-based machine learning model for predicting type 2 diabetes and its effect on bone health. BMC Medical Informatics and Decision Making. 2024;24(1), p.144.
CrossRef - Ganie SM, Pramanik PK, Bashir Malik M, Mallik S, Qin H. An ensemble learning approach for diabetes prediction using boosting techniques. Frontiers in Genetics. 2023 ;14:1252159.
CrossRef - Chauhan AS, Varre MS, Izuora K, Trabia MB, Dufek JS. Prediction of diabetes mellitus progression using supervised machine learning. 2023;23(10):4658.
CrossRef - Jain A, Singhal A. Bio-inspired approach for early diabetes prediction and diet recommendation. SN Computer Science. 2024;5(1):182.
CrossRef - Dyoub A, Letteri I. Dataset optimization for chronic disease prediction with bio-inspired feature selection. 2023; arXiv preprint arXiv:2401.05380.
- Okwudili UH, Ukachukwu OO, Chijindu VC, Ezea MO, Ishaq B. An improved performance model for artificial intelligence-based diabetes prediction. Journal of Electrical Systems and Information Technology. 2025;12(1):25.
CrossRef
Abbreviations List
AI – Artificial Intelligence
AUROC – Area Under the Receiver Operating Characteristic Curve
ETL – Extract, Transform, Load
FPR – False Positive Rate
GA – Genetic Algorithm
GWO – Grey Wolf Optimizer
HbA1c – Hemoglobin A1c
HDL – High-Density Lipoprotein
ML – Machine Learning
PSO – Particle Swarm Optimization
RFE – Relevant Feature Extraction
RF – Random Forest
ScorpiOpt – Scorpion-Inspired Optimization Algorithm
Scorpi-XStack – ScorpiOpt-Based Stacked Ensemble Framework
T2D – Type 2 Diabetes
XGBoost – Extreme Gradient Boosting

