
Manuscript accepted on :08-10-2025
Published online on: 22-10-2025
Plagiarism Check: Yes
Reviewed by: Dr. Moumita Hazra and Dr. Ilya Nikolayevich Medvedev
Second Review by: Dr. Rasika Karkare
Final Approval by: Dr. Kapil Joshi
Mohit Dayal1* , Aparna Mahajan2 and Manju Khari3
1Department of Information Technology, Maharaja Agrasen University, Atal Shiksha Kunj , Distt. Solan, Himachal Pradesh, India.
2Department of Information Technology, Maharaja Agrasen Institute of Technology (MAIT), Maharaja Agrasen University, India.
3School of computer and System Sciences, Jawaharlal Nehru University, New Delhi, India.
Corresponding Author mail:mohitdayal.md@gmail.com
DOI : https://dx.doi.org/10.13005/bpj/3402
Abstract
Mental illnesses are a major public health concern and one of the main causes of disability around the globe. They also provide substantial social and economic challenges. The non-invasive, real-time capabilities of electroencephalography (EEG) have made it a potential technique for identifying neural patterns linked to a range of mental diseases. A systematic assessment of EEG-based learning models for mental disease identification is presented in this article, underscoring the expanding use of AI and machine learning in neurodiagnostic. In addition to reviewing existing literature, we implement and evaluate three fine-tuned learning models (FTLM-1, FTLM-2, and FTLM-3) alongside three widely used transfer learning models (VGG19, ResNet50, and Mobile net). Comparative analysis reveals that the fine-tuned models achieved higher classification accuracy (up to 75%) compared to transfer learning models (up to 65%), underscoring the potential of task-specific model optimization in EEG-based mental health diagnostics. This work contributes to the advancement of intelligent, data-driven approaches for early and accurate detection of mental disorders.
Keywords
Electroencephalogram; Fine Tuned Models; Mental Illness; Machine Learning; Transfer Learning
Download this article as:| Copy the following to cite this article: Dayal M, Mahajan A, Khari M. Towards Intelligent Neurodiagnostic: A Systematic Assessment of EEG-Based Learning Models for Mental Illness Detection. Biomed Pharmacol J 2026;19(June Spl Edition). |
| Copy the following to cite this URL: Dayal M, Mahajan A, Khari M. Towards Intelligent Neurodiagnostic: A Systematic Assessment of EEG-Based Learning Models for Mental Illness Detection. Biomed Pharmacol J 2026;19(June Spl Edition). Available from: https://bit.ly/4owYfcn |
Introduction
Mental disorders, often referred to as mental health issues, represent a broad spectrum of psychological conditions that may affect emotions, thoughts, and behavior.¹ These include anxiety, mood disorders, schizophrenia, eating disorders, and behavioral addictions.² In today’s busy world, many individuals suffer from mental health problems. According to a 2017 report, approximately 792 million people worldwide experienced a mental health condition, accounting for more than one in ten persons globally (10.7%).³ Whenever persistent indications and symptoms occur, mental health issues may progress into brain disorders, significantly impacting quality of life.⁴ Mental illnesses can lead to issues with one’s way of life, career, or interpersonal relationships. Psychological health includes mental, interpersonal, and empathetic quality of life.5 It influences people’s thoughts, feelings, and actions. It also influences people’s decision-making, stress management, and interpersonal relationships. In all phases of life, including childhood, adolescence, and adulthood, mental health is crucial.
On the report of World Health Organization (WHO), mental health is far beyond merely the mental diseases or impairments absenteeism.6 Optimum mental health entails not only to eliminate severe mental disorders but also to maintain overall well-being and pleasure. They also highlighted the need for the protection and repairment of mental wellbeing on an interpersonal level, and in many groups and aspects of society as well. A number of health problems may be significantly influenced by mental stress. Medical professionals and researchers use many methods to assess the severity of emotional trauma in its early phases.7 Stress and anxiety are among the factors that contribute to health issues. Its foundation is the human body’s innate response to long-term physiological, emotional, and chronic stimuli, which is controlled by the hypothalamus–pituitary–adrenocortical axis and sympathetic nerves. This phrase can be used to describe situations that result in unfavorable empathic and physiological changes, both inwardly and externally.
It is challenging to make an accurate diagnosis using the same evaluation criteria because specialists have observed that the symptoms of mental disease differ from person to person. (Reference is not correctly displayed). Moreover, these evaluation instruments determine the correctness of mental disease assessments. In situations like this, personality surveys would yield more insightful answers than physiological ones because people are ignorant of their true mental health status.
Several neuroimaging techniques were employed to measure emotional trauma by either overtly or implicitly tracking brain activity. Electroencephalograms (EEG) have the highest spatial specificity, are the least expensive, and are easily accessible, aside from neuroimaging data. The availability of more medical data and advances in computing power have resulted in a boom in the usage of machine learning (ML) and deep learning (DL) technologies. More robust systems can be created by applying machine learning or deep learning.8
Through a deeper comprehension of human behavior, machine learning (ML) opens up new avenues for investigating medical diagnosis and its optimization, particularly in the area of mental health. ML allows for the automatic building of statistical and computational models that can automatically uncover hidden patterns in data. Numerous feature engineering approaches are also integrated with ML for optimal performance. But usually, these resource consuming approach results in increase of time complexity and may decrease in diagnosis accuracy. Therefore to mitigate these issues DL that have capability for end-to-end mechanism that maps raw input features through multi-layered network structure directly to output that have capability to find hidden patterns within the data. Convolutional neural networks (CNNs), autoencoders, recurrent neural networks (RNNs), and others are a few DL techniques. Figure 1 represents a general framework to show overview of ML or DL approaches for mental health diagnosis. The framework begins with raw medical data (EEG recordings), which are divided into training and testing sets. For the training set, features are extracted and processed through machine learning pipelines that include model training, cross-validation, and hyperparameter optimization to ensure robust performance. For the testing set, extracted features are used to evaluate the trained model. The block labeled “Model Optimization & Validation” (previously “Rules for Training”) refers to the processes of selecting training rules, adjusting parameters, and validating the model. The final results provide classification outcomes for mental illness detection.
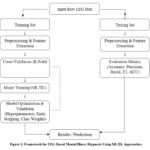 |
Figure 1: Framework for EEG-Based Mental Illness Diagnosis Using ML/DL Approaches. |
Mental Illness and EEG
Mental illnesses are a severe issue that must be addressed since they impair both the person and the environment’s emotional stability and security.2,7 A good person’s mental health permits him or her to develop all of his or her potential to the fullest extent possible.9 To avoid the emergence of a slew of mental problems, it’s analytical to diagnose psychiatric conditions as soon as possible, so the risk factors can be mitigated. Diagnosis is usually accomplished by identifying the indications of psychiatric abnormalities. The quality of early identification can indeed contribute to the knowledge and ability to understand of people’s psychological conditions when mental illnesses happen and can improve their treatment. Theoretically, diagnosing mental diseases can be learnt as a skill and practiced on a regular basis.9 The issue was that if the diagnostician was not very much skilled then it will take time while diagnosis or sometimes wrong diagnosis would be performed.1 In order to address these manual problems, machine learning turned out to be a better option. Machine learning tools for mental disease detection should be used in a manner comparable to that of a qualified physician when making a diagnosis.
Effects of Depression in Brain
There are two cerebral hemispheres in the human brain: the left hemisphere, which is in charge of analytical and logical cognition. the right hemisphere, which is in charge of intuition, imagination, and creativity.10,11 The right hemisphere is willing to take responsibility for the creative side of the mortal brain of human.
In each hemisphere, there are four lobes: the frontal, occipital, parietal, and temporal. The majority of studies have come to the conclusion that when the individual is in a resting condition, Depression primarily affects the frontal lobe or the region of the frontal lobe near the centre. On the other hand, brain activity occurs almost instantaneously—within milliseconds—allowing neural signals to reflect physical and cognitive processes with high temporal precision.¹¹,¹² While individuals may consciously misrepresent their experiences, EEG recordings provide objective measures of brain activity that cannot be easily manipulated or concealed.
There are three areas of the brain that are affected when someone has a mental illness:
The hippocampus is the part of the brain that is in charge of storing memories as well as regulating the production of the hormone cortisol. This portion of the brain resides in the temporal lobe. For example, if someone is depressed, a certain amount of cortisol is produced in his body and it is transferred to hippocampus that will slows down mental health.13
The prefrontal cortex, which is located on the frontal aspect of the frontal lobe, is the part of the brain that is in charge of the formation of memories, the regulation of emotions, and the selection of important options. When someone is depressed, an excessive amount of cortisol is produced within their brain, which causes the prefrontal cortex to diminish in size.13 This phenomenon is similar to that which occurs in the hippocampus.
Facilitating emotional responses is the responsibility of the amygdala, a region of the brain situated on the frontal portion of the temporal lobe.13
Different EEG Rhythms
Signals are a useful tool for improving recognition of the presence of depression biomarkers. As shown in figure 2, there are five frequency bands for EEG signal processing. These five frequency bands are presented in descending order, beginning with the highest frequency level to low frequency level. Figure 2: EEG Frequency Bands and Their Characteristics. The figure illustrates the five primary frequency bands of electroencephalogram (EEG) signals, each associated with distinct neural processes. Gamma (>35 Hz) waves are linked to higher-order cognitive functions such as perception, attention, and memory. Beta (12–35 Hz) waves are associated with active thinking, focus, and alertness. Alpha (8–12 Hz) waves represent a relaxed but alert mental state, often observed during rest with eyes closed. Theta (4–8 Hz) waves are connected to drowsiness, light sleep, and memory processing. Delta (0.5–4 Hz) waves dominate in deep sleep and restorative brain activity. The illustration shows representative waveforms of each frequency band, highlighting their relative amplitudes and oscillation rates.
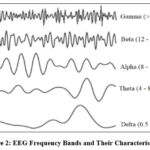 |
Figure 2: EEG Frequency Bands and Their Characteristics.14 |
Systematic review
To perform a systematic review, certain steps are followed as: a specified research topic, the selection of appropriate studies, an evaluation of the quality of those studies, and empirical studies with clearly stated results.15 We examined research articles indexed in IEEE Xplore, ScienceDirect, and Springer over the past 24 years (1999–2022). Figure 3 presents a bibliometric trend illustrating the number of published articles related to EEG-based mental illness detection during this period.
As shown in figure 3, the majority of the research on EEG-based mental disease identification has been done since 2011. Figure 4 presents the bibliometric analysis on the basis of type of article. We have listed every technique for preprocessing of signal, extraction of feature and selection, classification models supervision, and the accuracy discovered by it in order to carry out our search techniques.
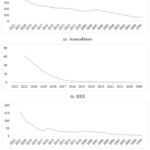 |
Figure 3: Research Article Publishing Trends by Year of Publication |
Using the checklists that PRISMA-P provides, there are a few steps that should be considered before creating a systematic review. These stages are as follows: Eligibility Criteria: The term “eligibility criteria” refers to the study methodology, timeline, and reporting standards, including restrictions on language and year of publication. For this systematic review, we included only articles written in English, published within the last 24 years, and belonging to one of four specified research fields.
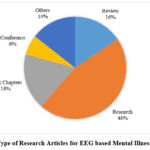 |
Figure 4: Type of Research Articles for EEG based Mental Illness Detection |
Table 1: Summary of Data Collection and Categorization of Articles Used in Bibliometric Analysis (1999–2022)
| Category | Number of Articles | Percentage | Primary Databases (Examples) | Representative References* |
| Research Articles | 88 | 46% | IEEE Xplore, ScienceDirect, Springer | Hasanzadeh et al., 2019; Saeedi et al., 2020; Li et al., 2019 |
| Review Papers | 30 | 16% | ScienceDirect, Springer | Arrieta et al., 2019; Galderisi et al., 2015 |
| Book Chapters | 34 | 18% | Springer, Elsevier | Wyatt-Smith et al., 2021 |
| Conference Papers | 12 | 6% | IEEE Xplore | Fan et al., 2021; Deng et al., 2019 |
| Others (Short notes, letters, reports, etc.) | 26 | 14% | Mixed sources (IEEE, ScienceDirect) | Cerdeña et al., 2020; Tan et al., 2020 |
| Total | 190 | 100% | — | — |
Relevant Information: For this review, research articles were collected from multiple academic databases and sources, including:
Springer – peer-reviewed journal articles and book chapters.
IEEE Xplore – conference proceedings and research papers.
ScienceDirect – journal articles across biomedical and computational domains.
Other Sources – selected high-impact journals and relevant reports from trusted publishers.
Search Strings Approach: Each study is reviewed before being included to a database supplies a set of keywords that others can use to find their research paper more quickly and easily. If, on the other hand, this search technique is able to conform to the predetermined restrictions or words of preference. Our search string is made up of words, and we use a Boolean operator to determine whether or not we want to include a certain word. The Boolean operator known as “AND” is used rather frequently. The following combinations of search phrases were used to get relevant articles for this article: “EEG” AND “Mental Illness” AND “Machine Learning,” and “EEG” AND “Mental Illness”, “Deep Learning”, and “EEG” AND “Mental Illness”.
Study Records
The study records section refers to three main phases: (1) data maintenance, (2) the selection process, and (3) data collection procedures. These phases ensure systematic management of retrieved articles. In our review, data management was carried out by establishing clear protocols for article screening, eligibility checks, and structured recording of results.The phases from the research methodology through the reporting of the results will be guided by the research questions (RQ). In order to have a better understanding of our primary objective, which is to examine the classification of different mental illnesses and the biomarkers that are associated with them, as well as an overview of the methodology that is associated with this topic.
When we talk about the selection process, we’re referring to the inclusion and exclusion criteria screening that takes place as we search for desired research papers in databases. During the preliminary search of each database, we may make an informed decision about whether or not a study is pertinent to the one we are reviewing by making use of Boolean operators. Through the use of the search string selection, we were able to organize 191 research articles taken from referred databases. In addition to these selection techniques, we discovered 54 items that are identical to one another and removed them from consideration during the screening of the first part. Because of the inclusion and exclusion criteria, another 32 articles have been removed from consideration for the second section screening. The entire search strategy is described in figure 5, which can be found here. Therefore, this paper has selected some major research contributions for mental illness detection using EEG signals and categorized them according to type of disease as discussed in below subsections. Finally, a comparative study of existing research feature is presented in table 1. Figure 5: Flow Diagram for Literature Review. The flow diagram illustrates the systematic selection process used in this study. Initially, 191 papers were identified from databases such as ScienceDirect, IEEE, and Springer. After removing 54 duplicate records and excluding 32 articles based on inclusion/exclusion criteria (e.g., language, publication year, and relevance to EEG-based mental illness detection), 105 papers remained. Of these, only 62 provided full-text access. Finally, 43 articles were selected for detailed literature review based on their methodological rigor, relevance to EEG signal-based mental illness detection, availability of sufficient experimental details (dataset, features, model), and contribution to at least one of the four focus areas (Major Depressive Disorder, ADHD, Schizophrenia, or Autism).
 |
Figure 5: Flow Diagram for Literature Review |
Research Contribution for EEG based Major Depression Disorder Detection
Major depressive disorder (MDD) patients are categorized as either responders (R) or non-responders (NR) to TMS treatment using a machine learning-based method. Power or Beta? performed remarkably well, classifying R and NR with 91.3% accuracy, 91.3% sensitivity, and 91.3% specificity, according to the data. machine learning using electroencephalography (EEG) to assess the coherence of EEG in order to (1) predict clinical outcomes in people with comorbid PTSD and MDD and (2) determine whether a person has finished a TMS course.16 The bands of Alpha, Beta, Theta, and Delta all had accuracy rates of 75.4 1.5%, 77.4 1.4%, 73.8 1.5%, and 78.6 1.4%, respectively, and all significantly outperformed chance (50%, p 0.001).
Using EEG-derived synchronization likelihood (SL) features as input data, a machine learning method is developed to automatically diagnose MDD. 17The results show that the model has an f-measure of 0.97, 98% accuracy, 99.9% sensitivity, and 95% specificity. An EEG-based deep learning system that distinguishes MDD patients from healthy controls axiomatically.18The deep learning model achieved an accuracy of 99.24%. However, it is important to note that the reported performance should be interpreted in the context of the dataset’s class distribution, which was not explicitly provided in the original study. Balanced datasets typically validate the robustness of such high accuracy, whereas skewed distributions may inflate the metric. Therefore, additional details on sensitivity, specificity, and class balance are essential to fully assess the reliability of this result.
Novel method for detecting depression in EEGs is proposed.19 The maximum task accuracy achieved by the deep learning method was 84.75%. A new computer algorithm for EEG-based depression screening (CNN) utilizing Convolutional Neural Networks, a type of deep neural network machine learning technique, is presented in this research.20 The method used EEG signals to achieve 93.5% and 96.0% accuracy. A machine learning method called a kernel SVM classifier was introduced, which used the characteristics of many cortical regions and frequency bands to determine whether individuals were at high risk for emotional problems.21 Its accuracy was 95.20 percent. Long-short-term memory (LSTM) is a deep learning model. The LSTM predictor model has been found to be the most effective for projecting depression trends.22
Research Contribution for EEG based Attention-deficit/hyperactivity Disorder Detection
With excellent accuracy, the suggested CAD system can identify ADHD using EEG data.23From raw EEG data, the suggested technique was able to extract pertinent spatial-temporal properties. A machine learning method to evaluate the power spectrum, bicoherence, complexity, and biomarker potential for identifying ADHD in children using resting-state EEG (rsEEG).24 The model’s accuracy rate is 84.59% created a unique method based on the combination of a few non-linear characteristics to distinguish children with ADHD from those learning normally.25 Experimental results indicated a specificity, sensitivity, and accuracy of 98, 92.31, and 96.05%, respectively, using a set of EEG data from 50 ADHD cases and 26 samples of normalcy. Using a CNN and an EEG-based brain network, it will present a DL framework for the detection of ADHD.26 With an accuracy of 94.67%, the proposed deep learning framework, which combined EEG-based brain network features with a convolutional neural network (CNN), demonstrated strong performance in distinguishing children diagnosed with ADHD from healthy controls [Ahmadi et al., 2020]. In addition, another study developed an artificial intelligence (AI) model specifically designed to identify ADHD patients using resting-state EEG features, achieving robust classification results with a reported accuracy of 91.3% [Chen et al., 2019]. These findings highlight the growing role of AI-based methods in supporting the early and objective diagnosis of ADHD.27 The technique produced the most accurate categorization, with a 91.3% accuracy rate.
Research Contribution for EEG based Schizophrenia Detection
In this study, a machine learning–based classifier was designed to improve schizophrenia detection by incorporating specific features extracted from EEG signals, thereby enhancing classification accuracy [Zhang, 2019].28 It is discovered that by including specific features taken from EEG signals, the classification accuracy can be increased. A transfer learning-based automatic technique using deep convolutional neural networks. results that are precise, specificity and sensitivity of 98.60% ± 2.29, 99.65% ± 2.35 and 96.92% ± 2.25, respectively.29 Using machine learning, forecast individual reactions to ECT in schizophrenia patients.30 Electroconvulsive Therapy (ECT) responders and no responders were distinguished using a prediction model developed using the Recursive Feature Selection (RSFS) approach with 85.3% balanced accuracy, 85.2% accuracy, 88.7% sensitivity, and 81.8% specificity. An empirical mode decomposition (EMD) methodological design for SZ diagnosis using EEG signals.31 The model achieves accuracy of 89.59%. By developing a quick, high-performance classification model, we were able to completely rule out schizophrenia.32 Treatments in ICUs can be carried out much more quickly, more precisely, and affordably by using this model in conjunction with a differential diagnosis system.
Research Contribution for EEG based Autism Detection
Psychiatric classification and, more generally, neuroscientific research can benefit from automated techniques that can analyze raw EEG waveforms, which further enhances the benefits of deep learning. Google Net, Squeeze Net, and pre-trained CNNs use the transfer learning technique to distinguish between people with ASD and normal controls based on their EEG data.34 SqueezeNet and Google’s neural networks produced accuracy rates of 75% and 82%, respectively. Convolutional Neural Network (CNN) and Electroencephalography (EEG) signals utilized for the detection of ASD.35 An accuracy of 0.922 was achieved using the proposed CNN. Brain EEG waves are categorized using a technique known as the discrete sine transform.36 An output was generated that classified the neurological illnesses of autism, epilepsy, and GDD after a testing input was applied to a network that had been trained on a particular dataset.37 The results indicate that a variety of neurological illnesses can be categorized using the suggested technique.
Table 2: Recent Research Contribution for Machine Learning based Mental Illness Detection
| Ref | Disorder | Model | Accuracy | Key Limitation |
| 15 | MDD | KNN | 91.3% | Beta bands only |
| 16 | MDD | SVM | ~78% | Small sample, no control |
| 17 | MDD | SL | 98% | – |
| 18 | MDD | CNN-LSTM | 99.24% | – |
| 19 | – | Ensemble DL | 84.75% | Not scalable |
| 20 | MDD | CNN | 95.49% | Needs more data |
| 21 | MDD | K-SVM | 95.2% | State influence not explored |
| 22 | MDD | LSTM | RMSE 0.005 | Not for large datasets |
| 23 | ADHD | DNN | 99.46% | Needs better validation |
| 24 | ADHD | SVM | 84.59% | Small sample |
| 25 | ADHD | SVM | 96.05% | Not scalable |
| 26 | ADHD | CNN | 94.67% | Needs more methods |
| 27 | ADHD | ML | 91.3% | More data needed |
| 28 | Schizophrenia | ML | 81% | Try ANN, larger dataset |
| 29 | Schizophrenia | ResNet18-SVM | 98.6% | – |
| 30 | Schizophrenia | RSFS | 85.2% | Lacks ECT response prediction |
| 31 | Schizophrenia | EMD | 89.6% | Poor tuning |
| 32 | Schizophrenia | RF (X-ray) | 101 ns (dead) | Lacks high-intensity accuracy |
| 33 | Schizophrenia | R-CNN | 89.98% | Complex due to participant heterogeneity |
| 34 | Autism | Deep CNN | 82% | Needs more data |
| 35 | Autism | 1D-CNN | 77.83% | High training time |
| 36 | Autism | DST | 80% | Not scalable |
| 37 | Neuro (Misc) | KNN & SVM | 78–82.5% | Subclass analysis needed |
Materials and Methods
The study mentioned in the previous section found that the convolution neural network is a contributing factor to the most popular model for mental illness based on EEG.38- 42 A multi-column CNN model for identifying illnesses based on EEG signals is provided in this paper.43 -45 Here, “multi-column” refers to the fact that signals are recorded from several EEG headset channels. The CNN recognition modules that make up the suggested framework are constructed of pooling and convolution layers that cascade.46,47 Figure 2 shows how a suggested module for identifying mental illnesses is constructed. Two conv-32 layers, following by a maxpooling layer, process the information. Two conv-64 layers are stacked after the max pooling layer. Figure 6 depicts the structure of CNN model.
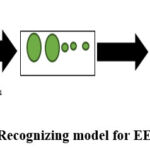 |
Figure 6: Recognizing model for EEG signal |
Four layers make up the model, as seen in figure 7, the input layer, the convolutional layer “Conv+ReLU+BN,” the fully connected layer, and the classifier. The pre-processed input is fed into the input layer as the feature map size grows from 32 to 64, and the convolution layer retrieves the features. In order to identify the signal as normal or abnormal, the fully connected layer adds classifiers after receiving the results from these convolution layers. Three fine-tuned learning models (FTLM) are prepared by changing the activation function.
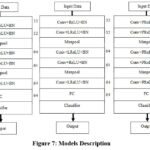 |
Figure 7: Models Description |
Data on mental illness was collected from the EEG dataset.48 (The sampled dataset’s EEG waves were used to extract features. To divide the entire dataset, training and testing samples are employed. The initial learning rate was set to 0.0001, selected after preliminary experimentation with different values (0.001, 0.0005, and 0.0001). A smaller rate (0.0001) provided more stable convergence with reduced overfitting compared to higher rates. During training, the learning rate was further reduced adaptively using a decay scheduler when validation loss plateaued. Other hyperparameters were optimized empirically, including a batch size of 32, ReLU as the activation function, Adam as the optimizer, and dropout (0.3) to prevent overfitting.
Results
Python libraries were used to implement the optimized learning models on an i5 processor with 16 GB of RAM and a 1 TB HDD. Kora’s libraries were used in the model’s creation. In this section, we have implemented three fine-tuned learning models such as FTLM-1, FTLM-2, and FTLM-3 and three transfer learning models (TLM) such as VGG19, ResNet50, and Mobile net.
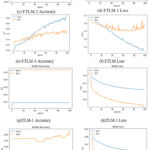 |
Figure 8: Performance of Training and Testing CNN Models |
Figure 8 (a) shows FTLM-1 50 accuracy of model the graph is plotted between model accuracy and epoch where the accuracy of training data increases up to 0.95 and the accuracy of the training data increases up to 0.95 and then stabilizes around 0.97, while the testing accuracy plateaus near 0.76. and then flocculates and goes at 0.76. Figure 8(b) shows FTLM-1 loss the graph is plotted between loss of model and epoch where data loss training 0.5 and data loss testing is 1.7. Figure 8(c) shows FTLM-2 accuracy of model the graph is plotted between model accuracy and epoch where the accuracy of training data increases up to 0.97 and for testing data the model accuracy reaches 0.76. Figure 8(d) shows FTLM-2 loss the graph is plotted between model loss and epoch where training data loss ranges from 0.5 and then flocculates at 1.76 and testing data loss is 0.75. Figure 8 (e) shows FTLM-3 accuracy of model the graph is plotted between model accuracy and epoch where the accuracy of training data increases from 0.60 then flocculates at 0.90 and for testing data the model accuracy starts from 0.65 and then flocculates at 0.70. Figure 8(f) shows FTLM-3 loss the graph is plotted between model loss and epoch where training data loss ranges from 0.7 and then flocculates at 0.99 and testing data loss ranges from 0.7 then flocculates at 0.6.Figure 8(g) shows TLM-1 accuracy of model the graph is plotted between model accuracy and epoch where the accuracy of training data increases from 0.61 then remains constant at at 98 and for testing data the model accuracy remains constant at 0.65.Figure 8(h) shows TLM-1 loss the graph is plotted between model loss and epoch where training data loss ranges from 0.70 and then reduces at 0.66 and testing data loss ranges from 0.67 then decreases at 0.66 and then flocculates at 99.Figure 8(i) shows TLM-2 accuracy of model the graph is plotted between model accuracy and epoch where the accuracy of training data increases at 0.61 and then remain constant at 0.40 epoch then then flocculates at 0.62 for testing data the model accuracy remains constant at 0.40 and then flocculates at 0.66. Figure 8(j) shows TLM-2 loss the graph is plotted between model loss and epoch where training data loss ranges at 0.69 and testing data loss is0.67.Figure 8(k) shows TLM-3 accuracy of model the graph is plotted between model accuracy and epoch where the accuracy of training data remain constant at 0.61and for testing data the model accuracy remains constant at 0.65.Figure 8(l) shows TLM-3 loss the graph is plotted between model loss and epoch where training data loss is 0.69 and testing data loss is 0.67.
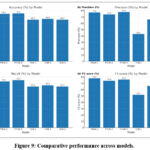 |
Figure 9: Comparative performance across models. |
Multi-panel view of (a) Accuracy (%), (b) Precision (%), (c) Recall (%), and (d) F1-score (%) for FTLM-1/2/3 and TLM-1/2/3 on EEG classification. Bars depict metric values in percent; FTLM-1 exhibits the most balanced performance across all metrics.
Table 3: Evaluation and Comparison of CNN Models
| Model | Learning | Accuracy | Precision | Recall | F1_score |
| FTLM-1 | Fine-tuned Learning | 77.5% | 77% | 78% | 78% |
| FTLM-2 | 74.5% | 74% | 73% | 74% | |
| FTLM-3 | 75% | 78% | 75% | 76% | |
| TLM-1 | Transfer Learning | 65.3% | 43% | 65% | 52% |
| TLM-2 | 66.6% | 66% | 67% | 66% | |
| TLM-3 | 65.32% | 43% | 65% | 52% |
Table 2 presents a comparative analysis of Convolutional Neural Network (CNN) models, specifically FTLM-1, FTLM-2, and FTLM-3 under Fine-Tuned Learning, and TLM-1, TLM-2, and TLM-3 under Transfer Learning. The fine-tuned models were trained using an openly available EEG dataset [Alexander et al., 2017], which includes multi-channel EEG recordings collected for transdiagnostic pediatric mental health research. Prior to training, signals were preprocessed with filtering, segmentation, and artifact removal, followed by feature extraction and normalization. Hyperparameters (learning rate, batch size, activation functions) were optimized using validation performance as the selection criterion. Among the fine-tuned models, FTLM-1 achieved the best results, with an F1-score of 78%, recall of 78%, and accuracy of 77.5%. This superior performance compared to the transfer learning models is likely because fine-tuning adapts the network weights more closely to EEG-specific patterns, rather than relying on generic visual features pre-trained on large-scale image datasets (e.g., ImageNet). EEG signals possess distinct temporal–spectral characteristics that differ from natural images, making task-specific fine-tuning better suited to capture relevant neural biomarkers of mental illness and precision of 77%, FTLM-1 performed best. FTLM-2 came in second with 74.5% accuracy, 74% precision, 73% recall, and 78% F1-score. FTLM-3 achieved 75% accuracy, 78% precision, 75% recall, and 76% F1-score. Conversely, the models for transfer learning showed poorer performance indicators. Recall was 65%, accuracy was 65.3%, precision was 43%, and F1-score was 52% for TLM-1. With an F1-score of 66%, recall of 67%, accuracy of 66.6%, and precision of 66%, TLM-2 did somewhat better. With an F1-score of 52%, recall of 65%, accuracy of 65.32%, and precision of 43%, TLM-3 performed similarly to TLM-1.
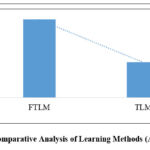 |
Figure 10: Comparative Analysis of Learning Methods (Accuracy %). |
The figure 10 compares the average accuracy of fine-tuned learning models (FTLM) and transfer learning models (TLM). FTLM achieves ~77.5% accuracy, while TLM reaches ~65%, indicating the superior performance of fine-tuned approaches for EEG-based mental illness detection.
Discussion
The experimental results show that the fine-tuned learning models (FTLM-1, FTLM-2, FTLM-3) outperform transfer learning models (TLM-1, TLM-2, TLM-3) systematically in EEG-based mental disorder detection. This difference in performance draws attention to domain-specific adaptation, particularly within neurodiagnostic contexts where EEG signals have highly discriminative temporal–spectral patterns. In contrast to natural images used for typical transfer learning models, EEG waveforms need domain-specific feature representations for they have subtle and non-linear patterns of neural activity that accompany mental disorders. Fine-tuned models were better at learning these domain-specific representations, which produced better classification accuracy, generalization, and reduced variance in loss curves.
The improvements in accuracy that were seen—about 12% better for FTLM models than for TLM—are of clinical relevance. In diagnostics for mental health, even slight improvements in accuracy can mean earlier and more consistent detection of conditions beneath, potentially allowing targeted treatment. FTLM-1 produced the most even results across precision, recall, and F1-score, which means that the model not only separates positive cases rightly but also reduces false negatives to a minimum, which is especially important in screening for mental health.
These results are in line with previous work highlighting the advantage of task-specific model fine-tuning for EEG-related applications in psychiatric illnesses like depression, ADHD, and schizophrenia. In contrast to generalized image-based transfer of features, fine-tuning enables neural networks to learn filters tailored to the morphology of EEG signals and consequently gain greater sensitivity towards region-specific brain region biomarkers. This supports the argument that EEG-specialized deep learning pipelines are superior to off-the-shelf pre-trained models for classification tasks in mental health.
Nonetheless, some constraints should be noted as well. EEG signals themselves are plagued by high inter- and intra-subject variability, which can decrease model generalizability across multi-site or cross-population analyses. Moreover, the dataset in this study might not reflect the entire range of demographic and clinical heterogeneity that characterizes real-world environments. More research is needed to increase the size of the dataset, implement cross-validation on independent cohorts, and test robustness in noisy clinical environments.
From the application standpoint, these findings highlight the promise of optimized deep learning methods as decision support systems for the screening of mental illness. When integrated with routine clinical evaluation, such models may assist in decreasing diagnostic delay, enhancing screening performance, and allowing for scalable deployment in low-resource healthcare environments. Future efforts need to be directed towards multimodal fusion of EEG with other biosignals, interpretable AI frameworks, and longitudinal modeling for improved clinical acceptability and interpretability.
Current Limitations and Challenges
Recently, mental health is diagnosed as one of the leading disabilities worldwide in major section of society. There are many input parameters that are presented above for diagnosis of mental health. But among all, the most unbiased information for supporting the mental health diagnosis is electroencephalography (EEG) features. Undeniably, EEG’s is one of the most useful biomarkers for mental health symptoms, simultaneously, it is also cost-effective and robust.49 Researchers assessed the discriminative power of features obtained from EEG for early detection of mental disorder. However, an issue with EEG features is that differences may occur in diagnosis depending on whether the signals are captured in a resting state or an active state. Apart from this, the EEG pattern varies among patients or even vary with different areas of brain in an individual patient. For early detection or preventive measures, the automatic detection process from EEG features may cause increased false alarm rate or high latency. Among all different methods, machine learning or deep learning shows competing expertise level in reading and analyzing EEG features. In past years many EEG‐based mental illness classification algorithms were adopted that used different approaches such as:
Features of EEG along with outliers and/or noise.
Classifier’s regularization, such as in Support Vector Machines (SVMs), which introduces a regularization parameter (commonly denoted as C) to control the trade-off between maximizing the margin and minimizing the classification error. This mechanism helps prevent overfitting by penalizing overly complex models and ensuring better generalization to unseen data
Usage of Discriminative classifiers.
EEG features with high dimensions.
Usage of Techniques for feature selection using dimensionality reduction.
EEG features with non‐stationarity.
Nevertheless, many discrepancies may still arise when handling non-linear EEG features across different types of mental illness. Because there are fewer patients from a single site, there has been a reported disparity in classification accuracy. Greater disease and control subject variance is attributed to the multi-site dataset, resulting in more generalized networks that may be duplicated across many locations, subjects, and research methods.
Conclusion
Mental disorder is notably the most common cause of disability. Mental illness that is left untreated can lead to serious psychological, behavioral, medical issues. The mental response of a human can be determined using machine learning algorithms and adequate signal processing on EEG readings. EEG recording is a non-invasive technique to capture brain signals. The brain’s electrical activity reflects an individual’s neurological status. EEG waveforms can clearly distinguish among natural and healthy brain function. This paper is dedicated to present a systematic review on analysis of patient’s EEG pattern using machine learning for treatment of mental illness that will help psychiatrists to treat patients more efficiently. This paper includes three fine-tuned learning models such as FTLM-1, FTLM-2, and FTLM-3 and three transfer learning models (TLM) such as VGG19, ResNet50, and Mobile Net. The performance of FTLM model is highest as compared to other models. Also shows comparative analysis of learning models for FTLM and TLM where FTLM have 75% which is higher than TLM which has 65% accuracy. In the future, more research investigation will be performed to reduce the complexity of handling EEG signals and differentiating other mental illnesses and their severity.
Acknowledgment
The authors would like to express their sincere gratitude to Maharaja Agrasen University, Baddi, Himachal Pradesh, and Jawaharlal Nehru University, New Delhi, for providing the necessary academic and research infrastructure to conduct this review. We are especially thankful to the faculty and peers whose critical insights and suggestions helped shape the direction of this study. We also appreciate the contributions of the research communities working in the field of EEG-based mental illness detection, whose work laid the foundation for this systematic review.
Funding Sources
The author(s) received no financial support for the research, authorship, and/or publication of this article
Conflict of Interest
The author(s) do not have any conflict of interest
Data Availability Statement
This statement does not apply to this article.
Ethics Statement
This research did not involve human participants, animal subjects, or any material that requires ethical approval.
Informed Consent Statement
This study did not involve human participants, and therefore, informed consent was not required.
Clinical Trial Registration
This research does not involve any clinical trials
Permission to reproduce material from other sources
Not applicable
Author Contributions
- Mohit Dayal: Conceptualization, Methodology Design, Literature Search and Screening, Initial Draft Preparation.
- Aparna N Mahajan: Data Analysis, Thematic Categorization, Visualization, Review and Editing.
- Manju Khari: Supervision, Critical Revisions, Validation of Findings, Final Manuscript Approval.
References
- Fan Y, Yu R, Li J, et.al. EEG-based mild depression recognition using multi-kernel convolutional and spatial-temporal Feature. 2021 IEEE International Conference on Bioinformatics and Biomedicine (BIBM). December 2020:1777-1784. doi:1109/bibm49941.2020.9313499
CrossRef - Das K, Pachori RB. Schizophrenia detection technique using multivariate iterative filtering and multichannel EEG signals. Biomedical Signal Processing and Control. 2021; 67:102525. doi:1016/j.bspc.2021.102525
CrossRef - Das K, Pachori RB. Schizophrenia detection technique using multivariate iterative filtering and multichannel EEG signals. Biomedical Signal Processing and Control. 2021; 67:102525. doi:1016/j.bspc.2021.102525
CrossRef - Cerdeña JP, Plaisime MV, Tsai J. From race-based to race-conscious medicine: how anti-racist uprisings call us to act. The Lancet. 2020;396(10257):1125-1128. doi:1016/s0140-6736(20)32076-6
CrossRef - Cassani R, Falk T. Alzheimer’s disease diagnosis and severity level detection based on electroencephalography modulation spectral “PATCH” features. IEEE Journal of Biomedical and Health Informatics. January 2019:1. doi:1109/jbhi.2019.2953475
CrossRef - Galderisi S, Heinz A, Kastrup M, et.al., Toward a new definition of mental health. World Psychiatry. 2015;14(2):231-233. doi:1002/wps.20231
CrossRef - Seal A, Bajpai R, Agnihotri J, et.al., O. DEPRNET: A Deep Convolution Neural network framework for detecting depression using EEG. IEEE Transactions on Instrumentation and Measurement. 2021; 70:1-13. doi:1109/tim.2021.3053999
CrossRef - Arrieta AB, Díaz-Rodríguez N, Del Ser J, et al. Explainable Artificial Intelligence (XAI): Concepts, taxonomies, opportunities and challenges toward responsible AI. Information Fusion. 2019; 58:82-115. doi:1016/j.inffus.2019.12.012
CrossRef - Sharma G, Parashar A, Joshi AM. DepHNN: A novel hybrid neural network for electroencephalogram (EEG)-based screening of depression. Biomedical Signal Processing and Control. 2021; 66:102393. doi:1016/j.bspc.2020.102393
CrossRef - Gainotti, G. Why are the right and left hemisphere conceptual representations different? Behavioural neurology, 2014(1), 603134.
CrossRef - Trifu, S. C., Trifu, A. C., Aluaş, E.,et.al. Brain changes in depression. Romanian Journal of Morphology and Embryology, 2020,61(2), 361.
CrossRef - Li M, Xu H, Lu S. Neural basis of depression related to a dominant right hemisphere: a Resting-State FMRI study. Behavioural Neurology. 2018; 2018:1-10. doi:1155/2018/5024520
CrossRef - Tan BYQ, Chew NWS, Lee GKH, et al. psychological impact of the COVID-19 pandemic on health care workers in Singapore. Annals of Internal Medicine. 2020;173(4):317-320. doi:7326/m20-1083
CrossRef - Wyatt-Smith C, Lingard B, Heck E. Digital disruption in teaching and testing.; 2021. doi:4324/9781003045793
CrossRef - Hasanzadeh F, Mohebbi M, Rostami R. Prediction of rTMS treatment response in major depressive disorder using machine learning techniques and nonlinear features of EEG signal. Journal of Affective Disorders. 2019; 256:132-142. doi:1016/j.jad.2019.05.070
CrossRef - Zandvakili A, Philip NS, Jones SR, et.al., Use of machine learning in predicting clinical response to transcranial magnetic stimulation in comorbid posttraumatic stress disorder and major depression: A resting state electroencephalography study. Journal of Affective Disorders. 2019; 252:47-54. doi:1016/j.jad.2019.03.077
CrossRef - Mumtaz W, Ali SSA, Yasin MAM, et.al., A machine learning framework involving EEG-based functional connectivity to diagnose major depressive disorder (MDD). Medical & Biological Engineering & Computing. 2017;56(2):233-246. doi:1007/s11517-017-1685-z
CrossRef - Saeedi A, Saeedi M, Maghsoudi A, et.al., Major depressive disorder diagnosis based on effective connectivity in EEG signals: a convolutional neural network and long short-term memory approach. Cognitive Neurodynamics. 2020;15(2):239-252. doi:1007/s11571-020-09619-0
CrossRef - Li X, Zhang X, Zhu J, et al. Depression recognition using machine learning methods with different feature generation strategies. Artificial Intelligence in Medicine. 2019; 99:101696. doi:1016/j.artmed.2019.07.004
CrossRef - Acharya UR, Oh SL, Hagiwara Y, et.al. Automated EEG-based screening of depression using deep convolutional neural network. Computer Methods and Programs in Biomedicine. 2018; 161:103-113. doi:1016/j.cmpb.2018.04.012
CrossRef - Deng Y, Wu F, Du L, et.al. EEG-Based identification of Latent Emotional Disorder using the Machine Learning approach. 2019 IEEE 3rd Information Technology, Networking, Electronic and Automation Control Conference (ITNEC). March 2019:2642-2648. doi:1109/itnec.2019.8729424
CrossRef - Kumar SD, Subha D. Prediction of Depression from EEG Signal Using Long Short Term Memory(LSTM). 2019 3rd International Conference on Trends in Electronics and Informatics (ICOEI). April 2019:1248-1253. doi:1109/icoei.2019.8862560
CrossRef - Ahmadi A, Kashefi M, Shahrokhi H, et.al. Computer aided diagnosis system using deep convolutional neural networks for ADHD subtypes. Biomedical Signal Processing and Control. 2020; 63:102227. doi:1016/j.bspc.2020.102227
CrossRef - Chen H, Chen W, Song Y, et.al. EEG characteristics of children with attention-deficit/hyperactivity disorder. Neuroscience. 2019; 406:444-456. doi:1016/j.neuroscience.2019.03.048
CrossRef - Boroujeni YK, Rastegari AA, Khodadadi H. Diagnosis of attention deficit hyperactivity disorder using non‐linear analysis of the EEG signal. IET Systems Biology. 2019;13(5):260-266. doi:1049/iet-syb.2018.5130
CrossRef - Altınkaynak M, Dolu N, Güven A, et al. Diagnosis of Attention Deficit Hyperactivity Disorder with combined time and frequency features. Journal of Applied Biomedicine. 2020;40(3):927-937. doi:1016/j.bbe.2020.04.006
CrossRef - Zhang L. EEG Signals Classification Using Machine Learning for The Identification and Diagnosis of Schizophrenia. Proceedings of the Annual International Conference of the IEEE Engineering in Medicine and Biology Society, EMBS. July 2019:4521-4524. doi:1109/embc.2019.8857946
CrossRef - Shalbaf A, Bagherzadeh S, Maghsoudi A. Transfer learning with deep convolutional neural network for automated detection of schizophrenia from EEG signals. Physical and Engineering Sciences in Medicine. 2020;43(4):1229-1239. doi:1007/s13246-020-00925-9
CrossRef - Min B, Kim M, Lee J, et al. Prediction of individual responses to electroconvulsive therapy in patients with schizophrenia: Machine learning analysis of resting-state electroencephalography. Schizophrenia Research. 2019; 216:147-153. doi:1016/j.schres.2019.12.012
CrossRef - Siuly S, Khare SK, Bajaj V, et.al. A computerized method for automatic detection of schizophrenia using EEG signals. IEEE Transactions on Neural Systems and Rehabilitation Engineering. 2020;28(11):2390-2400. doi:1109/tnsre.2020.3022715
CrossRef - Buettner R, Hirschmiller M, Schlosser K, et.al. High-performance exclusion of schizophrenia using a novel machine learning method on EEG data. 2019 IEEE International Conference on E-Health Networking, Application and Services, October 2019:1-6. doi:1109/healthcom46333.2019.9009437
CrossRef - Ahmedt-Aristizabal D, Fernando T, Denman S, et al. Identification of children at risk of schizophrenia via deep learning and EEG responses. IEEE Journal of Biomedical and Health Informatics. 2020;25(1):69-76. doi:1109/jbhi.2020.2984238
CrossRef - Mohi-Ud-Din Q, Jayanthy AK. Detection of Autism Spectrum Disorder from EEG signals using pre-trained deep convolution neural networks. Seventh International Conference on Bio Signals, Images, and Instrumentation (ICBSII), 2021. March 2021:1-5. doi:1109/icbsii51839.2021.9445193
CrossRef - Mohi-Ud-Din Q, Jayanthy AK. Autism Spectrum Disorder classification using EEG and 1D-CNN. 10th International Conference on Internet of Everything, Microwave Engineering, Communication and Networks (IEMECON. December 2021:01-05. doi:1109/iemecon53809.2021.9689100
CrossRef - Ganesh P, Menaka R. Use of Discrete Sine Transform in EEG signal classification for early Autism detection. IEEE International Conference on Advanced Communications, Control and Computing Technologies. May 2014:1507-1510. doi:1109/icaccct.2014.7019355
CrossRef - Begum D, Ravikumar KM, Vykuntaraju KN. An initiative to classify different neurological disorder in children using multichannel EEG signals. 2016 IEEE International Conference on Recent Trends in Electronics, Information & Communication Technology (RTEICT). May 2016:1563-1566. doi:1109/rteict.2016.7808095
CrossRef - Li X, La R, Wang Y, et al. EEG-based mild depression recognition using convolutional neural network. Medical & Biological Engineering & Computing. 2019;57(6):1341-1352. doi:1007/s11517-019-01959-2
CrossRef - Sharma G, Parashar A, Joshi AM. DepHNN: A novel hybrid neural network for electroencephalogram (EEG)-based screening of depression. Biomedical Signal Processing and Control. 2021; 66:102393. doi:1016/j.bspc.2020.102393
CrossRef - Zhu J, Jiang C, Chen J, et al. EEG based depression recognition using improved graph convolutional neural network. Computers in Biology and Medicine. 2022; 148:105815. doi:1016/j.compbiomed.2022.105815
CrossRef - Ko DW, Yang JJ. EEG-Based Schizophrenia Diagnosis through Time Series Image Conversion and Deep Learning. Electronics. 2022;11(14):2265. doi:3390/electronics11142265
CrossRef - Phang CR, Noman F, Hussain H, et.al. A Multi-Domain Connectome convolutional neural network for identifying schizophrenia from EEG connectivity patterns. IEEE Journal of Biomedical and Health Informatics. 2019;24(5):1333-1343. doi:1109/jbhi.2019.2941222
CrossRef - Wu X, Zheng WL, Li Z, et.al. Investigating EEG-based functional connectivity patterns for multimodal emotion recognition. Journal of Neural Engineering. 2022;19(1):016012. doi:1088/1741-2552/ac49a7
CrossRef - Sun Z, Huang Z, Duan F, et.al. A novel multimodal approach for hybrid Brain–Computer interface. IEEE Access. 2020; 8:89909-89918. doi:1109/access.2020.2994226
CrossRef - Wu X, Zheng WL, Li Z, et.al. Investigating EEG-based functional connectivity patterns for multimodal emotion recognition. Journal of Neural Engineering. 2022;19(1):016012. doi:1088/1741-2552/ac49a7
CrossRef - Gu J, Wang Z, Kuen J, et al. Recent advances in convolutional neural networks. Pattern Recognition. 2017; 77:354-377. doi:1016/j.patcog.2017.10.013
CrossRef - Albawi S, Mohammed TA, Al-Zawi S. Understanding of a convolutional neural network. 2017 International Conference on Engineering and Technology (ICET). August 2017:1-6. doi:1109/icengtechnol.2017.8308186
CrossRef - Alexander LM, Escalera J, Ai L, et al. An open resource for transdiagnostic research in pediatric mental health and learning disorders. Scientific Data. 2017;4(1). doi:1038/sdata.2017.181
CrossRef - Koch G, Casula EP, Bonnì S, et al. Precuneus magnetic stimulation for Alzheimer’s disease: a randomized, sham-controlled trial. Brain. 2022;145(11):3776-3786. doi:1093/brain/awac285
CrossRef - Akbari H, Ghofrani S, Zakalvand P, et.al. Schizophrenia recognition based on the phase space dynamic of EEG signals and graphical features. Biomedical Signal Processing and Control. 2021; 69:102917. doi:1016/j.bspc.2021.102917
CrossRef - Fu B, Chen SZ, Liu XR, Feng DC. A probabilistic bond strength model for corroded reinforced concrete based on weighted averaging of non-fine-tuned machine learning models. Construction and Building Materials. 2021;318:125767. doi:10.1016/j.conbuildmat.2021.125767
CrossRef

