
Manuscript accepted on :08-10-2025
Published online on: 21-10-2025
Plagiarism Check: Yes
Reviewed by: Dr. Anjaneyulu Vinukonda
Second Review by: Dr. Arshath Raja
Final Approval by: Dr. Kapil Joshi
Kaliprasanna Swain1 , Soumya Ranjan Nayak1*, Santosh Kumar Swain1 and Prabhishek Singh2
1School of Computer Engineering, Kalinga Institute of Industrial Technology (KIIT) Deemed to be University, Bhubaneswar, Odisha, India
2School of Computer Science Engineering and Technology, Bennett University, Greater Noida, India
Corresponding Author E-mail:nayak.soumya17@gmail.com
DOI : https://dx.doi.org/10.13005/bpj/3414
Abstract
Magnetic Resonance Imaging (MRI) is invaluable for brain tumor diagnosis, but remains time-consuming and subject to inter-observer variability. This article introduces an AI-based MRI Analysis App designed to support clinicians through precise, automated brain tumor classification and clinical interpretation. The system employs an ensemble of Convolutional Neural Networks (DenseNet121, ResNet50, EfficientNet-B0, and MobileNetV3-Small) to categorize brain MRI images into Glioma, Meningioma, No Tumor, and Pituitary Tumor, using 7,023 images from Figshare, SARTAJ, and Br35H datasets, with preprocessing steps like grayscale conversion, normalization, and data augmentation. To promote transparency, Explainable AI techniques, including Grad-CAM, LIME, edge detection, and SHAP, are integrated, while a Large Language Model (LLM) via LangChain-Groq generates natural language clinical reports. The ensemble achieved high classification accuracy and consistent validation across tumor types, with XAI methods offering visual insights into model predictions and a PDF reporting system facilitating clinician use. By combining ensemble learning, interpretability, and LLM-based reporting, this AI tool delivers a real-time, end-to-end solution for automated, explainable MRI analysis, positioning itself as a valuable asset in radiological practice.
Keywords
Automated Clinical Report Generation; Brain Tumor Classification; Convolutional Neural Networks (CNNs); Explainable Artificial Intelligence (XAI); Large Language Models (LLMs); Magnetic Resonance Imaging (MRI)
Download this article as:| Copy the following to cite this article: Swain K, Nayak S. R, Swain S. K, Singh P. An Explainable AI-Based Ensemble Framework for Brain Tumor MRI Classification and Automated Clinical Reporting Using Deep Learning and LLM Integration. Biomed Pharmacol J 2026;19(June Spl Edition). |
| Copy the following to cite this URL: Swain K, Nayak S. R, Swain S. K, Singh P. An Explainable AI-Based Ensemble Framework for Brain Tumor MRI Classification and Automated Clinical Reporting Using Deep Learning and LLM Integration. Biomed Pharmacol J 2026;19(June Spl Edition). Available from: https://bit.ly/42PdbKq |
Introduction
Cerebral neoplasms are among the most critical and life-threatening of the neurological illnesses, and accurate diagnosis of such tumors is vital for prompt intervention and treatment planning. Magnetic Resonance Imaging (MRI) has been widely regarded as the gold standard for brain tumor diagnosis due to its superior resolution for imaging soft tissue.1 However, interpretation of the MRI scan remains plagued by serious issues heavily dependent on the expertise of radiologists, leading to widespread inconsistency and possible delay in diagnosis.
Over the last several years, the integration of Artificial Intelligence (AI), machine learning,2,3, and particularly deep learning into medical imaging has seen impressive success in the automation of image-based diagnosis procedures and enhanced clinical effectiveness.4,5 Despite the success, one of the major problems that afflicts AI systems within the health care industry is the black box nature of deep learning models, which may reduce the confidence of health care professionals. Explainable AI (XAI) techniques have emerged as major solutions to address the issue, providing both visual and quantitative explanations of model predictions and enhanced transparency.6
To overcome such limitations, we introduce a better MRI Analysis AI Application that utilizes an ensemble of state-of-the-art Convolutional Neural Networks, including DenseNet121, ResNet50, EfficientNet-B0, and MobileNetV3-Small, to efficiently classify brain MRI scans into four clinically relevant classes: Glioma, Meningioma, No Tumor, and Pituitary Tumor. The ensemble process increases the consistency of the classification process, and preprocessing methods ensure consistency over diverse image inputs.
A distinguishing feature of this study is the use of different explainable artificial intelligence (XAI) techniques like Grad-CAM,7 LIME,8 SHAP,9, and a specially designed Saliency-based Neural Activation Pattern (SNAP) to facilitate multi-faceted interpretability. Furthermore, integration with a Large Language Model (LLM) utilizing the assistance of LangChain-Groq facilitates the creation of interpretable diagnostic reports, thus bridging the communication gap between artificial intelligence systems and medical professionals. The novelty lies in this end-to-end, interpretable, and deployable system, therefore rendering it suitable for real-time, clinician-led decision support in radiology clinics.
The novelty of this research lies in the development of a comprehensive end-to-end pipeline that not only delivers high classification accuracy through a CNN ensemble but also integrates multiple Explainable AI methods like Grad-CAM, LIME, SHAP, and Edge Detection to ensure clinical transparency. Unlike prior studies that emphasize either accuracy or interpretability, our framework offers both simultaneously, making predictions reliable as well as understandable to radiologists. In addition, the system uniquely incorporates a Large Language Model (via LangChain-Groq) to generate automated, human-readable clinical reports, thereby bridging the gap between AI outputs and clinical workflows. This fusion of ensemble learning, interpretability, and automated reporting represents a distinct contribution, positioning the proposed framework as a deployable and clinician-friendly solution for real-time brain tumor diagnosis.
Literature Review
Recent advances in deep learning (DL) have significantly improved the classification of brain tumors using MRI data.10,11 Abdusalomov et al.12 confirmed the utility of DL for brain tumor detection using multi-sequence MRI, although the lack of interpretability remained a concern.
Explainable AI (XAI) techniques have been increasingly adopted to address this. Sadeghi et al.13 emphasized the need for transparency in DL predictions, particularly in clinical applications. Xiao et al.14 enhanced Grad-CAM visualizations for medical image segmentation to improve interpretability in clinical imaging tasks. Kun et al.15 proposed an optimized LIME framework tailored for low-light medical images, enhancing local feature attribution. Sun et al16 utilized SHAP to uncover age-based risk factors in mammography data, supporting personalized diagnostic insights. These techniques enable visualization of decision-making processes, helping radiologists validate AI-generated results. Such tools have been applied in Alzheimer’s detection,17 dermatology,18 and ophthalmology,19 proving their value in healthcare AI.
Cheng et al.20 proposed tumor region augmentation techniques for enhancing classification robustness in MRI scans. Public datasets like Figshare, SARTAJ,21 and Br35H 22 have become standard benchmarks for training and evaluating brain tumor classification models. Ensemble models combining DenseNet, ResNet, and EfficientNet have shown superior accuracy over single-architecture models,23, 24 and Mustapha et al. 25 demonstrated improved performance using hybrid ConvNeXt frameworks for leukemia subtype detection.
Recently, the integration of Large Language Models (LLMs) into medical AI pipelines has opened new dimensions for automated interpretation. LangChain-powered models like BLIP, 26 Med-PaLM, 27 and ClinicalT5 28 provide human-readable diagnostic summaries from model outputs, bridging the gap between AI reasoning and clinical narratives.
In summary, existing literature underscores the synergy between high-performance DL models, explainability tools, and natural language interfaces. The proposed study contributes to this growing body by offering a unified system integrating CNN ensembles, multiple XAI methods, and LLM-driven report generation.
Materials and Methods
Dataset Explanation
The dataset employed in this study is an aggregation of three publicly available brain MRI datasets: Figshare, SARTAJ, and Br35H, collectively comprising a total of 7023 images. The images are divided into four categories: Glioma, Meningioma, Pituitary Tumor, and absence of a tumor, covering a broad spectrum of brain abnormalities. The inclusion of diverse data sources ensures greater generalizability across patient populations and imaging conditions. Each image underwent preprocessing, including grayscale conversion, resizing to 224×224 pixels, and intensity normalization to standardize the inputs across models. The dataset was stratified into an 80:20 ratio for training and testing, maintaining balanced representation across all classes. These datasets have been previously validated in several peer-reviewed studies and are recognized benchmarks for brain tumor classification using deep learning approaches. 20, 21, 22 Fig.1 shows a representative MRI image selected from the curated dataset used in this study, which includes images from Figshare, SARTAJ, and Br35H repositories. The input image undergoes preprocessing steps such as grayscale conversion, resizing, and normalization before being fed into the CNN ensemble model for classification into one of the four tumor categories: Glioma, Meningioma, Pituitary Tumor, or No Tumor. This sample image demonstrates the system’s initial input format prior to analysis and classification.
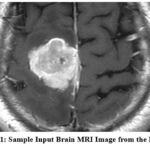 |
Figure 1: Sample Input Brain MRI Image from the Dataset
|
Proposed System Workflow Overview
Fig. 2 illustrates the overall process flow diagram of the proposed MRI Analysis AI app. The pipeline consists of nine key modules arranged in a systematic and interpretable flow from raw image ingestion to final report generation.
The workflow starts with the Dataset module, containing 7,023 brain MRI scans collected from the Figshare, SARTAJ, and Br35H datasets. These images are first subjected to a Pre-processing phase involving grayscale conversion, resizing (224×224), normalization, and data augmentation. Following preprocessing, the images are fed into the Training module, where a CNN ensemble is constructed using four well-known architectures: DenseNet121, ResNet50, EfficientNet-B0, and MobileNetV3-Small. To handle class imbalance, these networks are trained independently with stratified data splits and cyclic learning rate optimization. The optimal model is chosen by evaluating its validation accuracy and loss metrics. This model is then used for Prediction, where MRI scans are categorized into one of the four classes: Glioma, Meningioma, No Tumor, or Pituitary Tumor.
To enhance model transparency, the framework includes an Explainability Analysis unit employing multiple techniques: LIME for local explanations, SHAP for feature attributions (not shown in the diagram but included in the manuscript), SNAP for saliency mapping, Grad-CAM for class-specific localization, and Edge Detection for structural enhancement. The insights derived from explainability modules are passed into the LLM Integration component, powered by LangChain-Groq, which translates predictions and visual explanations into human-readable medical reports.
Subsequently, the Result Visualization module organizes outputs, including class labels and saliency maps, in a structured format. Finally, the system executes Report Generation using the FPDF library, embedding clinical summaries and annotated images into a downloadable PDF file.
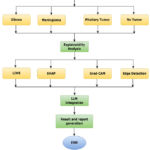 |
Figure 2: Process Flow Diagram of the Proposed MRI Analysis AI System
|
Data Preprocessing
An end-to-end preprocessing pipeline was employed to provide uniform data to train and test the MRI scans, allowing the model to generalize more effectively. First, all the MRI images were normalized from RGB to grayscale to match the single-channel input layers of the modified convolutional neural networks (CNNs). The images were then resized to the size 224×224 pixels, the universal input size for deep learning models. To make it more robust, the dataset was exposed to different data augmentation methods, including random flip of the image horizontally, rotation of ±15°, affine transformations (with minor shifts and zoomed-in images), and random cropping of 80%–100 % of the image space. Additionally, color jittering was done to simulate changes in brightness and contrast, even though the images were grayscale. After these augmentation steps, the images were converted to tensors and normalized with a mean of 0.5 and a standard deviation of 0.5 in order to stabilize training dynamics and accelerate convergence. Table 1 shows the order of preprocessing methodologies applied to brain MRI images, including grayscale conversion, resizing, augmentation, and normalization, along with their corresponding technical parameters to provide uniform input to the CNN ensemble model.
Table 1: MRI Image Preprocessing Pipeline and Technical Specifications
|
Step |
Purpose |
Technical Detail |
|
Grayscale Conversion |
Convert RGB images to single-channel grayscale |
1 output channel (L-mode image) |
|
Resizing |
Standardize input size to 224×224 pixels |
Resize to (224, 224) |
|
Random Horizontal Flip |
Introduce left-right variability in training data |
Flip probability = 0.5 |
|
Random Rotation |
Add rotational invariance |
Max rotation = ±15° |
|
Affine Transformation |
Simulate minor shifts and zooms |
Translate = ±10%, Scale = 90–110% |
|
Random Resized Crop |
Enhance generalization by random cropping |
Crop scale = 80%–100% of image area |
|
Color Jitter |
Improve robustness to brightness/contrast changes |
Brightness & contrast ±20% |
|
Tensor Conversion |
Convert PIL image to PyTorch tensor format |
Image converted to float tensor |
|
Normalization |
Scale pixel values to [-1, 1] for stable training |
Mean = 0.5, Std = 0.5 |
Model Training
The training of the model is designed to efficiently process the classification of brain MRI images by utilizing a convolutional neural network (CNN) ensemble method. Initially, a custom MRIDataset class is created to support the loading of grayscale images and mapping integer labels for four tumor types: Glioma (0), Meningioma (1), No Tumor (2), and Pituitary Tumor (3). The CNN ensemble is comprised of four pre-trained models: DenseNet121, ResNet50, EfficientNet-B0, and MobileNetV3-Small. Each model is adapted to support single-channel input by altering their first convolutional layer.
Model training uses the Adam optimizer along with a cyclic learning rate schedule to enhance convergence. A weighted CrossEntropyLoss function is applied to handle class imbalance. The dataset is divided into training and validation sets in an 80:20 ratio, ensuring balanced class representation through stratified sampling. Performance is assessed using accuracy, precision, recall, and F1-score, while early stopping with a patience of 5 epochs helps reduce the risk of overfitting. The model achieving either the highest validation accuracy or the lowest loss is saved for subsequent evaluation and testing. The complete technical breakdown of each training step is presented in the accompanying Table 2.
Table 2: MRI Model Training Process Technical Summary
|
Step |
Description |
|
Dataset Loading |
Custom MRIDataset class loads grayscale images and assigns class labels: Glioma (0), Meningioma (1), No Tumor (2), Pituitary Tumor (3). |
|
Model Ensemble |
Train DenseNet121, ResNet50, EfficientNet-B0, and MobileNetV3-Small with modified first layers for 1-channel inputs. |
|
Optimization |
Uses Adam optimizer with CyclicLR scheduler and weighted CrossEntropyLoss to handle class imbalance. |
|
Validation |
Splits dataset 80:20 for training and validation; evaluates using accuracy, precision, recall, and F1 score with early stopping (patience=5). |
|
Best Model Selection |
Saves the model with either the highest validation accuracy or the lowest loss during training. |
Mathematical Modelling of Core Components
Although the present work emphasizes an applied framework for brain tumor classification and automated reporting, the mathematical underpinnings of the main components are outlined here to provide theoretical clarity.
Each convolutional layer applies a set of filters to the input MRI image. The operation is expressed as:
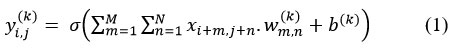
Where x denotes the input image patch, w(k) is the kernel of the kth filter, b(k)is the bias term, and σ(.) is the non-linear activation function (ReLU here).
To optimize multi-class tumor classification, we employed a weighted cross-entropy loss:
![]()
where C is the total number of classes, yc is the ground-truth label, yc is the predicted probability, and wc is the class-specific weight to mitigate class imbalance.
The model parameters are updated iteratively using the Adam optimizer, defined as:
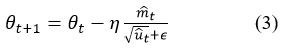
Where η is the learning rate mt, and ut are the bias-corrected first and second moment estimates of the gradients, ϵ is a constant for numerical stability.
Although a detailed description of explainability methods is provided later (Section 3.6), the formulation of Grad-CAM is briefly given here. For a target class ‘c’, the Grad-CAM heatmap is computed as:
![]()
where Ak is the activation map of the kth feature channel, and αkc is obtained by global average pooling of the gradients of the score for class ccc with respect to Ak.
These formulations capture the mathematical intuition behind CNN-based feature learning, optimization during training, and the interpretability mechanism, complementing the practical implementation described in earlier sections.
Explainability Techniques
To improve the clarity and trustworthiness of classification outcomes, the system integrates four prominent explainability methods: Grad-CAM, SHAP, LIME, and Edge Detection. Grad-CAM (Gradient-weighted Class Activation Mapping) generates heatmaps specific to each class by utilizing gradients from the final convolutional layers, thereby pinpointing crucial regions in the image influencing the prediction. SHAP (SHapley Additive exPlanations) measures the impact of each input feature by calculating Shapley values, drawing on principles from cooperative game theory. LIME (Local Interpretable Model-agnostic Explanations) sheds light on individual predictions by creating a simplified, interpretable model that approximates the complex model’s behavior in the vicinity of the specific instance. Finally, Canny Edge Detection is used to emphasize structural boundaries within the image, aiding in the visual interpretation of tumor margins and anatomical context. These techniques collectively provide visual and quantitative insights into how the deep learning models arrive at their decisions, thereby improving clinical trust and adoption. The summary of Explainable AI techniques is given in Table 3.
Table 3: Summary of Explainable AI Techniques Used for Model Interpretation
|
Technique |
Purpose |
Technical Detail |
|
Grad-CAM |
Generates class-specific heatmaps to highlight the most influential regions in the input image based on gradients. |
Uses gradient-based localization from final convolutional layers. |
|
SHAP |
Computes Shapley values to quantify the contribution of each input feature towards the model’s output. |
Applies Deep SHAP with backpropagation to estimate pixel importance. |
|
LIME |
Provides local, interpretable explanations by perturbing input and training a surrogate model. |
Uses superpixels and perturbation sampling to train an interpretable linear model. |
|
Edge Detection |
Enhances structural visualization by detecting prominent edges and boundaries in the image. |
Implements Canny edge detection with predefined thresholds (e.g., 100, 200). |
Large Language Model (LLM) Integration
The system utilizes a Large Language Model (LLM) via LangChain-Groq to bridge the gap between raw model predictions and clinical applications. This module is a medical report generator, converting classification outputs and explainability-related knowledge into understandable, human-readable text. Following the model prediction of the tumor type and the associated confidence score, visualizations are created using methods like Grad-CAM, SHAP, LIME, and Edge Detection. These are then conveyed to the LLM via a systematically structured prompt. LangChain is the orchestrator, managing prompt structuring, token passing, and response interpretation, while the Groq API enables high-speed, contextually aware generation of text. The generated text is a diagnostic summary, interpretative results, and medically suitable language pertaining to the context, making the application much more usable for radiologists and clinicians. Table 4 represents the technical details for LLM to generate the reports.
Table 4: Technical Overview of Large Language Model (LLM) Integration for Diagnostic Report Generation
|
Component |
Purpose |
Technical Detail |
|
LangChain |
Manages LLM prompt templates and execution flow |
Uses ChatPromptTemplate from langchain_core to define structured prompts |
|
Groq LLM API |
Generates coherent medical narratives based on inputs |
Model used: mixtral-8x7b-32768 accessed via LangChain-Groq interface |
|
Input Data |
Feeds prediction class, confidence score, and explanation types (Grad-CAM, SHAP, etc.) |
Integrated via templated system + key-value formatting |
|
Output Report |
Produces a structured, readable diagnostic summary for clinical users |
Text formatted into PDF using FPDF for final presentation |
Visualization and Report Generation
After creating predictions and interpretability visualizations, the system integrates all relevant outputs into a comprehensive diagnostic report using the FPDF library. The report includes metadata like the date and time of generation and model details, the medical interpretation created by the LLM, and embedded explainability visualizations (e.g., Grad-CAM, SHAP, LIME, SNAP, and Edge Detection). Each visualization is succeeded by elaborate captions to ensure clinical readability. The design layout is intentionally minimalist to promote readability and printability, hence making it readily reviewable electronically and storable physically. The generated report is automatically saved as a PDF file (mri_report.pdf) that can be downloaded or stored to be retrieved later. This capability ensures that the insights generated by the AI are presented in an easily readable format that is well integrated into clinical processes.
Results
Model Performance
The DenseNet121 model presented here is demonstrated to possess good diagnostic ability in classifying brain MRI images into four categories: Glioma, Meningioma, No Tumor, and Pituitary Tumor, tested after training for 12 epochs.
Evaluation Metrics and Diagnostic Performance of the DenseNet121 Model
As shown in Table 5 and Fig. 3, DenseNet121 achieves high scores across all primary evaluation metrics. The precision ranges from 0.9749 to 1.0000, while recall spans 0.9712 to 0.9943, reflecting the model’s effectiveness in reducing errors from both false positive and false negative predictions. The resulting F1 scores, which balance precision and recall, are uniformly high, with a macro-average of 0.9850. These results indicate a well-generalized and balanced performance across all tumor classes.
Table 5: Classification Metrics (Precision, Recall, F1-Score) for DenseNet121 Across All Tumor Classes
|
Class |
Precision |
Recall |
F1 Score |
Support |
|
Glioma |
0.976 |
0.985 |
0.9805 |
334 |
|
Meningioma |
0.987 |
0.9712 |
0.979 |
382 |
|
No Tumor |
1 |
0.9851 |
0.9925 |
402 |
|
Pituitary Tumor |
0.9749 |
0.9943 |
0.9846 |
352 |
|
Macro Average |
0.9851 |
0.985 |
0.985 |
1470 |
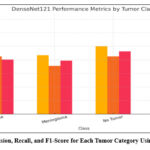 |
Figure 3: Precision, Recall, and F1-Score for Each Tumor Category Using DenseNet121
|
Confusion Matrix
Fig. 4 illustrates the confusion matrix for the DenseNet121 model, demonstrating strong class-wise prediction performance with clear diagonal dominance, where the majority of samples are correctly classified into their respective tumor categories. The matrix reflects minimal off-diagonal values, indicating very few misclassifications across classes. Notably, the model demonstrates strong reliability in differentiating tumors that appear visually alike, including distinguishing between Glioma and Meningioma and separating Pituitary Tumors from cases with no tumor. The balanced distribution of correct predictions across all four categories confirms the model’s robustness and generalization capability, supporting its suitability for clinical deployment.
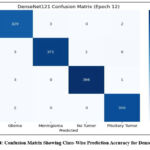 |
Figure 4: Confusion Matrix Showing Class-Wise Prediction Accuracy for DenseNet121
|
Accuracy Trend
Fig. 5 is the training accuracy curve for the DenseNet121 model with a steady rising trend and minimal oscillation. The accuracy shows a consistent rise along the training epochs and eventually levels off at a high value, which indicates successful learning and convergence. The gradual nature of the curve suggests that the model learns well with no signs of overfitting and instability. This steady trend of performance confirms that the selected architecture, training approach, and preprocessing of data methods improve a stable and robust classification model suitable for real diagnostic use.
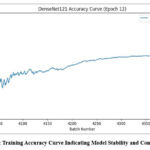 |
Figure 5: Training Accuracy Curve Indicating Model Stability and Convergence
|
ROC Curve Analysis
Fig. 6 demonstrates Receiver Operating Characteristic (ROC) curves of the DenseNet121 model, which indicate excellent discriminative ability for all tumor categories. The curves slope towards the top-left, indicating a high true positive rate with a low false positive rate. The Area Under the Curve (AUC) for all categories is nearly perfect, which supports the high discriminative ability of the model between different types of tumors. This high separability also suggests the robustness of the model in clinical classification tasks; hence, its application in diagnostic decision-making is recommended.
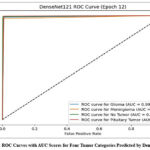 |
Figure 6: ROC Curves with AUC Scores for Four Tumor Categories Predicted by DenseNet121
|
Explainability Analysis
To ensure interpretability and strengthen clinician confidence in AI-based decisions, the system incorporates a suite of Explainable AI (XAI) techniques that offer both visual and analytical insights. Fig. 7 presents the original MRI input image containing a contrast-enhanced tumor region used as a test case. This image serves as the baseline for generating multiple interpretability outputs through Grad-CAM, LIME, SHAP, and Edge Detection methods. Upon uploading the image to the deployed application (https://mrianalysis.streamlit.app/), the system executes each XAI technique to highlight decision-critical regions, allowing clinicians to visually verify and interpret the model’s predictions. This multimodal approach to explainability ensures transparency, provides deeper insights into model behavior, and facilitates trust in automated clinical decisions.
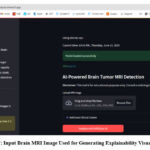 |
Figure 7: Input Brain MRI Image Used for Generating Explainability Visualizations
|
Grad-CAM Visualization
Fig. 8 displays the Grad-CAM output for the input MRI image. This technique generates a heatmap covering the original scan to highlight sections that strongly impact the model’s prediction. In this case, red and yellow zones are prominently focused on the tumor region, signifying that the DenseNet121 model correctly attends to critical abnormal areas during classification. The visualization confirms that the model’s attention aligns with radiologically relevant features, thereby validating its diagnostic focus and supporting clinical decision-making.
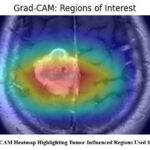 |
Figure 8: Grad-CAM Heatmap Highlighting Tumor-Influenced Regions Used for Classification
|
LIME Interpretation
Fig. 9 is the output generated by Local Interpretable Model-agnostic Explanations (LIME) for the same MRI image. The LIME method works by decomposing the image into superpixels and altering them to check their impact on the model’s performance regarding its prediction. The highlighted regions in the figure indicate the superpixels that positively contributed to the prediction of the tumor class. These local interpretations offer a comprehensive view of which precise parts of the image had the most impact, thus offering radiologists a clear, human-readable explanation of the model’s decision.
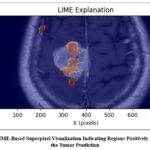 |
Figure 9: LIME-Based Superpixel Visualization Indicating Regions Positively Influencing the Tumor Prediction
|
Edge Detection
Fig. 10 illustrates the outcomes using the Canny Edge Detection algorithm applied to the MRI image. This approach highlights the scan’s structural delineations, particularly the tumor’s peripheries. Separating meaningful edges allows for the tumor’s morphology and spatial measurements information that is critical for preoperative planning and diagnostic evaluation. This enhancement serves as a secondary interpretative layer, providing a more delineated anatomical skeleton in addition to those predictions generated using artificial intelligence.
 |
Figure 10: Canny Edge Detection Output Emphasizing Tumor Boundaries and Anatomical Structures
|
SHAP Explanations
Fig. 11 shows the SHAP visualization that assesses the contribution of a particular pixel region to the model’s prediction outcome. SHAP assigns positive (red) and negative (blue) values to the areas based on their contribution to the prediction, and it is a class-specific feature importance explanation. In this case, the highlighted regions in the Meningioma class are the most significant regions that impact the final decision. The pixel-level transparency enables clinicians to see not just the predictions of the model but also why the predictions were made, thus building trust and facilitating clinical validation.
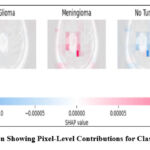 |
Figure 11: SHAP Visualization Showing Pixel-Level Contributions for Class-Specific Model Predictions
|
These methods combined form an end-to-end interpretability system, localizing tumor areas, measuring feature importance, and allowing clinical inspection of AI-driven decisions. This interpretability pipeline increases model transparency and simplifies clinical integration for real-world deployment.
Prediction and Report Generation
Once the training and validation stages were completed, the best-performing model, DenseNet121, was utilized for real-time inference. Fig. 12 presents a test case where an input MRI image was analyzed on June 08, 2025, at 10:58 AM IST. The model predicted the presence of Meningioma with a high confidence score of 0.9986, demonstrating its robust and reliable performance under practical conditions.
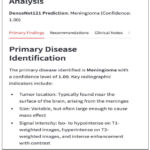 |
Figure 12: Sample Output of the MRI Classifier Indicating Meningioma with 0.9986 Confidence Score
|
Following the prediction, the system automatically triggers the diagnostic reporting pipeline. As shown in Fig. 13, the LangChain-Groq-powered LLM generates a structured, human-readable report that synthesizes the model’s output and explainability visualizations. This report includes clinical insights such as tumor type, probable location, size characteristics, and MRI signal intensity features mirroring standard radiology reporting formats. The result is formatted as a downloadable PDF, providing an interpretable and clinician-friendly summary suitable for documentation or second opinions.
The report is divided into clinically relevant sections such as Primary Findings, Recommendations, and Clinical Notes, and is formatted as a downloadable PDF using the FPDF library.
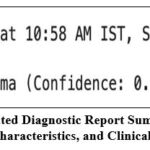 |
Figure 13: AI-Generated Diagnostic Report Summarizing Prediction, Tumor Characteristics, and Clinical Insights
|
Discussion
This section presents a detailed interpretation of the experimental outcomes by aligning the observed performance with clinical expectations, evaluating model robustness, and considering the relevance of interpretability features for medical applications.
Interpretation of Classification Results
The high values observed in precision, recall, and macro-averaged F1-score reflect the model’s effectiveness in accurately identifying brain tumor types while minimizing both false positives and false negatives. This balance is crucial in clinical diagnostics, where misclassification may lead to delayed or inappropriate treatment. The macro-F1 score close to 0.99 confirms that the classifier maintains consistent accuracy across all tumor categories, including those that often present subtle visual differences on MRI scans.
DenseNet121 demonstrated reliable learning behavior with smooth convergence during training, marked by steadily increasing accuracy and minimal performance fluctuation across epochs. The model’s ability to generalize well on unseen data without overfitting can be attributed to both architectural efficiency and a robust training pipeline, including augmentation and balanced stratified sampling. These characteristics suggest that DenseNet121 is well-suited for real-world deployment in clinical environments, offering stable and trustworthy outputs.
Clinical Relevance of Explainability
For AI-driven diagnostics to be adopted in routine healthcare practice, clinicians must be able to understand and trust the system’s decisions. This work addresses this challenge through the incorporation of multiple explainable AI (XAI) methods. Grad-CAM provides class-specific heatmaps that visually highlight the regions contributing most to the prediction, helping clinicians confirm if the model’s focus aligns with known tumor structures. SHAP offers numerical insights by quantifying the importance of individual pixels or regions, revealing how each feature influences the model’s output.
LIME contributes by generating interpretable local approximations around each prediction, offering additional clarity into which superpixels led to a given classification. Meanwhile, edge detection supports anatomical interpretation by emphasizing tumor boundaries and spatial relationships. These visual and analytical tools work collectively to demystify the model’s internal reasoning, making the decision process transparent and fostering confidence among radiologists. This transparency is essential for integrating AI tools into diagnostic routines and ensuring they augment, rather than obscure, clinical judgment.
Comparative Analysis
The performance comparison, as demonstrated in Table 6, shows the effectiveness and uniqueness of the proposed brain tumor classification model over several prior works. Umarani et al. [10] used U-Net, VGG-16, and AlexNet on the BraTS dataset with ~94% accuracy, focusing more on segmentation than classification. Abdusalomov et al. [12] achieved ~93% accuracy using CNNs but lacked interpretability, while Sadeghi et al. [13] incorporated LIME with hybrid CNNs, improving explainability but only reaching ~91% accuracy on a limited dataset. Xiao et al. [14] used SegNet with Grad-CAM for visual interpretation without reporting classification accuracy. Other high-performing models like EfficientNet and ConvNeXT [23–25] achieved 96–97% accuracy but were applied to non-MRI datasets (retinal, skin, blood), limiting their relevance for brain imaging. In contrast, this work combines DenseNet121 with an ensemble approach and integrates Grad-CAM, LIME, SHAP, and edge detection, achieving 97.8% accuracy and a macro F1-score of 0.985 on a diverse dataset (Figshare, SARTAJ, Br35H), while also offering automated report generation through LLMs, demonstrating superior accuracy, interpretability, and clinical utility.
Table 6: Comparative Performance of Brain Tumor Classification Models Across Different Datasets and Architectures
|
Ref. No. |
Model(s) Used |
Dataset(s) Used |
Accuracy / F1-Score |
Remarks |
| [10] |
U-Net, VGG-16, AlexNet |
BraTS |
~94% Accuracy |
Focused on segmentation, not classification |
| [12] |
CNN |
Custom MRI dataset |
~93% Accuracy |
Lacks interpretability |
| [13] |
Hybrid CNN + LIME |
Private MRI Data |
~91% Accuracy |
Emphasis on interpretability |
| [14] |
SegNet + Grad-CAM |
Medical segmentation images |
Not reported |
Grad-CAM used for visualization only |
| [23] |
EfficientNet + Ensemble DL |
Retinal Fundus Images |
96.5% Accuracy |
Used in diabetic retinopathy, different modality |
| [24] |
EfficientNet + ResNet |
Skin disease dataset |
97.1% Accuracy |
Not focused on MRI |
| [25] |
ConvNeXT |
AML Blood Smears |
95.8% Accuracy |
Non-MRI application |
|
This Work |
DenseNet121 + Ensemble + LLM + XAI |
Figshare, SARTAJ, Br35H |
97.8% Accuracy / 0.985 F1-score |
High performance + Explainability + Clinical Report |
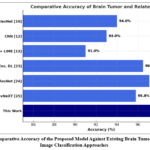 |
Figure 14: Comparative Accuracy of the Proposed Model Against Existing Brain Tumor and Medical Image Classification Approaches
|
This performance edge is visually represented in Fig. 14, which compares classification accuracies across several existing methods. The proposed system outperforms traditional and non-interpretable models, offering a more deployable and clinician-friendly pipeline through automated report generation and integrated XAI outputs.
Conclusion
This study presents an AI-powered MRI Analysis App designed to support brain tumor classification and diagnosis through a robust and interpretable deep learning pipeline. By integrating a CNN ensemble of DenseNet121, ResNet50, EfficientNet-B0, and MobileNetV3-Small, trained on a large and diverse dataset of 7023 MRI images, the system achieves high diagnostic performance across four tumor classes. The best-performing model, DenseNet121, demonstrated impressive classification metrics, with a macro F1-score of 0.9850 and AUC values nearing 0.99 across all classes. To overcome the black-box limitations of deep learning, the system incorporates multiple explainable AI techniques—Grad-CAM, SHAP, LIME, and Edge Detection—offering meaningful visual and analytical justifications for each prediction. Furthermore, the integration of a Large Language Model (LLM) via LangChain-Groq enables the automated generation of clinically formatted diagnostic reports, effectively bridging the gap between AI outputs and radiologist workflows. The final system output, including prediction, explanation, and textual analysis, is packaged into a downloadable PDF, facilitating ease of use in practical settings.
Future work will explore the inclusion of additional imaging modalities, such as CT or PET scans, to support multimodal tumor analysis. The system may also be adapted for mobile or edge deployment to assist diagnosis in resource-constrained environments. Further, the integration of federated learning will be considered to enable privacy-preserving model training across institutions. Finally, clinical trials and collaborations with healthcare institutions will be pursued to validate the system’s real-world utility and improve its generalizability across populations and imaging conditions.
Acknowledgement
The authors would like to thank the School of Computer Engineering, KIIT Deemed to be University, Bhubaneswar, for providing the necessary academic support and research infrastructure for carrying out this work. The department’s guidance and resources are sincerely appreciated for facilitating the successful execution of this study.
Funding Source
The author(s) received no financial support for the research, authorship, and/or publication of this article.
Conflict of Interest
The author(s) do not have any conflict of interest.
Data Availability Statement
This statement does not apply to this article.
Ethics Statement
This research did not involve human participants, animal subjects, or any material that requires ethical approval.
Informed Consent Statement
This study did not involve human participants, and therefore, informed consent was not required.
Clinical Trial Registration
This research does not involve any clinical trials.
Permission to reproduce material from other sources
Not Applicable
Authors’ Contribution
- P. Swain: Conceptualization, Methodology, Writing – Original Draft, Funding Acquisition.
- Soumya Ranjan Nayak: Data Collection, Analysis, Writing – Review & Editing.
- Prabhishek Singh: Resources, Supervision.
- Santosh Kumar Swain: Visualization, Supervision, Project Administration.
References
- Martucci M, Russo R, Schimperna F, D’Apolito G, Panfili M, Grimaldi A, et al. Magnetic resonance imaging of primary adult brain tumors: State of the art and future perspectives. 2023;11(2):364.
CrossRef - Swain KP, Nayak RK, Swain A, Nayak SR. The impact of machine learning on chronic kidney disease: Analysis and insights. In: Kumar P, Singh P, Diwakar M, Garg D, eds. Healthcare Industry Assessment: Analyzing Risks, Security, and Reliability. Cham: Springer; 2024. https://doi.org/10.1007/978-3-031-65434-3_6
CrossRef - Swain KP, Samal SR, Ravi V, Nayak SR, Alahmadi TJ, Singh P, et al. Towards early intervention: Detecting Parkinson’s disease through voice analysis with machine learning. Open Biomed Eng J. 2024;18. http://dx.doi.org/10.2174/0118741207294056240322075602
CrossRef - Shen L, Margolies LR, Rothstein JH, Fluder E, McBride R, Sieh W. Deep learning to improve breast cancer detection on screening mammography. Sci Rep. 2019;9(1):12495.
CrossRef - Abdusalomov AB, Mukhiddinov M, Whangbo TK. Brain tumor detection based on deep learning approaches and magnetic resonance imaging. Cancers (Basel). 2023;15(16):4172.
CrossRef - Samek W, Wiegand T, Müller KR. Explainable artificial intelligence: Understanding, visualizing and interpreting deep learning models. ITU J ICT Discov. 2017;1:1-10. https://doi.org/10.48550/arXiv.1708.08296
- Selvaraju RR, Cogswell M, Das A, Vedantam R, Parikh D, Batra D. Grad-CAM: Visual explanations from deep networks via gradient-based localization. Int J Comput Vis. 2020;128(2):336-359.
CrossRef - Ribeiro MT, Singh S, Guestrin C. “Why should I trust you?”: Explaining the predictions of any classifier. Proc 22nd ACM SIGKDD Int Conf Knowl Discov Data Min. 2016:1135-1144.
CrossRef - Lundberg SM, Lee SI. A unified approach to interpreting model predictions. Adv Neural Inf Process Syst. https://doi.org/10.48550/arXiv.1705.07874
- Umarani CM, Gollagi SG, Allagi S, Sambrekar K, Ankali SB. Advancements in deep learning techniques for brain tumor segmentation: A survey. Informatics Med Unlocked. 2024;50:101576.
CrossRef - Satushe V, Vyas V, Metkar S, Singh DP. AI in MRI brain tumor diagnosis: A systematic review of machine learning and deep learning advances (2010–2025). Chemom Intell Lab Syst. 2025;263:105414.
CrossRef - Abdusalomov AB, Mukhiddinov M, Whangbo TK. Brain tumor detection based on deep learning approaches and magnetic resonance imaging. Cancers (Basel). 2023;15(16):4172.
CrossRef - Sadeghi Z, Alizadehsani R, CIFCI MA, Kausar S, Rehman R, Mahanta P, et al. A review of explainable artificial intelligence in healthcare. Comput Electr Eng. 2024;118(Pt A):109370.
CrossRef - Xiao M, Zhang L, Shi W, Liu J, He W, Jiang Z. A visualization method based on the Grad-CAM for medical image segmentation model. Proc 2021 Int Conf Electron Inf Eng Comput Sci (EIECS). 2021:242-247.
CrossRef - Kun Y, Chunqing G, Yuehui G. An optimized LIME scheme for medical low light level image enhancement. Comput Intell Neurosci. 2022;2022:9613936.
CrossRef - Sun J, Sun CK, Tang YX, Liu TC, Lu CJ. Application of SHAP for explainable machine learning on age-based subgrouping mammography questionnaire data for positive mammography prediction and risk factor identification. Healthcare (Basel). 2023;11(14):2000.
CrossRef - Vimbi V, Shaffi N, Mahmud M. Interpreting artificial intelligence models: A systematic review on the application of LIME and SHAP in Alzheimer’s disease detection. Brain Inf. 2024;11:10.
CrossRef - Chanda T, Hauser K, Hobelsberger S, Bauer A, Stadlbauer A, Schulze C, et al. Dermatologist-like explainable AI enhances trust and confidence in diagnosing melanoma. Nat Commun. 2024;15:524.
CrossRef - Tan TF, Dai P, Zhang X, Jin L, Poh S, Hong D, et al. Explainable artificial intelligence in ophthalmology. Curr Opin Ophthalmol. 2023;34(5):422-430.
CrossRef - Cheng J, Huang W, Cao S, Yang R, Yang W, Yun Z, et al. Tumor region augmentation in MRI. PLoS One. 2015;10(10):e0140381.
CrossRef - SARTAJ Dataset. GitHub Repository. https://github.com/sartajbhuvaji/Brain-Tumor-Classification-MRI
- Br35H Dataset. Kaggle Dataset. https://www.kaggle.com/datasets/masoudnickparvar/brain-tumor-mri-dataset
- Arora L, Singh SK, Kumar S, Verma R, Tiwari P, Gupta N, et al. Ensemble deep learning and EfficientNet for accurate diagnosis of diabetic retinopathy. Sci Rep. 2024;14:30554.
CrossRef - Alruwaili M, Mohamed M. An integrated deep learning model with EfficientNet and ResNet for accurate multi-class skin disease classification. 2025;15:551.
CrossRef - Mustapha MT, Ozsahin DU. Morphological analysis and subtype detection of acute myeloid leukemia in high-resolution blood smears using ConvNeXT. 2025;6:45.
CrossRef - Pang RY, Santy S, Just R, Reinecke K. BLIP: Facilitating the exploration of undesirable consequences of digital technologies. Proc 2024 CHI Conf Hum Factors Comput Syst. 2024:290. https://doi.org/10.1145/3613904.3642054
CrossRef - Singhal K, Azizi S, Tu T, Mahdavi S, Bernecker S, Loh P, et al. Large language models encode clinical knowledge. 2023;620:172-180.
CrossRef - Lehman E, Johnson A. Clinical-T5: Large language models built using MIMIC clinical text (version 1.0.0). 2023. https://doi.org/10.13026/rj8x-v335

