
Manuscript accepted on :26-09-2025
Published online on: 04-11-2025
Plagiarism Check: Yes
Reviewed by: Dr. Randa Salah Gomaa Mahmoud
Second Review by: Dr. Nagham Aljamali
Final Approval by: Dr. Shubham Mahajan
Upendra Singh* , Vidit Kumar and Bhaskar Pant
Department of Computer Science and Engineering, Graphic Era (Deemed to be University), Dehradun, India.
Corresponding Author E-mail: aswal.upendra2010@gmail.com
DOI : https://dx.doi.org/10.13005/bpj/3407
Abstract
Alzheimer’s Disease (AD) is a progressive neurodegenerative disorder associated with irreversible structural and functional brain deterioration. Early and accurate diagnosis is essential to slow disease progression and improve patient quality of life. Existing methods face several challenges, including limited ability to capture multi-scale volumetric features, reliance on handcrafted or shallow feature representations, and insufficient focus on disease-relevant brain regions, which often reduce diagnostic reliability. To address these limitations, this work aims to develop an effective computer-aided diagnostic framework based on 3D CNN and attention using magnetic resonance imaging (MRI) to distinguish between AD, mild cognitive impairment (MCI), and cognitively normal (CN) subjects. We proposed Alzh-3DCNN-Attention, a modified C3D model that integrates a Convolutional Block Attention Module (CBAM) with sequentially connected 3D CNN layers to emphasize discriminative brain regions while preserving volumetric context. The novelty of our approach lies in its ability to jointly capture multi-scale features and focus on disease-relevant regions without the need for handcrafted feature engineering. Experiments were conducted on the ADNI dataset with rigorous pre-processing to enhance data quality. The proposed model achieved 91.54% accuracy, 89.75% sensitivity, 92.35% specificity, and 89.70% AUC for multi-class classification, outperforming conventional 3D CNN baselines. These results demonstrate that attention-enhanced 3D CNNs improve feature representation and yield robust diagnostic performance. The findings suggest that the proposed approach provides a reliable and efficient tool for automated AD classification, offering valuable support for clinicians in early disease detection.
Keywords
Convolutional-3D; Cognitively normal; 3-D MRI; Deep learning, Image-classification, Mild cognitive impairment
Download this article as:| Copy the following to cite this article: Singh U, Kumar V, Pant B. Alzheimer's Disease Classification Using Attention based 3D Convolutional Neural Network and 3 D MRI images. Biomed Pharmacol J 2026;19(June Spl Edition). |
| Copy the following to cite this URL: Singh U, Kumar V, Pant B. Alzheimer's Disease Classification Using Attention based 3D Convolutional Neural Network and 3 D MRI images. Biomed Pharmacol J 2025;18(June Spl Edition). Available from: https://bit.ly/48VB2vT |
Introduction
In the Alzheimer’s Association 2019 report,1 the pathological hallmarks of AD, including β-amyloid plaques and tau neurofibrillary tangles, disrupt neuronal communication and nutrient transport, ultimately leading to widespread neurodegeneration. AD is related to observable structural variations in the brain, such as ventricular enlargement, hippocampal shrinkage, cortical thinning, and changes in both white and gray matter. The structural alterations can be visualized through neuro-imaging modalities such as MRI, DTI, and PET. Machine learning plays a vital role by automating complex tasks such as segmentation and classification. Accurately trained machine learning models can replicate expert-level diagnostic decision-making, offering reliable and efficient support for clinicians. MCI signifies a transitional phase between usual aging and the early onset of AD. Some aspects are related to an increased risk of AD, including genetic tendency, educational or occupational engagement, family history, and internal as well as external brain injuries.2 In addition to these factors, structural MRI has proven valuable for identifying hallmark neurodegenerative changes, such as hippocampal shrinkage, ventricular enlargement, and cortical thinning, which are strongly associated with disease progression.3-6 Image processing techniques aim to classify discriminative patterns by clustering MRI scans with similar features. Some approaches enable the recognition of common imaging structures between AD patients, which are different from those observed in CN or MCI. The success of AD classification relies comprehensively on accurately extracting features that reflect key structural changes in the brain. Moreover, this includes ventricular broadening, hippocampal atrophy, variations in cortical thickness, and overall brain volume reduction, indicators of AD-associated neurodegeneration.3 However, similar structural changes can also appear in other neurological conditions such as Parkinson’s Disease.4 The structural MRI has appeared as a valuable modality for evaluating regional and global brain atrophy in AD and MCI.5,6 Structural MRI plays a critical role in clinical settings for identifying key biomarkers that reflect AD development.7,8 However, while MRI provides essential anatomical insights, it should not be the sole basis for diagnosis, distinguishing between normal and pathological scans is generally more straightforward than identifying a specific disease subtype from a broader spectrum of abnormal cases. Consequently, comprehensive diagnosis should be maintained by supplementary clinical assessments and genetic testing to ensure accuracy and reliability in identifying AD. To successfully extract both direct and indirect features from brain images, researchers have proposed many methodologies, including machine learning (ML) methods and deep learning (DL) frameworks, aimed at facilitating the diagnosis of AD. Traditional ML techniques typically rely on handcrafted features derived from MRI data. These features may include voxel intensities, tissue densities, and shape descriptors, which can be extracted from an MRI image, such as those in references 9,10 or predefined regions.11-15 Further, Gutman et al12 used global feature descriptors of the hippocampal plane. Silveira &Marques13 implemented an advanced classifier that integrated features from ROIs. While ROI-based approaches often yield high classification performance, their success is contingent upon accurate ROI delineation, which can be subjective and error-prone. In contrast, whole-brain-based methods bypass the need for prior ROI definition and have been widely adopted. For example, Klöppel et al10 projected whole-brain gray matter density into a high-dimensional space, whereas,11,16 used deformation-based metrics to compute image dissimilarity and performed classification in the projection space using support vector machine( SVM). Recent efforts in AD classification have also explored handcrafted and hybrid features. For instance, Zayed et al.17 proposed a classification approach using SURF and SIFT features extracted from diffusion tensor MRI, reporting performance below 91%. Similarly, Hechkel & Helali 18 applied data fusion of MRI and DTI with YOLOv11 for early detection, but their model also achieved accuracy below 91%, underscoring the challenges in achieving robust generalization. These studies highlight the continued need for architectures capable of leveraging volumetric and disease-relevant spatial information more effectively.
While structural MRI can be processed as 2D slices, such approaches lose essential volumetric context and subtle spatial dependencies. Three-dimensional convolutional neural networks (3D CNNs) extend convolution and pooling into the depth dimension, preserving spatial structure and improving sensitivity to AD-related atrophy patterns. 19-21 Recent studies show that 3D CNNs outperform 2D architectures in capturing disease progression. However, most existing 3D CNNs lack effective mechanisms to emphasize disease-relevant brain regions, such as the hippocampus and entorhinal cortex. Incorporating attention modules, such as the Convolutional Block Attention Module (CBAM), can guide the network to focus on these discriminative features, thereby improving classification accuracy.
We present an improved architecture based on the existing C3D model, preserving its advantage of a relatively low number of convolutional parameters while improving its suitability for 3-D medical image classification. Our proposed approach was initially tested using the ADNI dataset. We performed a fair analysis of the classification performance of our model against several existing 3-D convolutional neural networks (CNNs) including the original C3D model, under consistent experimental conditions. Moreover, our approach was benchmarked against a range of existing methods to assess its relative usefulness. We produced a deep learning framework capable of distinguishing between AD, MCI, and CN. Our contributions are summarized as follows:
We introduced attention based 3-D CNN approach for AD diagnosis using 3-D MRI images.
We investigate C3D model and proposed 3D -Convolutional Block Attention Module (CBAM) integrated 3D-CNN network.
We assessed the most efficient 3-D deep learning architectures and conducted comparisons across several experiments.
The proposed (Alzh-3DCNN-Attention) model exhibits outstanding performance in comparison to recent existing techniques when tested on the ADNI dataset, underscoring its success in AD classification.
Related Work
Architectures such as Efficient Net by Tan and Le19 neural networks have evolved rapidly, continuously improving in performance and efficiency. These state-of-the-art models have been increasingly applied to magnetic resonance (MR) image classification for AD. Deep learning models were primarily utilized for ROI segmentation and feature extraction, with traditional machine learning algorithms subsequently employed for classification. Suk et al20 implemented a stacked encoder to obtain features and applied a multi-kernel SVM, and Liu and Shen21 suggested a hybrid method combining unsupervised and supervised learning to extract deep convolutional features from 2D MRI slices. As DL techniques have matured, their application has expanded to cover the entire classification pipeline. Further, Hosseini et al20 introduced a 3-D flexible CNN based on a convolutional auto encoder. Further, Wang et al23 suggested a 3-D CNN based approach. Next, Zhang et al24 incorporated an attention mechanism with CNN architecture to further enhance model performance. Widely recognized architectures such as Res-Net, VGG16-Net, and Google-Net are explored by Cheng et al25, Billones et al26, and Szegedy et al27 . For example, Lim et al28 developed a classification system integrating CNNs, VGG-16, and Res-Net-50. With their strong ability to capture spatial dependencies in volumetric data, 3D convolutional networks have become increasingly prevalent in AD classification and prediction tasks. However, while 3D CNNs offer superior feature representation for 3D MR images, they also impose greater computational demands, which remains a challenge for large-scale deployment and clinical integration.
For example, Yan et al29 proposed a pyramid squeeze attention-based framework for AD and CN classification, omitting the intermediate MCI stage. In contrast, Goenka & Tiwari30 explored various computational strategies such as patch-based 3D and slice-level modelling within a 3D CNN framework. The approach given by Huang et al,3 aimed at the hippocampal region, suggesting a multimodal 3-D CNN which utilizes MRI and PET modalities specifically targeting the hippocampi and/or cortices—without requiring prior segmentation. Their approach involved training separate CNNs using the VGG16 architecture for MRI and PET inputs. Another multimodal approach proposed by Liu et al31 they simplified the 3D CNN model with a different fusion strategy. They employed a cascaded CNN, followed by a 2D CNN for classification. Moreover, Hosseini et al32 suggested a 3D-CNN model which is trained with MRI to achieve multi – classification among AD, MCI, and CN. Similarly, Payan et al33 utilized an auto encoder to pre-train a patch-based 3D CNN with MRI classification, relying on dataset partitioning. In contrast, Oh et al34 applied a 3-D CNN based approach for AD and CN classification. Previous work has highlighted limitations of 2D CNNs in AD classification tasks, as noted by Nguyen et al35 that 2D models may yield unreliable predictions due to their sensitivity to minor pixel-level changes, especially when applied to a domain for which they were not explicitly trained. However, deeper models introduce increased parameter complexity, which demands larger, high-quality training datasets. Both 2D and 3D CNNs follow a generic feature extraction paradigm,36,37 where learned convolutional features, often referred to as off-the-shelf CNN features, Sharif et al38 in their work extracted features from intermediate layers of the network. These features represent numerical weights learned through backpropagation and are critical to the model’s capacity for image-based pattern recognition across various tasks.
ML and DL have proved the advancement of artificial intelligence(AI) based systems for AD classification.37 Numerous studies have leveraged neuroimaging data to predict AD using conventional ML classifiers, typically applied after mining handcrafted features through image pre-processing pipelines.40-42 More recently, DL approaches have gained prominence due to their remarkable success in the medical imaging domain.43-45 These models have consistently outperformed traditional techniques in various AD diagnostic tasks.46,47 Advanced architectures have been widely adopted for feature extraction and classification in AD research.48-53 Furthermore, attention mechanisms have been incorporated into neural networks to enhance feature sensitivity and model interpretability, as demonstrated in several recent studies.54-57 Despite these advances, prior research exhibits considerable variation in multiple dimensions, including the type and size of datasets used, the pre-processing techniques applied, the classification targets (binary or multi-class), model architectures and hyper parameter configurations, methods for processing MRI data (e.g., whole-brain 3D volumes, patch-based 3D, or 2D slice-level inputs), as well as evaluation strategies and performance metrics.
Materials and Methods
Our work explores deep learning (DL) architecture for the classification of AD using 3D medical images, integrating spatial attention mechanisms to enhance feature selection. Since human organs and tissues have complex 3D structures and 3D CNNs can learn volumetric representations of these, resulting in better generalization and localization, and can be applied 3D kernels (filters) across the full volume (width × height × depth), hence learns spatial features across all three dimensions simultaneously. Due to this, we came up with a new architecture i.e., Alzh-3DCNN-Attention, which is shown in Figure 1. We modified the C3D model to propose our model, we introduced the 3-D Convolutional Block Attention Module (CBAM) mechanism and added some CONV3D blocks. We applied the 3-DCBAM block before every max-pool layer.
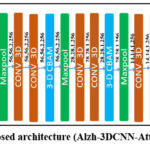 |
Figure 1: Proposed architecture (Alzh-3DCNN-Attention) |
The proposed 3D –CNN based model is developed for volumetric brain image classification, beginning with an input layer of shape (224, 224, 3, 1), representing a volumetric brain scan with height, width, depth, and a single channel. First, we used two consecutive 3D convolutional layers to extract the initial features, which expand the feature channels to 32 and 64, respectively, resulting in an output of (224, 224, 3, 64). A Convolutional Block Attention Module (CBAM) is applied to refine these features by emphasizing salient spatial and channel-wise information. A subsequent MaxPooling3D layer reduces the spatial dimensions to (112, 112, 3, 64). The second block includes three Conv3D layers that increase the feature depth to 256, yielding an output of (112, 112, 3, 256). A second CBAM module further refines the representation, followed by another MaxPooling3D operation that reduces the dimensions to (56, 56, 2, 256). In the third stage, two Conv3D layers expand the feature maps to (56, 56, 2, 256). After applying the third CBAM module, a MaxPooling3D layer reduces the dimensions to (28, 28, 1, 256). The fourth block consists of two Conv3D layers that increase the feature depth to 256, resulting in (28, 28, 1, 256). A fourth CBAM module is applied, and a MaxPooling3D layer to produce output to (14, 14, 1, 256). In the final convolutional stage, two Conv3D layers with 256 filters maintain the spatial dimensions, producing (14, 14, 1, 256). The fifth CBAM module is applied, followed by a MaxPooling3D layer that reduces the dimensions to (7, 7, 1, 512). Another Conv3D layer is applied, preserving the shape at (7, 7, 1, 512). Next for classification, we used a 3-D Global Average Pooling (3D-GAP 3D) layer, which flattens the output into a (512-feature vector. This vector passes through a Dense layer reducing it to (512,), a dropout layer for regularization, and another dense layer producing a (512)-dimensional embedding. Finally, a softmax-activated Dense layer with 3 output units generates class probabilities corresponding to the diagnostic labels: AD, MCI, and CN. By incorporating spatial attention, the model improves feature selection and enhances its capability of differentiation of various stages of AD, resulting in more accurate and reliable diagnostic predictions. Our 3-D model has 12 convolutions, 5 max-pooling, 2 fully connected layers, 1 gap layer,5 3-D CBAM, and 1 dropout, and a softmax output layer. The working of the model is given in Algorithm 1.
3D-Convolutional Block Attention Module (3D-CBAM)
Figure 2 depicts the architecture of the 3D-CBAM block, designed specifically to refine volumetric feature maps obtained from 3D inputs such as MRI or CT scans. This attention module has two sub-modules, the channel attention module (CAM) and the spatial attention module (SAM), which collaboratively enhance feature representations by focusing on informative channels and spatial locations, respectively. At the top of the diagram, the 3D-CBAM block begins with an input feature map of shape D×H×W×C, where D is the depth, H is the height, W is the width, and C is the number of channels. The Channel Attention Module is applied first. This module computes two descriptors by applying global MaxPooling and global AvgPooling across the spatial dimensions. These pooled features result in two tensors of shape 1×1×1×C. Then the tensor shapes are supplied to a shared multi-layer perceptron (MLP) consisting of two fully connected layers. The resulting outputs are summed element-wise and passed through a sigmoid activation function to form the channel attention map of shape 1×1×1×C. This map is then multiplied elementwise with the original input feature map to generate a channel-refined feature map, emphasizing the most important channels. Following this, the spatial attention module is applied to the channel-refined feature map. The module first performs MaxPooling and AvgPooling with the channel dimension, producing two feature maps of shape D×H×W×1. These maps are concatenated with the channel axis to obtain a tensor of shape D×H×W×2. This concatenated tensor is then passed through a convolutional layer with a kernel of size k×k×k (implicitly representing a 3D kernel, yielding a spatial attention map of shape D×H×W×1. After passing through a sigmoid activation, this map is multiplied element-wise with the channel-refined feature map to produce the final refined feature. This dual-stage attention mechanism allows the model to selectively enhance features by learning what (channel attention) and where (spatial attention) to emphasize, making it especially effective for medical image analysis, where subtle spatial variations and localized features are crucial for diagnosis. The mathematical formulation of the block is given in Algorithm 2.
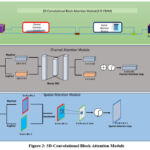 |
Figure 2: 3D-Convolutional Block Attention Module |
Let XϵR224×224×3×1 represent the input 3D medical image slice. The model processes X through several Conv layers, attention mechanisms, and fully connected layers to classify it into one of three categories: AD, MCI, or CN.
| Algorithm: 1 | ||
| Step1. | Input | Input a 3D brain MRI volume of shape (224, 224, 3, 1). |
| Step2. | Initial Feature Extraction | Apply Conv3D_1: a convolutional layer to extract low-level 3D features. Apply Conv3D_2: another convolutional layer for deeper representation. Apply 3D-CBAM_1: 3D Convolutional Block Attention Module to refine salient features. |
| Step3. | Down-sampling | Apply MaxPooling3D_1: reduce spatial resolution. |
| Step4. | Intermediate Feature Extraction & Attention (Repeated Blocks) | Block 2: Apply Conv3D_3 and Conv3D_4. Apply 3D-CBAM_2. Apply MaxPooling3D_2.Block 3: Apply Conv3D_5 and Conv3D_6. Apply 3D- CBAM_3. Apply MaxPooling3D_3.Block 4:Apply Conv3D_7 and Conv3D_8.Apply 3D-CBAM_4. Apply MaxPooling3D_4.Block 5:Apply Conv3D_9. Apply MaxPooling3D_5.Apply 3D-CBAM_5. |
| Step5. | Final Feature Aggregation: | Apply GlobalAveragePooling3D (GAP): compress spatial dimensions, producing a global feature vector. Pass through Dense_1: fully connected layer for feature embedding. Apply Dropout: to prevent overfitting. Pass through Dense_2: final classification layer with 3 neurons using softmax activation. |
| Step6. | Output: | Class probabilities for: AD, CN and MCI. |
Algorithm 2: 3D-CBAM : Let the input 3D fetaure be , where D=depth,H=heigh,W=width and C=number of channels
| Step 1. | Channel Attention block: |
| 1.1 Apply Global Average Pooling and Global Max Pooling along spatial dimensions:FCavg = AvgPool(F) ∈ R1x1xCFCmax = maxPool(F) ∈ R1x1xC1.2 Pass both pooled features through a shared multi-layer perceptron (MLP):
Let the MLP be: MLP ⊙ = W1 (ReLU(W0 (∙))) Then MCavg = MLP(FCavg) MCmax = MLP(FCmax) 1.3 Combine via element – addition and apply sigmoid: Mc = σ(MCavg + MCmax) ∈ R1x1x1xC 1.4 Multiply attention map to original input: F’ = Mc ⊙ F |
|
| Step 2. | Spatial attention block:2.1 Apply Average Pooling and Max Pooling along the channel axis:FSavg = AvgPool (F’, axis = C) ∈ RDxHxWx1 FSMax = AvgPool (F’, axis = C) ∈ RDxHxWx1 2.2 Concatenate FsConcat = Concat[FSavg , FSMax] ∈ RDxHxWx2 1.4 Apply 3D convolution (kernel size k) and sigmoid Ms = σ(Conv3D(FsConcat,k)) ∈ RDxHxWx1 1.5 Final refined feature: Multiply spatial attention to feature F” = Ms ⊙ F’ |
| Step 3. | Output of 3D-CBAM:F”∈ RDxHxWxC |
Statistical analysis: In this study, we evaluated the performance of our proposed approach using multiple standard classification metrics, including Accuracy, Precision, Sensitivity, F1-score, Specificity, and the Area Under the ROC Curve (AUC). These metrics were selected to provide a comprehensive assessment of model performance.
Accuracy = (TP + TN)/(TP + TN + FP + FN)
Precision = (TP/(TP + FP))
Specificity = TN/(TN + FP)
Sensitivity= TP/(TP + FN)
F1 Score = 2 × (Precision × Recal)/(Precision + Recal)
Results
To evaluate our work, we performed two types of experiments: two-class classification (AD vs. CN) and multi-class classification (AD vs. CN vs. MCI). We used 70% and 30% of the total samples, respectively, for training and testing purposes; for all experiments, we used an image shape of (224, 224, 3), a batch size of 32, and 100 epochs with a learning rate of 0.0003 for the first 70 epochs and 0.00003 for the remaining 30 epochs. We achieved further data augmentation by flipping and random cropping. Our work utilized the ADNI dataset https://adni.loni.usc.edu/.58 During the acquisition of data, a total of 6240 3-D MRI images (CN: 4230, MCI: 803, AD: 1207) were considered. The data collection process included both males and females within the age range of 50 to 90. We used 4368 images in training and 1872 images for testing purposes. Table 1 illustrates the distribution of data set.
Table 1: Dataset Distribution
| Classes | No. of Sagittal- MRI images | |
| # Training images | # Testing images | |
| AD | 845 | 362 |
| CN | 2961 | 1269 |
| MCI | 562 | 241 |
Result Analysis
First, we analyse three 3D models, namely M1, M2, and M3, then we compare these models with the C3D model to propose the final model (Alzh-3DCNN-Attention). The results are analysed over ADNI datasets using some metrics such as accuracy, specificity, AUC, and sensitivity. In all models, the feature map is extracted from a 3D-CNN. Here we applied batch normalization and activation layers after each convolutional layer. A description of each model including proposed model is given below. Model M1 has 9 convolutions, 3 Max-Pooling, 2 fully connected layers, 1 gap layer,1 reshape, 1 multiply, 1 dropout, and a softmax output layer. Model M2 has 10 convolutions, 4 max-pooling, 2 fully connected layers, 1 gap layer,1 reshape, 1 multiply, 1 dropout, and a softmax output layer. Model M3 has 11 convolutions, 5 max-pooling, 2 fully connected layers, 1 gap layer,1 reshape, 1 multiply, 1 dropout, and a softmax output layer. Our 3-D model has 12 convolutions, 5 Max-Pooling, 2 fully connected layers, 2 gap layers,1 reshape, 1 multiply, and 1 dropout followed by a softmax output layer.
Table 2: (Performance evaluation of various models, including proposed approach (Alzh-3DCNN-Attention))
| Model | Accuracy (%) | Classes | Precision | Recall | F1-Score |
| M1 | 88 | AD | .85 | .83 | .84 |
| CN | .89 | .90 | .91 | ||
| MCI | .92 | .79 | .81 | ||
| M2 | 87 | AD | .87 | .87 | .87 |
| CN | .90 | .91 | .88 | ||
| MCI | .89 | .78 | .84 | ||
| M3 | 88 | AD | .87 | .88 | .88 |
| CN | .90 | .87 | .90 | ||
| MCI | .92 | .83 | .87 | ||
| C3D[60] | 89 | AD | .84 | .87 | .88 |
| CN | .90 | .90 | .90 | ||
| MCI | .91 | .79 | .82 | ||
| Proposed Method (Alzh-3DCNN-Attention) | 91.54 | AD | .84 | .87 | .86 |
| CN | .92 | .94 | .93 | ||
| MCI | .93 | .77 | .84 |
Table 2 presents the performance models (M1, M2, M3, C3D, and the Proposed model) on a multi-class classification task including AD, MCI, and CN. M1 model shows an accuracy of 88% with AD class precision of 0.85, recall of 0.83, and f1-score of 0.84. Fairly balanced but recall is slightly lower suggesting some AD cases were misclassified. For CN class precision 0.89, recall 0.90, and F1-score 0.91 which show strong performance in identifying CN subjects with high precision and recall. For MCI class precision 0.92, recall 0.79, and F1-score 0.81. High precision but relatively low recall indicating the model is confident when it predicts MCI but it misses many actual MCI cases (under-detection). Model M2 shows an accuracy of 87% for AD class with precision, recall, and F1-score 0.87 perfectly stable though not the highest indicating consistent prediction behaviour. For CN class precision 0.90, recall 0.91, and F1-Score 0.88 means good recall and precision though F1 is slightly lower than M1. For MCI class precision 0.89, recall 0.78, and F1-Score 0.84. Similar issue as M1 has high precision but low recall. Model M3 shows an accuracy of 88% for AD class with precision 0.87, recall 0.88, and F1-score 0.88. For CN class precision 0.90, recall 0.87, and F1-score 0.90 which indicates very good performance overall. For MCI class precision 0.92, recall 0.83, and F1-Score 0.87 improved recall compared to M1 and M2 maintaining strong precision. Model C3D shows an accuracy of 89% for AD class with precision 0.84, recall 0.87, and F1-Score 0.88. Slightly lower precision than others but has good recall. For CN class precision, recall, and F1–score is 0.90 very reliable performance in CN classification. For MCI class precision 0.91, recall 0.79, and F1-score 0.82. C3D performs well especially for CN class. The model is relatively conservative in MCI detection (high precision and lower recall) possibly due to the difficulty in distinguishing MCI from CN or AD in intermediate stages. Proposed model’s accuracy 0.90 (Highest among all) and AD precision 0.84, recall 0.87, and F1-score 0.86. For CN precision 0.92, recall 0.94, and F1-score 0.93. Exceptional performance with both high sensitivity and specificity. For MCI class precision 0.93, recall .77, and F1-score 0.84 which is extremely precise but misses some MCI cases. Our proposed approach attains the highest accuracy and best CN classification. The Proposed model (Alzh-3DCNN-Attention) achieved the highest accuracy (91.54%), outperforming all baselines models. For the CN class our approach has a 0.93 F1-score representing strong performance in classifying cognitively normal subjects. The AD class performance is relatively stable across models with the proposed model offering a balanced trade-off (F1 = 0.86).
In Figure 3, we presented the training accuracy and training loss for five models (M1 to Proposed (Alzh-3DCNN-Attention)). The training performance comparison between the proposed approach and baseline/ablation approaches is illustrated in the provided plots. The left plot presents the accuracy progression across 100 training epochs, while the right plot displays the corresponding loss values. As shown in the accuracy graph, the proposed approach achieves superior performance, outperforms the baseline C3D model, as well as the three ablation variants labelled M1, M2, and M3. Among these, M2 and M3 demonstrate relatively strong performance, approaching the proposed model’s accuracy, whereas M1 and especially C3D lag, with C3D showing the slowest convergence and the lowest final accuracy. The loss plot further reinforces these findings. The proposed model exhibits the most stable and lowest loss values over time, indicating a well-optimized and generalizable network. M2 and M3 also show favourable loss reduction trends, though not as pronounced as the proposed model. In contrast, M1 experiences slower convergence, and the C3D model displays significant instability, with sharp fluctuations in loss across epochs. Overall, the results confirm that the proposed approach accelerates convergence, attains higher accuracy, and better training stability, highlighting its effectiveness and robustness compared to existing approaches.
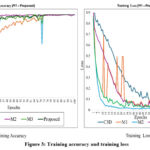 |
Figure 3: Training accuracy and training loss. |
In Figure 4, we presented the testing accuracy and testing loss for five models (M1 to Proposed (Alzh-3DCNN-Attention)). The validation outcome of the proposed approach, along with the baseline, C-3D and ablation variants (M1, M2, and M3) is illustrated in the provided plots which track validation accuracy and validation loss over 100 training epochs. The left plot highlights the progression of validation accuracy where the proposed approach consistently outperforms other approaches. It achieves the highest and most stable accuracy reaching close to 0.9 by the end of training. While M2 and C3D display relatively steady improvements, they plateau at lower accuracy levels compared to the proposed model. In contrast, M1 and M3 show noticeable fluctuations throughout the training period suggesting instability and less reliable generalization. The plot at right hand side depicts validation loss, further emphasizing the advantages of the proposed model. The plot maintains the lowest and most stable loss values throughout the training process; it also shows strong generalization and minimal overfitting. C3D, M1, and M2 show moderate and fairly stable loss curves though they do not match the consistency of the proposed method. Moreover, the model M3 displays significant spikes in loss across epochs, with values reaching as high as 3.5 reflecting severe instability and poor validation performance. These outcomes clearly show the superiority of the proposed approach and show higher and more consistent validation accuracy but also maintain lower and more stable validation loss compared to both the baseline and other models. This indicates that the proposed approach offers better reliability and robustness in the validation phase reinforcing its overall effectiveness.
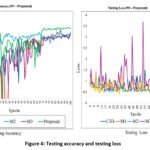 |
Figure 4: Testing accuracy and testing loss |
In Figure 5, we offered the Receiver operating characteristics (ROC) curve for the proposed (Alzh-3DCNN-Attention) model. The figure shows ROC curves for a multi-class classification model specifically designed to differentiate among AD, CN, and MCI. The performance of the approach is quantified using the AUC metric which measures the model’s capability to categorize the classes. The plot shows high AUC values, representing excellent classification performance. Our model achieves 0.97 AUC for AD, 0.96 for CN, and 0.98 for MCI. These values endorse that the approach is highly effective at differentiating between these classes. The curves are situated well above the diagonal line, which represents random prediction, further confirming the model’s strong discriminative capability.
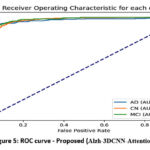 |
Figure 5: ROC curve – Proposed (Alzh-3DCNN-Attention) |
Figure 6 shows the precision-recall (PR) curve for the proposed (Alzh-3DCNN-Attention) approach. Each curve corresponds to one of the three classes, with the average precision (AP). CN class demonstrates the highest AP value of 0.97, indicating that our approach executes remarkably well in classifying cognitively normal subjects with both high precision and recall. AD class follows with an AP of 0.94, reflecting strong performance in detecting Alzheimer’s patients. Meanwhile, the MCI class has a slightly lower AP of 0.88, suggesting that while the model still performs reasonably well, it is somewhat less confident and consistent in identifying mild cognitive impairment cases compared to the other two classes. Overall, the PR curves confirm the model’s robustness, especially in distinguishing CN and AD, while also highlighting the challenge of accurately classifying MCI cases, which often present overlapping features with both AD and CN.
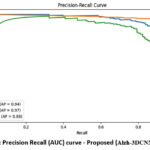 |
Figure 6: Precision Recall (AUC) curve – Proposed (Alzh-3DCNN-Attention) |
Five confusion matrices, for models (M1 to Proposed) are shown in Figure 7, for AD with three classes: AD, CN, and MCI. Figure 7 presents confusion matrices comparing the classification outcome of different models-C3D, M1, M2, M3, and the proposed approach. Each matrix displays the class-wise precision, recall, and F1-score providing an inclusive overview of how effectively each model distinguishes between the three diagnostic categories. The C3D model shows relatively poor performance, particularly in classifying MCI cases, with only 190 correctly identified and a significant number misclassified as CN or AD. Model M1 improves upon this with 300 AD, 1142 CN, and 190 MCI correctly classified, demonstrating better balance across all classes. M2 shows comparable performance to M1 but exhibits slightly more confusion between CN and MCI. Model M3 further improves AD classification, correctly identifying 318 AD cases, although it still misclassifies a considerable number of CN instances as MCI. Among all, the proposed Alzh-3DCNN-Attention model achieves the highest classification accuracy. It correctly identifies 315 AD, 1192 CN, and 186 MCI cases, with notably reduced confusion between CN and MCI. This proves the effectiveness of integrating attention mechanisms into the 3D CNN framework allowing the model to better capture subtle distinctions between cognitively similar classes. Our proposed model outperforms traditional C3D and baseline models.
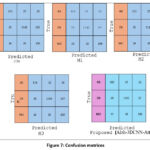 |
Figure 7: Confusion matrices |
Comparative analysis
We need to compare the performance of the proposed approach with recent, existing techniques of a similar type. For fair comparison, we used some popular and recent methods in the literature for AD diagnosis. For comparative analysis in 2 classes (AD vs. CN), some recent methods,32,34,59-63 are used and shown in the table. All the models were experimented with using the ADNI dataset for a fair comparison. We evaluated the usefulness of each method using different criteria such as sensitivity, AUC, specificity, and accuracy.
Table 3 provides a comprehensive evaluation of many models used for classification into two classes of AD, distinguishing between AD and CN. Liu et al31 slightly outperformed the previous model in both accuracy (90.56%) and AUC (95.75%), but again lacked sensitivity and specific metrics. Hosseini et al32 provide an accuracy of 84.50%. Lian et al59 reported an accuracy of 90.00% with an AUC of 95.00%, though sensitivity and specificity were not provided. The approach given by Lin et al61 showed a comparatively lower accuracy of 82.00% and an AUC of 81.00%, representing a moderate discriminative ability. Approach given by, Oh et al34 and So et al62 achieved accuracy of 85.00% and 84.50% respectively, but did not report other performance metrics. Next, Tufail et al63 is one of the few prior works that reported all major metrics except AUC. Their model achieved 89.21% accuracy, 87.32% sensitivity, and 91.18% specificity, indicating a well-balanced classification performance. In contrast, our proposed approach (Alzh-3DCNN-Attention) achieved the highest overall accuracy of 91.67%, along with a sensitivity of 93.30%, a specificity of 90.20%, and an AUC of 95.33%. Overall, the proposed approach has better accuracy for detecting AD cases (high sensitivity) and correctly identifying CN cases (high specificity). Moreover, high AUC confirms the robustness of the approach for two class classification.
Table 3: Comparative Analysis in 2 classes (AD vs CN) of ADNI
| Model | Accuracy (AD vs CN) | Sensitivity | Specificity | AUC |
| Liu et al31 | 90.56 % | — | — | 95.75% |
| Hosseini et al32 | 84.50% | — | — | — |
| Lian et al59 | 90.00 % | — | — | 95.00% |
| Lin et al61 | 82.00% | — | — | 81% |
| So et al62 | 85% | — | —- | —- |
| Tufail et al63 | 89.21% | 87.32% | 91.18% | —- |
| Proposed approach (Alzh-3DCNN-Attention) | 91.67% | 93.30% | 90.20% | 95.33% |
Table 4 shows a complete comparison of recent deep learning models. The approach given by Hosseini et al32 implemented a deep learning model combining structural MRI with clinical data. While their approach attained a high classification accuracy of 89%, the absence of sensitivity, specificity, and AUC values limits the ability to assess its clinical applicability. Next, Payan et al33 employed a 3D convolutional auto-encoder followed by a classifier to extract volumetric features from structural MRI data. Their model attained a high overall accuracy of 89.47%, though sensitivity, specificity, and AUC were not reported. Further, Khagi and Kwon64 used a handcrafted feature extraction using a DL network for the classification. Their approach attained an accuracy of 74.55%, sensitivity of 84.39%, specificity of 90.98%, and a high AUC of 98.42%. While the AUC is commendable, the overall accuracy indicates limitations in class discrimination, particularly for subtle transitions such as MCI. Further, Folego et al65 their model achieved 76.00% accuracy with a balanced sensitivity of 83.00%, specificity of 85.00%, and AUC of 88% suggesting reasonably good generalization performance. Next, Karasawa et al66 proposed a CNN model optimized for early diagnosis tasks using 3D imaging and attained 87% accuracy. Though they did not report other evaluation metrics. The proposed approach (Alzh-3DCNN-Attention) demonstrates superior performance in all measured aspects of the multi-class classification task. The model achieved highest accuracy of 91.54%, sensitivity 89.75%, specificity 92.35%, and an AUC of 98.70% which show excellent classification performance across AD, MCI, and CN categories.
Table 4: Comparative analysis in 3 classes (AD vs. CN vs. MCI) of ADNI
| Model | Accuracy(AD vs MCI vs CN) | Sensitivity | Specificity | AUC |
| Hosseini et al32 | 89% | — | — | — |
| Payan et al33 | 89.47% | — | — | — |
| Khagi and Kwon64 | 74.55% | 84.39% | 90.98% | 98.42% |
| Folego et al65 | 76.00% | 83.00% | 85.00% | 88% |
| Karasawa et al66 | 87% | — | —- | — |
| Proposed approach (Alzh-3DCNN-Attention) | 91.54% | 89.75% | 92.35% | 98.70% |
The proposed model exhibits exceptional discriminative power over multiple thresholds, outperforming previous models even in this critical evaluation metric.
Discussion
The experimental evaluation demonstrates that the proposed Alzh-3DCNN-Attention model surpasses baseline 3D CNN variants and the C3D framework in both binary and multi-class settings. The superior performance is primarily attributed to the integration of volumetric 3D convolutions with the Convolutional Block Attention Module (CBAM), which enables selective enhancement of discriminative regions while preserving spatial context. This design facilitates the extraction of subtle neuroanatomical signatures that are often overlooked in conventional 2D approaches. A key outcome is the model’s ability to achieve high sensitivity in AD detection and strong specificity in distinguishing CN subjects, both of which are crucial for clinical reliability. Notably, the framework also achieved the highest precision for MCI classification, though recall remained relatively lower, reflecting the inherent heterogeneity of MCI as a transitional stage between CN and AD. This observation aligns with prior reports in the literature and underscores the need for larger and more balanced datasets to improve sensitivity in this class. Compared with state-of-the-art techniques, the proposed model achieved faster convergence, lower validation loss, and improved stability during training, indicating that the attention mechanism provides an effective form of regularization. Confusion matrix analysis further confirmed a reduction in misclassification between CN and MCI, a challenge frequently encountered in earlier works. Clinically, the achieved accuracy, sensitivity, and specificity highlight the model’s potential for deployment as a computer-aided diagnostic tool. However, reliance on the ADNI dataset limits generalizability, and future work should consider cross-cohort validation, multimodal imaging integration, and explain ability frameworks to enhance interpretability. In summary, the findings confirm that attention-augmented 3D CNNs represent a robust and clinically meaningful direction for automated AD diagnosis, advancing beyond current state-of-the-art methods while addressing critical challenges in early detection.
Conclusion
In this work, we proposed a modified C3D architecture (Alzh-3DCNN-Attention) enhanced with sequentially connected 3D convolutional blocks to effectively capture multiscale features of brain MR images for Alzheimer’s disease classification. By leveraging 3D CNNs, our method preserves the volumetric integrity of MRI data, while the integrated attention-based feature recalibration module enables the network to emphasize disease-relevant brain regions. The proposed model achieved an accuracy of 91.54%, with a sensitivity of 89.75%, specificity of 92.35%, and an AUC of 98.70%, demonstrating superior performance compared with several state-of-the-art approaches. These findings confirm the potential of the proposed framework as a reliable computer-aided diagnostic tool, particularly in distinguishing MCI from AD and CN. Overall, our results indicate that attention-enhanced 3D deep learning architectures can meaningfully support clinicians in early and accurate AD diagnosis. Future research may extend this work by incorporating multi-modal data and further optimizing the architecture to strengthen generalizability.
Acknowledgement
The author would like to express deepest gratitude to Graphic Era Deemed to be University for providing the opportunity, resources, and academic environment necessary to carry out this research. The Department of Computer Science and Engineering, Graphic Era Deemed to be University of Dehradun is highly appreciated for allowing the computer laboratory work.
The author sincerely thankful to the research supervisor, Dr. Kamlesh Purohit, and Dr. Manoj Diwakar for their invaluable guidance, continuous support, and insightful feedback throughout the course of this study. Their expertise and encouragement have been instrumental in shaping the direction and quality of this work.
Funding Sources
The author(s) received no financial support for the research, authorship, and/or publication of this article.
Conflict of Interest
The author(s) do not have any conflict of interest.
Data Availability Statement
This statement does not apply to this article
Ethics Statements
This research did not involve human participants, animal subjects, or any material that requires ethical approval.
Informed Consent Statement
This study did not involve human participants, and therefore, informed consent was not required.
Clinical Trial Registration
This research does not involve any clinical trials.
Permission to reproduce material from other sources
Not Applicable
Authors’ Contribution
- Upendra Singh : Conceptualization, Methodology.
- Vidit Kumar : Data Collection, Analysis, Writing – Original Draft.
- Bhasker Pant : Resources, Supervision, Writing – Review
References
- Alzheimer’s Association. 2019 Alzheimer’s disease facts and figures. Alzheimers Dement. 2019; 15(3): 321-387. doi:10.1016/j.jalz.2019.01.010.
CrossRef - Apostolova LG. Alzheimer disease. Continuum Lifelong Learn Neurol. 2016;22(2):419-434.
CrossRef
- Huang Y, Xu J, Zhou Y, Tong T, Zhuang X, Initiative AsDN. Diagnosis of Alzheimer’s disease via multi-modality 3D convolutional neural network. Front Neurosci. 2019;13:509.
CrossRef
- Burton EJ, McKeith IG, Burn DJ, Williams ED, O’Brien JT. Cerebral atrophy in Parkinson’s disease with and without dementia: a comparison with Alzheimer’s disease, dementia with Lewy bodies and controls. Brain. 2004;127(4):791-800.
CrossRef - Mu Y, Gage FH. Adult hippocampal neurogenesis and its role in Alzheimer’s disease. Mol Neurodegener. 2011;6:1-9.
CrossRef
- Schuff N, Woerner N, Boreta L, et al. MRI of hippocampal volume loss in early Alzheimer’s disease in relation to ApoE genotype and biomarkers. Brain. 2009;132(4):1067-1077.
CrossRef - Long X, Zhang L, Liao W, Jiang C, Qiu B. the Alzheimer’s Disease Neuroimaging I. Distinct laterality alterations distinguish mild cognitive impairment and Alzheimer’s disease from healthy aging: Statistical parametric mapping with high resolution MRI. Hum Brain Mapp. 2013;34(12):3400-10.
CrossRef - Frisoni GB, Fox NC, Jack Jr CR, Scheltens P, Thompson PM. The clinical use of structural MRI in Alzheimer disease Nat Rev Neurol. 2010;6(2):67-77.
CrossRef - Lemprière S. New tools could improve Alzheimer disease diagnosis from structural MRI. Nat Rev Neurol. 2020;16(6):297.
CrossRef
- Klöppel S, Stonnington CM, Chu C, et al. Automatic classification of MR scans in Alzheimer’s disease. Brain. 2008;131(3):681-689.
CrossRef - Long X, Wyatt C. An automatic unsupervised classification of MR images in Alzheimer’s disease. IEEE; 2010:2910-2917.
CrossRef - Gutman B, Wang Y, Morra J, Toga AW, Thompson PM. Disease classification with hippocampal shape invariants. Hippocampus. 2009;19(6):572-578.
CrossRef - Silveira M, Marques J. Boosting Alzheimer disease diagnosis using PET images. IEEE; 2010:2556-2559.
CrossRef - Zhang D, Wang Y, Zhou L, Yuan H, Shen D, Initiative AsDN. Multimodal classification of Alzheimer’s disease and mild cognitive impairment. Neuroimage. 2011;55(3):856-867.
CrossRef - Peng J, Zhu X, Wang Y, An L, Shen D. Structured sparsity regularized multiple kernel learning for Alzheimer’s disease diagnosis. Pattern recognition. 2019;88:370-382.
CrossRef - Zeng N, Qiu H, Wang Z, Liu W, Zhang H, Li Y. A new switching-delayed-PSO-based optimized SVM algorithm for diagnosis of Alzheimer’s disease. Neurocomputing. 2018;320:195-202.
CrossRef - Zayed, N., Eldeep, G., & Yassine, I. A. (2025). Classification method based on surf and sift features for alzheimer diagnosis using diffusion tensor magnetic resonance imaging. Sci Rep. 2025;15(1):9782.
CrossRef - Hechkel, W., & Helali, A. (2025). Early detection and classification of Alzheimer’s disease through data fusion of MRI and DTI images using the YOLOv11 neural network. Front Neurosci. 2025;19:1554015.
CrossRef
- Tan M, Le Q. Efficientnet: Rethinking model scaling for convolutional neural networks. PMLR; 2019:6105-6114.
- Suk H-I, Lee S-W, Shen D, Initiative AsDN. Latent feature representation with stacked auto-encoder for AD/MCI diagnosis. Brain Struct Funct. 2015;220:841-859.
CrossRef
- Liu F, Shen C. Learning deep convolutional features for MRI based Alzheimer’s disease classification. arXiv preprint arXiv:14043366. 2014;
- Hosseini-Asl E, Keynton R, El-Baz A. Alzheimer’s disease diagnostics by adaptation of 3D convolutional network. IEEE; 2016:126-130.
CrossRef - Wang H, Shen Y, Wang S, et al. Ensemble of 3D densely connected convolutional network for diagnosis of mild cognitive impairment and Alzheimer’s disease. Neurocomputing. 2019;333:145-156.
CrossRef - Zhang J, Zheng B, Gao A, Feng X, Liang D, Long X. A 3D densely connected convolution neural network with connection-wise attention mechanism for Alzheimer’s disease classification. Magn Reson Imaging. 2021;78:119-126.
CrossRef
- Cheng X, Zhang Y, Chen Y, Wu Y, Yue Y. Pest identification via deep residual learning in complex background. Comput Electron Agric. 2017;141:351-356.
CrossRef
- Billones CD, Demetria OJLD, Hostallero DED, Naval PC. DemNet: a convolutional neural network for the detection of Alzheimer’s disease and mild cognitive impairment. IEEE; 2016:3724-3727.
CrossRef - Szegedy C, Liu W, Jia Y, et al. Going deeper with convolutions. 2015:1-9.
CrossRef - Lim BY, Lai KW, Haiskin K, et al. Deep learning model for prediction of progressive mild cognitive impairment to Alzheimer’s disease using structural MRI. Front Aging Neurosci. 2022;14:876202.
CrossRef
- Yan B, Li Y, Li L, et al. Quantifying the impact of Pyramid Squeeze Attention mechanism and filtering approaches on Alzheimer’s disease classification. Comput Biol Med. 2022;148:105944.
CrossRef
- Goenka N, Tiwari S. AlzVNet: A volumetric convolutional neural network for multiclass classification of Alzheimer’s disease through multiple neuroimaging computational approaches. Biomed Signal Process Control. 2022;74:103500.
CrossRef
- Liu M, Cheng D, Yan W, Initiative AsDN. Classification of Alzheimer’s disease by combination of convolutional and recurrent neural networks using FDG-PET images. Front Neuroinform. 2018;12:35.
CrossRef
- Hosseini-Asl E, Gimel’farb G, El-Baz A. Alzheimer’s disease diagnostics by a deeply supervised adaptable 3D convolutional network. arXiv preprint arXiv:160700556. 2016;
- Payan A, Montana G. Predicting Alzheimer’s disease: a neuroimaging study with 3D convolutional neural networks. arXiv preprint arXiv:150202506. 2015;
- Oh K, Chung Y-C, Kim KW, Kim W-S, Oh I-S. Author correction: Classification and visualization of Alzheimer’s disease using volumetric convolutional neural network and transfer learning. Sci Rep. 2020;10:5663.
CrossRef
- Nguyen A, Yosinski J, Clune J. Deep neural networks are easily fooled: High confidence predictions for unrecognizable images. 2015:427-436.
CrossRef - Zeiler MD, Fergus R. Visualizing and understanding convolutional networks. Springer; 2014:818-833.
CrossRef - Donahue J, Jia Y, Vinyals O, et al. Decaf: A deep convolutional activation feature for generic visual recognition. PMLR; 2014:647-655.
- Sharif Razavian A, Azizpour H, Sullivan J, Carlsson S. CNN features off-the-shelf: an astounding baseline for recognition. 2014:806-813.
CrossRef - Ahsan MM, Luna SA, Siddique Z. Machine-learning-based disease diagnosis: A comprehensive review. MDPI; 2022:541.
CrossRef - Falahati F, Westman E, Simmons A. Multivariate data analysis and machine learning in Alzheimer’s disease with a focus on structural magnetic resonance imaging. Journal of Alzheimer’s disease. 2014;41(3):685-708.
CrossRef - Haller S, Lovblad KO, Giannakopoulos P. Principles of classification analyses in mild cognitive impairment (MCI) and Alzheimer disease. J Alzheimer’s Dis. 2011;26(s3):389-394.
CrossRef
- Raut A, Dalal V. A machine learning based approach for early detection of Alzheimer’s disease by extracting texture and shape features of the hippocampus region from MRI scans. Int J Adv Res Comput Commun Eng. 2017;6(6):320-325.
CrossRef - Bernal J, Kushibar K, Asfaw DS, et al. Deep convolutional neural networks for brain image analysis on magnetic resonance imaging: a review Artif Intell Med. 2019;95:64-81.
CrossRef - Lundervold AS, Lundervold A. An overview of deep learning in medical imaging focusing on MRI. Zeitschrift fuer medizinische Physik. 2019;29(2):102-127.
CrossRef - Razzak MI, Naz S, Zaib A. Deep learning for medical image processing: Overview, challenges and the future. Classif BioApps Autom Decis Making. 2017:323-350.
CrossRef
- Sethi M, Ahuja S, Rani S, Koundal D, Zaguia A, Enbeyle W. [Retracted] An Exploration: Alzheimer’s Disease Classification Based on Convolutional Neural Network. Biomed Res Int. 2022;2022(1):8739960.
CrossRef
- Khojaste-Sarakhsi M, Haghighi SS, Ghomi SF, Marchiori E. Deep learning for Alzheimer’s disease diagnosis: A survey. Artif Intell Med. 2022;130:102332.
CrossRef
- Odusami M, Maskeliūnas R, Damaševičius R, Misra S. ResD hybrid model based on ResNet18 and DenseNet121 for early Alzheimer disease classification. Springer; 2021:296-305.
CrossRef - Solano-Rojas B, Villalón-Fonseca R. A low-cost three-dimensional DenseNet neural network for Alzheimer’s disease early discovery. Sensors. 2021;21(4):1302.
CrossRef - Ruiz J, Mahmud M, Modasshir M, Shamim Kaiser M, Alzheimer’s Disease Neuroimaging Initiative ft. 3D DenseNet ensemble in 4-way classification of Alzheimer’s disease. Springer; 2020:85-96.
CrossRef - Solano-Rojas B, Villalón-Fonseca R, Marín-Raventós G. Alzheimer’s disease early detection using a low cost three-dimensional Densenet-121 architecture. In: Jmaiel M, Mokhtari M, Abdulrazak B, Aloulou H, Kallel S (eds). The Impact of Digital Technologies on Public Health in Developed and Developing Countries. ICOST 2020. Lecture Notes in Computer Science, vol 12157. Springer, Cham; 2020. p. 3-15.
CrossRef - Ebrahimi A, Luo S, Chiong R, Initiative AsDN. Deep sequence modelling for Alzheimer’s disease detection using MRI. Comput Biol Med. 2021;134:104537.
CrossRef
- Fulton LV, Dolezel D, Harrop J, Yan Y, Fulton CP. Classification of Alzheimer’s disease with and without imagery using gradient boosted machines and ResNet-50. Brain Sci. 2019;9(9):212.
CrossRef
- Jin D, Xu J, Zhao K, et al. Attention-based 3D convolutional network for Alzheimer’s disease diagnosis and biomarkers exploration. In: 2019 IEEE 16th International Symposium on Biomedical Imaging (ISBI 2019). IEEE, Venice, Italy; 2019. p. 1047-1051.
CrossRef - Jiang M, Yan B, Li Y, Zhang J, Li T, Ke W. Image classification of Alzheimer’s disease based on external-attention mechanism and fully convolutional network. Brain Sci. 2022;12(3):319.
CrossRef
- Wang S-H, Zhou Q, Yang M, Zhang Y-D. ADVIAN: Alzheimer’s Disease VGG-Inspired Attention Network Based on Convolutional Block Attention Module and Multiple Way Data Augmentation. Front Aging Neurosci. 2021;13:687456.
CrossRef
- Huo X, Own CM, Zhou Y, Wu N, Sun J. Multistage diagnosis of Alzheimer’s disease based on slice attention network. In: Pimenidis E, Angelov P, Jayne C, Papaleonidas A, Aydin M (eds). Artificial Neural Networks and Machine Learning – ICANN 2022. Lecture Notes in Computer Science, vol 13529. Springer, Cham; 2022. p. 255-266.
CrossRef - https://adni.loni.usc.edu/ Ad. ADNI dataset. https://adni.loni.usc.edu/
- Lian C, Liu M, Zhang J, Shen D. Hierarchical fully convolutional network for joint atrophy localization and Alzheimer’s disease diagnosis using structural MRI. IEEE Trans Pattern Anal Mach Intell. 2018;42(4):880-893.
CrossRef - Tran, D., Bourdev, L., Fergus, R., Torresani, L., & Paluri, M. (2015). Learning spatiotemporal features with 3d convolutional networks. In: Proc IEEE Int Conf Comput Vis; 2015:4489-4497.
CrossRef - Lin W, Lin W, Chen G, et al. Bidirectional mapping of brain MRI and PET with 3D reversible GAN for the diagnosis of Alzheimer’s disease. Alzheimer’s disease. Front Neurosci. 2021;15:646013.
CrossRef
- So J-H, Madusanka N, Choi H-K, Choi B-K, Park H-G. Deep learning for Alzheimer’s disease classification using texture features. Curr Med Imaging Rev. 2019;15(7):689-698..
CrossRef - Tufail AB, Anwar N, Othman MTB, et al. Early-stage Alzheimer’s disease categorization using PET neuroimaging modality and convolutional neural networks in the 2D and 3D domains. Sensors. 2022;22(12):4609.
CrossRef - Khagi B, Kwon G-R. 3D CNN design for the classification of Alzheimer’s disease using brain MRI and PET. IEEE Access. 2020;8:217830-217847.
CrossRef - Folego G, Weiler M, Casseb RF, Pires R, Rocha A. Alzheimer’s disease detection through whole-brain 3D-CNN MRI. Front Bioeng Biotechnol. 2020;8:534592.
CrossRef
- Karasawa H, Liu CL, Ohwada H. Deep 3D Convolutional Neural Network Architectures for Alzheimer’s Disease Diagnosis. In: Nguyen N, Hoang D, Hong TP, Pham H, Trawiński B (eds). Intelligent Information and Database Systems. ACIIDS 2018. Lecture Notes in Computer Science, vol 10751. Springer, Cham; 2018. p. 287-296.
CrossRef
Abbreviations List
AD- Alzheimer’s Disease,
3-D MRI – Three-Dimensional Magnetic Resonance Imaging, 3
D CNN – Three-Dimensional Convolutional Neural Network,
C3D – Convolutional 3D,
CN – Cognitively Normal,
DL – Deep Learning, Image-Classification,
MCI-Mild Cognitive Impairment.
ADNI -Alzheimer’s Disease Neuroimaging Initiative.
PET- Positron Emission Tomography.
ML-Machine learning,
ROI- Region of Interest,
AI-Artificial intelligence.

