
Manuscript accepted on :23-05-2025
Published online on: 18-07-2025
Plagiarism Check: Yes
Reviewed by: Dr. Yashraj Yadav and Dr. Soujania Singh
Second Review by: Dr. Manju Jakhar
Final Approval by: Dr. Ian James Martin
Ajay Kumar Shukla1 and Saurav Misra2*
1Department of Pharmacology, AIIMS Bhopal, Madhya Pradesh, India.
2Department of Pharmacology, Kalpana Chawla Government Medical College, Karnal, Haryana, India.
Corresponding Author E-mail:saurav181087@gmail.com
DOI : https://dx.doi.org/10.13005/bpj/3220
Abstract
Novel drugs often mean new treatment options and advances in health care for humanity. This study, which delves into the trends of drug approvals by the FDA in the last decade, from CY 2013 to 2022, is of significant importance to the medical community and policymakers in the pharmaceutical industry. US-FDA's free, open-source, online database for new drug approvals from 2013 to 2022 was used. US-FDA new drug approvals were analysed from 2013 to 2022 based on their numbers and impact, innovation, access, and predictability. The total number of drugs approved from 2013 to 2022 was 428 (average of 43 novel drugs/ year). 40% were first-in-class drugs. Access to novel drug approvals: 87% were first-cycle approvals, and 72% were approved in the US before other countries. Drug approval statistics: 26% priority reviews, 12% breakthrough approval, 16% fast track approval and 12% expedited approval among novel drug approvals. An impressive 98% of novel drug approvals successfully meet the PDUFA review goal dates, showcasing the effectiveness of the approval process. The most common drug class was anticancer drug (26%), and the most common administration route was oral (86%). One hundred two drugs have been approved with black box warnings, and 25 FDCs were approved from 2013 to 2022. The novel drug approvals during CY 2013-2022 were of high quality, as evidenced by their high impact, good access, and high predictability. Our study provides a comprehensive insight into FDA-approved drugs, offering valuable information to the medical community and policymakers in the pharmaceutical industry.
Keywords
Food and Drug Administration; First in class drugs; New Drug; New Drug Application (NDA); Prescription Drug User Fee Act (PDUFA)
Download this article as:| Copy the following to cite this article: Shukla A. K, Misra S. A Comprehensive Review of US-FDA Novel Drug Approvals from 2013-2022: An Observational Study. Biomed Pharmacol J 2025;18(3). |
| Copy the following to cite this URL: Shukla A. K, Misra S. A Comprehensive Review of US-FDA Novel Drug Approvals from 2013-2022: An Observational Study. Biomed Pharmacol J 2025;18(3). |
Introduction
Since its establishment in 1930, the Food and Drug Administration (FDA) has ensured the safety and efficacy of drugs. The 1962 amendments to the Food, Drug, and Cosmetic Act (FDCA) standardized the evaluation of new drugs through well-controlled studies. In 1987, the FDA formed two agencies: the Center for Drug Evaluation and Research (CDER) and the Center for Biologics Evaluation and Research (CBER). CDER serves as a consumer watchdog, promoting innovation and improving patient care for thousands of medications.1 It also regulates both prescription and over-the-counter drugs, including biological treatments and generic drugs.2 Every year, the CDER approves many novel biological and pharmaceutical products. Some drugs/products have yet to be utilised in clinical settings. While others, which are related to or similar to the previously approved drugs and products, compete with them in the market. Some medications are classified as new molecular entities (NMEs) during FDA reviews. These often contain active ingredients not previously approved by the FDA, either as individual drugs or in combination products. These products frequently provide patients with critical novel treatments.3 CBER regulates biological products for human use under federal laws like the Public Health Service Act and the Federal Food, Drug, and Cosmetic Act. It ensures these products are safe, effective, and accessible to those in need while educating the public on their proper use.4 FDA regulates the vast majority of products that account for 25% of all consumer expenditure in the US.5 The cost of research and development (R&D) has been increasing steadily over time on a logarithmic scale, doubling every nine years. This has led to an increase in the price of developing novel drugs. It has been noted that between CY1997 and 2011, the cost of each new pharmaceutical launched to the market averaged at least 4 billion US dollars, ranging from 3.7 billion to 11.8 billion.6 Drug development costs have significantly increased as a result of the focus on clinical trials to evaluate the effectiveness and safety of new medications. In the ten years between 1994 and 2003, the FDA approved an average of 34 novel drugs annually. From 2004 to 2011, this average increased to slightly over 26. The annual average from CY 2012 and CY 2018 was 40 new drugs yearly. This shows that the pace of innovative drug approvals stagnated until 2011, when it began to increase.7
The revisions of the Prescription Drug User Fee Act (PDUFA) and the introduction of new legislation are the two most important reasons that FDA standards for drug approval have changed. Two approaches are observing a current trend of speedy and rapid drug approvals and creating an atmosphere that favours new drug approvals. Examining trends in the FDA’s approval of novel drugs during the preceding ten years (CY 2013–2022) can help us determine the causes of those trends. Since important regulatory authorities are adopting and approving novel drugs, primary care physicians want to be informed about them.
Materials and Methods
The source of our study data was the US FDA’s free, open-source, online database for novel drug approvals from 2013 to 2022. A literature search was also conducted using electronic sources such as PubMed, clinicaltrials.gov, and the Cochrane database to find more drug-related information. The yearly report from the CDER contains a list of all the new drugs authorised during a specific year. The following criteria were used to categorise all of the pharmaceuticals included in the drug summary for the relevant year: Number of drugs approved annually, first cycle approval, first in class, first approval in the USA, PDUFA target date met, number of drugs approved for treatment, prevention, or diagnostic. We have also categorised the drugs based on routes of drug administration, pharmacological class, kind of approval received (or a combination of expedited approvals), and the number of FDCs and medications with black box warnings. Repurposed drug with new therapeutic indications were excluded from the study. The data was entered into MS Excel 2007 for tabulation and analysis. Our thorough research methods and use of descriptive statistics ensure the reliability and validity of our findings.
Results
Total drug approvals
During the calendar year 2013-2022, the US FDA approved 428 drugs, averaging 43 novel drugs per year. The maximum number of drugs was approved (N=59) in 2018, followed by (N=53) in 2020 and (N=50) in 2021. The lowest number of drugs was approved in 2016 (N=22), followed by 2013 (N=27) and 2022 (N=37). Figure 1(a) shows the treads from the previous ten years.
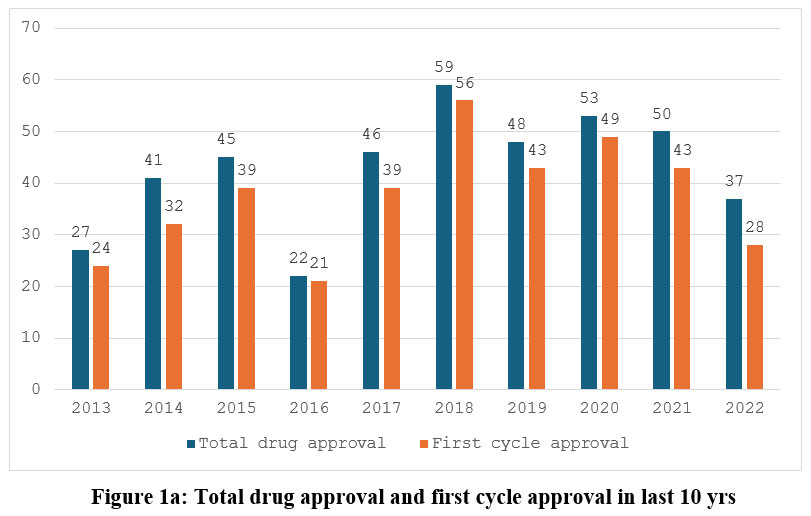 |
Figure 1a: Total drug approval and first cycle approval in last 10 yrsClick here to view Figure |
First cycle approval
Out of 428 approved drugs, 374 (87%) were first-cycle approvals in this time interval, with an average of 37 drugs per year. The CY 2016 and 2018 saw the highest percentage of first-cycle approvals (95% of all approved drugs), while 2022 and 2014 saw the lowest percentage (76% and 74%, respectively). Figure 1(a) depicts the trend of first-cycle approval.
The Prescription Drug User Fee Act (PDUFA) target date met
On analysis, from 2013 to 2022, the evaluation of innovative drug approvals showed that 418 medicines, or 98% of total approvals, met or exceeded PDUFA goal dates. The highest percentage was 100% in 2013, 2018, 2019, and 2020, while the lowest was 91% in 2017.Figure 1(b) displays the pattern of PDUFA goal dates achieved yearly.
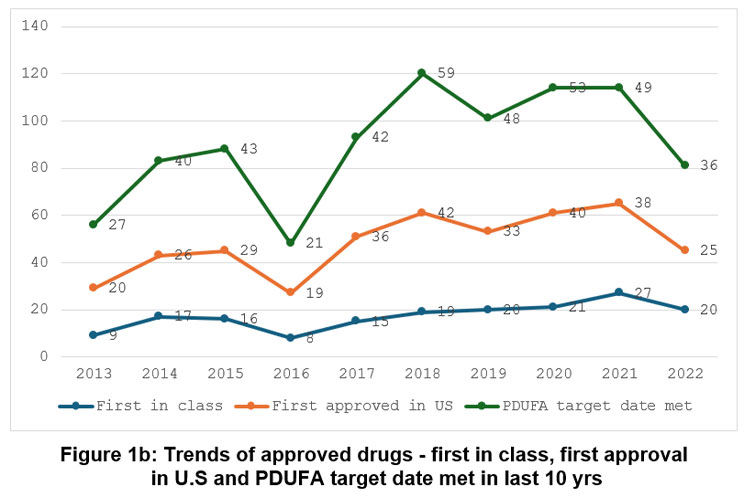 |
Figure 1b: Trends of approved drugs – first in class, first approval in U.S and PDUFA target date met in last 10 yrs |
First in Class drugs
Out of a total of 428 drugs approved in the last 10 years, 172 (40%) belong to the first-in-class category. The maximum number of drugs that were approved first in class in CY 2021 and CY 2022 was 54% each year, while the minimum was 32% each year in 2017 and 2018. The pattern of first-in-class drugs year-wise is shown in Figure 1(b).
First approval in USA before other countries
From 2013 to 2022, the number of drugs approved in the USA before other countries was 308 (72%). In 2016, a maximum of 86% of drugs were first approved in the USA, followed by 2017 (78%), while the minimum in CY 2014 (61%) and 2015 (62%), respectively. The pattern of first approval in the USA is shown in Figure 1(b).
Drug approval statistics
On average, 12% (N=122) of novel drugs received breakthrough approval, while 16% (N=155) received fast-track approval. Similar to this, over the past ten years, 12% (N=122) received expedited approval, 26% (N=258) received priority approval, and 28% (N=280) received accelerated approval. Table 1 provides each year’s approvals (precise number and percentage).
Table 1: Trends of new drug approval in last 10 yrs
| Sr No | Year (Total Approved) | Fast Track Approval N (%) | Breakthrough Therapy N (%) | Accelerated Approval N (%) | Priority Review N (%) | Expediated ReviewN (%) |
| 1 | 2013 (27) | 10 (37) | 03 (11) | 02 (07) | 10 (37) | 13 (48) |
| 2 | 2014 (41) | 17 (41) | 09 (22) | 08 (20) | 25 (61) | 27 (66) |
| 3 | 2015 (45) | 14 (31) | 10 (22) | 06 (13) | 24 (53) | 27 (60) |
| 4 | 2016 (22) | 08 (36) | 07 (32) | 06 (27) | 15 (68) | 16 (73) |
| 5 | 2017 (46) | 18 (39) | 17 (37) | 06 (13) | 28 (61) | 28 (61) |
| 6 | 2018 (59) | 24 (41) | 14 (24) | 04 (7) | 43 (73) | 43 (73) |
| 7 | 2019 (48) | 17 (35) | 13 (27) | 09 (19) | 28 (58) | 29 (60) |
| 8 | 2020 (53) | 17 (32) | 22 (42) | 12 (23) | 30 (57) | 36 (68) |
| 9 | 2021 (50) | 18 (36) | 14 (28) | 14 (28) | 34 (68) | 37 (74) |
| 10 | 2022 (37) | 12 (32) | 13 (35) | 06 (16) | 21 (37) | 24 (65) |
| (428) | 155 (36) | 134 (28) | 73 (17) | 258 (57) | 280 (65) |
Drug pharmacological class
The most common drug class was anticancer drugs, which constituted 26% (N=111), followed by antimicrobial drugs, 14% (N=61), and drugs acting on CNS (13%) over the past ten years, respectively. Table 2 shows different pharmacological classes of drugs over the past ten years.
Table 2: Drug designation summary overview of last 10 yrs
| Sr no | Drug class | 2013 | 2014 | 2015 | 2016 | 2017 | 2018 | 2019 | 2020 | 2021 | 2022 | Total |
| 1 | Anticancer drugs | 07 | 09 | 14 | 04 | 09 | 19 | 10 | 14 | 15 | 10 | 111 (26) |
| 3 | Drugs acting on CNS | 03 | 06 | 03 | 05 | 08 | 04 | 09 | 05 | 07 | 05 | 55(13) |
| 4 | Drugs acting on CVS | 02 | 02 | 04 | — | 01 | — | 01 | — | 02 | 01 | 13(3) |
| 5 | Drugs acting on ANS | — | — | — | — | — | — | — | 02 | 01 | — | 03(1) |
| 6 | Autocoids and related drugs | — | — | — | — | 01 | 04 | 03 | 02 | 01 | 01 | 12(3) |
| 6 | Respiratory system drugs | 02 | 03 | 01 | 01 | 01 | 01 | — | — | 01 | — | 10(2) |
| 7 | Hormones and related drugs | 04 | 04 | 04 | 01 | 07 | 02 | 03 | 08 | 03 | 02 | 38(9) |
| 8 | Drugs acting on Kidney | — | — | — | — | 01 | — | — | 01 | 01 | — | 03(1) |
| 9 | Drugs affecting Blood and Blood formation | 01 | — | 05 | 01 | — | 06 | 05 | 01 | 05 | 3 | 27(6) |
| 10 | Gastrointestinal drugs | — | 02 | 04 | 01 | — | 03 | 01 | 02 | 02 | 02 | 17(4) |
| 11 | Antimicrobial drugs | 04 | 11 | 04 | 04 | 08 | 12 | 04 | 08 | 04 | 02 | 61(14) |
| 12 | Genetic disorder drugs | — | 03 | 03 | — | — | 04 | 02 | 01 | 01 | 01 | 15(4) |
| 13 | Drug acting on skin and mucus membrane | — | — | — | 02 | 03 | 01 | 04 | 02 | 01 | 05 | 18(4) |
| 14 | Radiopharmaceuticals | 03 | — | — | 02 | — | — | 03 | 04 | 02 | 03 | 17(4) |
| 15 | Miscellaneous drugs | — | 02 | 01 | 01 | 02 | 02 | 01 | 02 | 03 | 02 | 16(4) |
Routes of drug administration
Over the past ten years, 214 drugs (86%) have been approved by oral routes. Similarly, other common routes of drug administration were the intravenous route (N=125;29%) and subcutaneous route (N=56;13%). Table 3 shows routes of drug administration.
Table 3: Summary of routes of drug administration of the approved drugs in last 10 yrs
| Sr No | Routes of drug administration | 2013 | 2014 | 2015 | 2016 | 2017 | 2018 | 2019 | 2020 | 2021 | 2022 |
| 1 | Oral | 17 | 19 | 26 | 07 | 23 | 35 | 25 | 25 | 24 | 13 |
| 2 | Intravenous | 05 | 15 | 10 | 09 | 11 | 14 | 12 | 22 | 16 | 11 |
| 3 | Intramuscular | — | — | 01 | — | — | 01 | 01 | — | 02 | 01 |
| 4 | Subcutaneous | 02 | 04 | 08 | 03 | 08 | 07 | 06 | 04 | 08 | 06 |
| 5 | Intradermal | 01 | — | — | — | — | — | — | — | — | — |
| 5 | Inhalational | 02 | 01 | — | — | — | — | — | — | — | 01 |
| 6 | Topical | 01 | 01 | — | 02 | 02 | 02 | 02 | 03 | — | 03 |
| 7 | Others | — | 01 | 02 | — | 02 | — | — | — |
Number of FDCs approved
Over the last ten years, 25 FDCs were approved, with a maximum of 3 in CY 2014, 2015, 2017, and 2022. Figure 2 shows the trends of FDC approval in the last ten years.
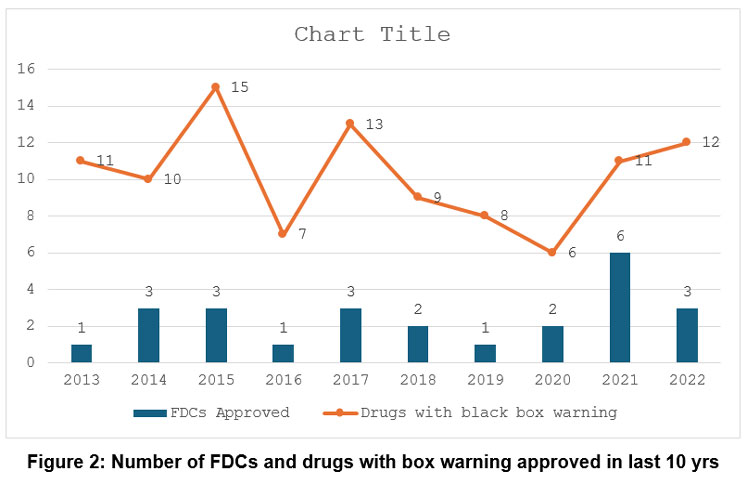 |
Figure 2: Number of FDCs and drugs with box warning approved in last 10 yrs |
Drugs with black box warning
A total of 102 drugs have been approved with a black box warning, with the maximum number of drugs in CY 2015 (N=15) followed by 2017 (N=13) and 2022 (N=12), respectively, as shown in Figure 2.
Discussion
A well-coordinated, multidisciplinary approach is taken in approving a drug through CDER. CDER carefully considers the benefits and risks of a proposed treatment before it approves a drug. Additionally, they must agree on the target patient population, the use, the labelling, and other relevant factors. This complexity requires the CDER to act as a unit. It is also essential to consider stakeholders’ opinions outside CDER and FDA. Scientists, patients, patient advocates, company representatives, academics, and other community members participate in the drug development and review. The knowledge and suggestions they provide are carefully considered. In order to improve and speed up the drug review process, CDER utilised several regulatory strategies. This strategy improves adaptability, efficiency, and relationships between CDER employees and drug developers. These approaches meet the FDA’s stringent safety and efficacy requirements while often shortening review times and facilitating access to new therapies for patients with critical illnesses. This is especially true in situations where there are no suitable alternatives.3,4
Data from various studies shows that between 1994 and 2003, the FDA approved an average of 37 new drugs annually. In the next eight years after that, from 2004 to 2011, this average was decreased to 26. From 2012-2018, 40 new drugs on average per year were approved.7,8 Our study concluded that from CY 2013 to 2022, an average of 43 new drugs were approved per year. This shows that the pace of innovative drug approvals stagnated until 2011 when it began to increase, and the trend continues.7 The decrease in good quality industry applications and a general drought in industry labs led to low drug approvals. At the same time, the increase in trend after 2011 may be because the US FDA has lowered some approval standards – particularly for cancer drugs and speeded up many of its reviews.9 The increase in new pharmaceuticals is also attributed to new leadership at the FDA and better guidance for businesses regarding the information that must be included in a new drug application.10 About 374 (87%) of the 428 medicines approved in the previous ten years were first cycle approvals, averaging 37 drugs per year. The high percentage of first-cycle approvals shows strong collaboration between CDER and drug developers. Therefore, applications must include all necessary data for thorough review.1
About 418 (98%) drugs achieved or exceeded PDUFA goal dates for application evaluation throughout the CY 2013–2022 study period. The Food and Drug Administration Safety and Innovation Act (FDASIA) was enacted in 2012 and was in effect from 2013 to 2017. The Food and Drug Administration Reauthorization Act (FDARA) is another law passed in 2017 and is in effect from 2017 to 2022. This new legislation includes renewing the Prescription Drug User Fee Act (PDUFA), which gives the FDA the tools to keep the review process for human drugs and biologics predictable and effective.11,12 PDUFA VI encourages the creation and use of 21st-century regulatory science, which aids in advancing medical innovation. It enhances the FDA’s biomarker qualification pathway, establishes a dedicated approach to better use biomarkers as surrogate endpoints in drug development, and aids in the rapid, practical regulatory evaluation of novel drugs. It examines how real-world evidence can be used to govern regulatory decisions. Furthermore, it makes it easier to apply cutting-edge clinical trial techniques to boost the effectiveness of the medication development process.13
According to the United States Food and Drug Administration (FDA), first-in-class (FIC) refers to newly approved drugs with an innovative mechanism of action distinct from already available treatments at the time of approval by the FDA’s CDER. FIC drugs provide fresh therapeutic possibilities for the management of illnesses that were previously incurable.14 About 40% of the 428 medications approved in the last ten years fell into the first-in-class category. Thus, overall, 172 first-in-class drugs were approved during the study period from 2013-2022, offering new treatment options that were previously unavailable to us. Therefore, first-in-class medications have an effect by making distinctive contributions to public health. Another way to gauge access is to look at which country approves new drugs first: the US or the rest of the world. Although there are significant differences between the FDA’s regulatory procedures and those of regulatory bodies in other countries, comparing approval rates in those nations provides a different indicator of the effectiveness of approval.15 Drugs first approved in the United States between CY 2013 and CY 2022 were 308 (72%). Before any other country, the US offered these cutting-edge therapeutic alternatives.
The United States Food and Drug Administration (FDA) offers four programmes that can be used individually or in combination to hasten the availability of drugs and therapeutic biologics. Priority reviews are a method of assigning personnel and resources to encourage access to innovation. Every application is subject to the designation of the FDA View. Instead of the ten months required for ordinary assessment, applications are reviewed in 6 months when given priority.16 As a result, quicker access to more cutting-edge drug treatments was encouraged without sacrificing clearance requirements. Our study showed that 258 novel drugs (26%) were prioritised in this period.
Fast Track is designed to hasten drug development and review for treating critical diseases and unmet medical needs. Novel drugs can be given fast-track approvals if they satisfy the following conditions: First, drug developers should frequently meet with the FDA to review the drug’s development strategy and ensure the proper evidence is collected to justify drug approval. Second, instead of waiting until every section of the New Drug Application (NDA) has been reviewed before the entire application can be examined, rolling review allows pharmaceutical companies to submit complete Biologic Licence Applications (BLA) or New Drug Applications (NDA) for FDA review. Usually, BLA or NDA review does not start until the pharmaceutical company applies to the FDA.17 If a drug no longer satisfies the criteria for classification, the FDA may revoke this designation.18 From 2013 to 2022, 155 (16%) novel drugs received fast-track approval.
The designation of a drug as a “breakthrough therapy” is intended to speed up the development and review of that drug for treating a serious condition when preliminary clinical evidence suggests that the drug may significantly outperform current therapies on one or more clinically significant endpoints. A drug labelled “Breakthrough Therapy” qualifies for every fast-track designation with intensive advice on a productive drug development programme, starting in Phase 1. Senior officials/managers are involved in the organisation’s commitment.17 In our study, 12% (N=122) of novel drugs received breakthrough approval. Realising that it can take some time to determine if a drug produces the desired clinical benefit, the FDA implemented the accelerated approval regulations in 1992. These rules permitted the approval of drugs for critical condition that met an unmet medical need based on a surrogate outcome. Faster FDA approval of these drugs was made possible by using a surrogate endpoint.17 In the last ten years. 28% (N=280) of novel drugs received accelerated approval.
Although our analysis evaluated expedited programme use at the indication level over ten years, there needed to be more than a direct comparison with existing literature. Nevertheless, our findings are generally in line with findings from earlier studies. Priority review is the initiative utilised the most frequently, and accelerated approval is the programme used the least frequently, according to our observations, which are consistent with other studies.19-21
The most prevalent pharmacological drug class during the past ten years has been anticancer drugs, which account for 26% (N=111), followed by antibacterial drugs at 14% (N=61), and drugs acting on the central nervous system at 13% (N=55). Cancer therapies produced more Track, expedited, and priority approvals between 2000 and 2017 than any other treatment modality.20,22-25 This statistic is particularly intriguing given that oncology accounted for most new drug approvals. Their recent approval rate may have been influenced by the ongoing need for cancer therapies and their demonstrated track record for getting accelerated approval (based on surrogate endpoints).26
The oral drug administration (50%) contributes the most to pharmaceutical drugs approved overall, followed by intravenous injection (29%) and subcutaneous delivery (13%). The results of our investigation were in agreement with that of Zhong H et al.27 The finding shows that oral drug administration is still the most desirable method due to high patient compliance and simplicity of use. It may be because oral administration, which includes practically all dose forms, such as solution, suspension, emulsion, powder, granule, capsule, tablet, and so on, has greater formulation design flexibility than other administration routes.27 In the last ten years. A total of 25 FDCs have been approved. According to a different survey, 145 FDCs were issued between 1980 and 2012, with an average of 45 FDCs being approved annually. According to this analysis, there were 12 FDC approvals in the 1980s and 59 in the 2000s.28 Pharmaceutical companies market fixed-dose combination (FDC) drugs just before generics of individual components are released to extend their patent and marketing exclusivity.28 After receiving initial regulatory approval, the FDA uses several methods to enhance drug safety, including safety communications, label modifications, and boxed warnings (BBWs). BBWs are crucial warnings that inform patients and healthcare professionals about serious adverse reactions, preventive measures to reduce risks, and limitations for the safe use of prescription medications.29 Most drugs (N=15) were approved with a black box warning in 2015, followed by N=13 in 2017 and N=12 in 2022. Similar to this, 111 BBWs were issued for drugs available on the US market from January 2008 to June 2015.30 A post-marketing BBW may be issued years after initial regulatory approval, and drugs approved with a BBW are more likely to receive one after US-FDA clearance.31,32
Strengths
We have objectively examined US-FDA approval data from 2013 to 2022 to determine the broad patterns. We gathered official documents’ approval data and examined their numbers under various headings and trends objectively. The created data analysis may be used for a longer period in the future. Our study offers the first in-depth analysis of US FDA-approved products and a deep analysis of the technical barriers alongside BBWs and FDCs during the study period.
Limitations
The study has some limitations. First, we could not determine how many new drug applications were rejected because we needed access to FDA data. Additionally, we could not study the clinical impact of documentation quality throughout the years. Furthermore, we cannot examine any causal relationships between the use of expedited programmes and drug approval or the security and effectiveness of the drugs. Second, this study did not evaluate the expedited programmes’ impact on medication development and licencing times.
Conclusion
FDA’s current strict yet practical and need-based system of drug approvals is an essential step in facilitating quick drug development. The FDA should embrace unique strategies that will inspire the industry in order to support the study and development of novel chemicals or medications that can significantly improve upon already available ones. The Prescription Drug User Fee Programme Act (PDUFA) VII, the Biosimilar User Fee Act (BsUFA) III, and other FDA user fee programmes were approved by Congress in September 2022. These initiatives support the agency’s mandate to promote public health by providing crucial funds to evaluate medicinal items. The results indicate that this tendency is likely to persist. Awareness of new drugs among primary care physicians is critical, as they have previously prescribed these agents. From 2013 to 2022, the quality of novel drug approvals has been high, indicated by their impact and accessibility. Our study overviews United States FDA-approved drugs and highlights two trends: faster drug approvals and an environment that supports new approvals. Examining trends in the FDA’s approval of novel drugs during the preceding ten years (CY 2013–2022) can help us determine the causes of those trends. Additionally, since they are adopting and approving these novel drugs due to key opinion leaders, primary care physicians want to be informed about them.
Acknowledgement
We would like to acknowledge the US FDA for using their online database.
Funding Sources
The author(s) received no financial support for the research, authorship, and/or publication of this article.
Conflict of Interest
The author(s) do not have any conflict of interest.
Data Availability Statement
This statement does not apply to this article.
Ethics Statement
This research did not involve human participants, animal subjects, or any material that requires ethical approval.
Informed Consent Statement
This study did not involve human participants, and therefore, informed consent was not required.
Clinical Trial Registration
This research does not involve any clinical trials
Permission to reproduce material from other sources
Not Applicable
Author Contribution
- Ajay Kumar Shukla- Study conception and design, review and editing, supervision.
- Saurav Misra- Study conception, methodology, Data collection, Data analysis and interpretation of results, Draft manuscript, review and editing
References
- Batta A, Kalra BS, Khirasaria R. Trends in FDA drug approvals over last 2 decades: an observational study. J Family Med Prim Care. 2020;9(1):105-114.
CrossRef - US Food and Drug Administration. Center for Drug Evaluation and Research. US Food and Drug Administration website. Updated February 29, 2024. Accessed June 26, 2023. https://www.fda.gov/about-fda/fda-organization/center-drug-evaluation-and-research-cder
- US Food and Drug Administration. Novel Drug Approvals for 2022. US Food and Drug Administration website. Updated January 2, 2025. Accessed June 26, 2023. https://www.fda.gov/drugs/new-drugs-fda-cders-new-molecular-entities-and-new-therapeutic-biological-products/novel-drug-approvals-2022
- US Food and Drug Administration. Center for Biologics Evaluation and Research (CBER). US Food and Drug Administration website. Updated May 13, 2025. Accessed June 26, 2023. https://www.fda.gov/about-fda/fda-organization/center-biologics-evaluation-and-research-cber
- Institute of Medicine (US) Forum on Drug Discovery, Development, and Translation. Challenges for the FDA: The Future of Drug Safety, Workshop Summary. National Academies Press (US); 2007. Accessed July 26, 2023. https://www.ncbi.nlm.nih.gov/books/NBK52919/
- Yildirim O, Gottwald M, Schüler P, Michel MC. Opportunities and challenges for drug development: public-private partnerships, adaptive designs and big data. Front Pharmacol. 2016;7:461.
CrossRef - Vahle JL, Hutto DL, Postema M. Drug discovery and preclinical development. In: Golan DE, Armstrong EJ, Armstrong AW, eds. Principles of Pharmacology. 4th ed. Wolters Kluwer Health; 2017:919-932.
- Shukla AK, Mehani R, Jain S, Maqsood S. Analysis of FDA novel drug approvals. Biomed Pharmacother. 2021;14(1):225-233.
CrossRef - Gardiner H. FDA officials, hoping to stave off critics, point to increased drug approvals. New York Times. November 4, 2011. Accessed June 26, 2023. https://www.nytimes.com/2011/11/04/ health/policy/drug-approvals-rise-for-fda.html
- Herper M. The truth about 2011’s new drug approvals. Forbes. July 18, 2011. Accessed June 26, 2023. https://www.forbes.com/sites/matthewherper/2011/07/18/the-truth-about-2011s-new-drug-approvals/
- US Food and Drug Administration. PDUFA V: fiscal years 2013-2017. US Food and Drug Administration website. Updated September 13, 2016. Accessed July 26, 2023. https://www.fda.gov/ industry/ prescription-drug-user-fee-amendments/pdufa-v-fiscal-years-2013-2017
- US Food and Drug Administration. PDUFA VI: fiscal years 2018-2022. US Food and Drug Administration website. Updated October 3, 2022. Accessed July 26, 2023. https://www.fda.gov/industry/ prescription-drug-user-fee-amendments/pdufa-vi-fiscal-years-2018-2022
- US Food and Drug Administration. PDUFA legislation and background: PDUFA IV. US Food and Drug Administration website. Updated May 3, 2016. Accessed July 26, 2023. https://www.phrma.org/ -/media/Project/PhRMA/PhRMA-Org/PhRMA-Org/PDF/P-R/PDUFA-Factsheet_PDUFA_VI_FINAL.PDF
- DCAT Value Chain Insights. The innovation makers: first-in-class new drug approvals. DCAT Value Chain Insights website. Published September 1, 2012. Accessed July 26, 2023. https://www.dcatvci.org/features/ the-innovation-makers-first-in-class-new-drug-approvals/
- Mehani R, Shukla AK. An introspection of quality of novel drug approvals by United States Food and Drug Administration. Int J Basic Clin Pharmacol. 2018;8(1):84-89.
CrossRef - US Food and Drug Administration. Priority review. US Food and Drug Administration website. Updated August 5, 2019. Accessed July 26, 2023. https://www.fda.gov/forpatients/approvals/fast/ucm4
- US Food and Drug Administration. Fast track. US Food and Drug Administration website. Updated August 13, 2024. Accessed July 26, 2023. https://www.fda.gov/patients/fast-track-breakthrough-therapy-accelerated-approval-priority-review/fast-track
- US Food and Drug Administration, US Dept of Health and Human Services. Guidance for industry: expedited programs for serious conditions—drugs and biologics. US Food and Drug Administration website. Updated November 28, 2023. Accessed July 26, 2023. https://www.fda.gov/downloads/Drugs/Guidances/ UCM358301.pdf
- Monge AN, Sigelman DW, Temple RJ, Chahal HS. Use of US Food and Drug Administration expedited drug development and review programs by orphan and nonorphan novel drugs approved from 2008 to 2021. JAMA Netw Open. 2022;5(11):e2239336.
CrossRef - Darrow JJ, Avorn J, Kesselheim AS. FDA approval and regulation of pharmaceuticals, 1983-2018. JAMA. 2020;323(2):164-176.
CrossRef - Kesselheim AS, Wang B, Franklin JM, Darrow JJ. Trends in utilization of FDA expedited drug development and approval programs, 1987-2014: cohort study. BMJ. 2015;351:h4633.
CrossRef - Mullard A. 2017 FDA drug approvals. Nat Rev Drug Discov. 2018;17(2):81-85.
CrossRef - Phillips AT, Desai NR, Krumholz HM, et al. Association of the FDA Amendment Act with trial registration, publication, and outcome reporting. Trials. 2017;18:333.
CrossRef - Miller JE, Wilenzick M, Ritcey N, Ross JS, Mello MM. Measuring clinical trial transparency: an empirical analysis of newly approved drugs and large pharmaceutical companies. BMJ Open. 2017;7:e017917.
CrossRef - Kaitin KI, DiMasi JA. Pharmaceutical innovation in the 21st century: new drug approvals in the first decade, 2000-2009. Clin Pharmacol Ther. 2011;89:183-188.
CrossRef - Beakes-Read G, Neisser M, Frey P, Guarducci M. Analysis of FDA’s Accelerated Approval Program Performance December 1992-December 2021. Ther Innov Regul Sci. 2022;56(5):698-703.
CrossRef - Zhong H, Chan G, Hu Y, Hu H, Ouyang D. A comprehensive map of FDA-approved pharmaceutical products. Pharmaceutics. 2018;10(4):263.
CrossRef - Hao J, Rodriguez-Monguio R, Seoane-Vazquez E. Fixed-dose combination drug approvals, patents and market exclusivities compared to single active ingredient pharmaceuticals. PLoS One. 2015;10(10): e0140708.
CrossRef - US Food and Drug Administration. Guidance for industry: warnings and precautions, contraindications, and boxed warning sections of labeling for human prescription drug and biological products – content and format. US Food and Drug Administration website. Published October 1, 2011. Accessed July 26, 2023. https://www.fda.gov/downloads/drugs/guidances/ucm075096.pdf
- Solotke MT, Dhruva SS, Downing NS, Shah ND, Ross JS. New and incremental FDA black box warnings from 2008 to 2015. Expert Opin Drug Saf. 2018;17(2):117-123.
CrossRef - Lester J, Neyarapally GA, Lipowski E, Graham CF, Hall M, Dal Pan G. Evaluation of FDA safety-related drug label changes in 2010. Pharmacoepidemiol Drug Saf. 2013;22(3):302-305.
CrossRef - Schick A, Miller KL, Lanthier M, Dal Pan G, Nardinelli C. Evaluation of pre-marketing factors to predict post-marketing boxed warnings and safety withdrawals. Drug Saf. 2017;40(6):497-503.
CrossRef

