
Manuscript accepted on :19-06-2025
Published online on: 30-06-2025
Plagiarism Check: Yes
Reviewed by: Dr. Alaa Saadi Abbood
Second Review by: Dr. Fatma Çavuş Yonar
Final Approval by: Dr. Patorn Piromchai
Driton Sopa1,2* , Antonino De Lorenzo1and Laura Di Renzo1
1Department of Biomedicine and Prevention, University of Rome "Tor Vergata", Division of Clinical Nutrition and Nutrigenomics, Rome, Italy
2Department of Clinical Biochemistry, University Clinical Center of Kosovo, Pristina, Kosovo
Corresponding Author E-mail: drdritonsopa@hotmail.com
DOI : https://dx.doi.org/10.13005/bpj/3189
Abstract
Individuals with DM2 were the subjects of this study. The nutritional intervention was made according to the IF food regime with a 6-hour feeding window of 24 hours, according to the low-calorie, low-carb diet (IF 6/24-LCD). Three checkpoints were used: phase T0, which was before to the intervention's commencement; phase T1, which was four weeks after the start of the intervention; and phase T2, which was the concluding phase, which was eight weeks after the intervention. The average results of the laboratory tests for TG/HDL ratio 3.23 ±0.36, Homa-IR 6.99±1.37, HbA1c 8.19± 1.21, and glycemia were 9.02± 1.78.In T2, the average weight loss based on BMI was 29.60±3.85 (p > 0.032), or a -9.4 ∆% percentage difference from T0. The average W/H-ratio was 0.98±0.04 to 0.957±0.02 (p > 0.005). The TG/HDL ratio ranged from 3.23±0.36 to 1.20±0.36 on average (p > 0.007). (P=0.036) HbA1c from 8.19±1.21 to 6.99±1.23. While ketonuria was found in the urine in both control phases T1 and T2, at 1.84± 0.81 mmol/L and 1.75±0.17 mmol/L, respectively, the presence of ketones in the urine was not observed in the T0 phase (0,195±0.07 mmol/L). The study's BMI/ketone correlation was negative, indicating that the nutritional intervention was beneficial based on IF-LCD. This is because the metabolic shift during lipolysis causes fat mass to decrease. It also resulted in a positive correlation between TG/HDL-ratio after nutritional intervention. To our knowledge, this is the first study of its kind conducted in Kosovo, offering novel insights for localized diabetes management strategies.
Keywords
DM2; Insulin resistance; Intermittent fasting; Low carbs diet; Metabolic syndrome; Obesity
Download this article as:| Copy the following to cite this article: Sopa D, Lorenzo A. D, Renzo l. D. Impact of a Low-carb Diet on Obese Patients with Type 2 Diabetes Based on the Intermittent Fasting Regimen. Biomed Pharmacol J 2025;18(2). |
| Copy the following to cite this URL: Sopa D, Lorenzo A. D, Renzo l. D. Impact of a Low-carb Diet on Obese Patients with Type 2 Diabetes Based on the Intermittent Fasting Regimen. Biomed Pharmacol J 2025;18(2). Available from: https://bit.ly/3Gfb4HQ |
Introduction
Type 2 diabetes mellitus (T2DM) and obesity are two interrelated chronic metabolic disorders that pose a significant public health burden globally.1 The World Health Organization estimates that over 500 million people are living with diabetes, the majority of whom have T2DM, and this number continues to rise in parallel with obesity rates.2Obesity is a well-established risk factor for insulin resistance and T2DM, and its effective management is essential for glycemic control and reduction of diabetes-related complications.3Dietary intervention remains a cornerstone of T2DM management. Among various dietary strategies, low-carbohydrate diets (LCDs) have gained considerable attention for their potential to improve glycemic control, reduce insulin requirements, and promote weight loss.4 By limiting daily carbohydrate consumption to usually less than 130 grams, LCDs may improve insulin sensitivity and lower postprandial glucose excursion by changing energy metabolism to increased fat oxidation and ketone body formation.5 In parallel, intermittent fasting (IF), characterized by alternating periods of eating and fasting, has emerged as another promising approach for weight and glycemic control. Common IF regimens include time-restricted feeding (e.g., 16:8), alternate-day fasting, and the 5:2 diet. Evidence suggests that IF may enhance metabolic health by improving insulin sensitivity, reducing inflammation, and promoting autophagy.6,7
In individuals with T2DM, IF has been associated with reductions in HbA1c, body weight, and insulin requirements.8 The modernization of life, in parallel with the impact on food and nutrition, has also brought changes in the human lifestyle, making it more disconnected from nature and prone to a sedentary lifestyle.9 This essentially causes a metabolic imbalance in terms of energy intake and expenditure by the human body resulting in weight gain.10 There is a whole chain of disorders and health diseases such as metabolic syndrome, obesity, cardiovascular diseases, diabetes, autoimmune diseases, tumors, etc., which are attributed to a significant extent to these changes, in diet and lifestyle.11
The etiopathogenesis of the disease of diabetes is still unclear, but from many studies it appears that a series of changes of a metabolic and inflammatory nature occur much earlier than the appearance of the disease. We find this wide spectrum of precursor clinical and physiological changes in the metabolic syndrome, which is the paradigm of many changes during the prediabetic period, but also of many other diseases that it causes. Despite growing interest, few studies have investigated the combined effects of a low-carbohydrate diet and intermittent fasting, particularly in obese patients with T2DM. The integration of these two approaches may have synergistic effects on glycemic control, weight loss, and metabolic parameters. Nevertheless, additional data is required to elucidate their safety, effectiveness, and long-term viability in this particular demographic.
Type 2 diabetes mellitus (T2DM) is a growing public health concern in Kosovo, particularly among obese individuals. Lifestyle-based interventions such as low-carbohydrate diets and intermittent fasting (IF) have shown promise in improving glycemic control and reducing insulin resistance. However, their combined effect has not been studied in the Kosovar population. This study aims to evaluate the effects of a low-carbohydrate diet administered according to an intermittent fasting regimen in obese patients with T2DM.
Materials and Methods
This research is based on the experimental-observational methodology.
Procedure
The recruitment of patients was done in a randomized manner, in two periods during the months of January, February, March, May, and June 2022 in Pristina, Kosovo. Involvement in research and dynamics of clinical controls was done in consultation with the clinical specialist-endocrinologist. Designing the diet according to the LCD composition for the given calories was done with the help of a dietician. A one-week, repeatable dietary program was designed, recommended in three meals throughout the feeding window period, according to the composition of macronutrients and the IF (18/6) regime.
Inclusion and exclusion criteria
Patients’ criteria for inclusion in the study were: Patients with non-insulin-dependent type 2 diabetes; With a history of the disease no more than 6 years (period of morbidity); With at least 3 main clinical findings characteristic of the metabolic syndrome: hyperglycemia, dyslipidemia, and obesity according to BMI ≥ 25 kg/m2; Age from 20 to 65 years.However, the following were the exclusion criteria: Diabetes type 1, or DM1; individuals with additional internal illnesses, such as autoimmune disease, neoplastic disease, kidney failure, cardiomyopathy, and hepatitis (infectious, immune, and non-immune).
Food regime and diet
Nutrition was done according to the Intermittent fasting diet (IF 6/18) with a feeding window period of 5 to 6 hours in 24 hours. The feeding window period is divided in two meals with the main food and a meal in between (snack), dedicated mainly to fruits, some nuts or hazelnuts, etc. The caloric amount of the diet is low in calories (1300 kcal / 24 hours) (Table 1).
Table 1: Daily diet of one of the 7 days of the week
| Meals (time) | Meal 1 (16:00h) | Snack | Meal 2 (21:00h) |
| Day of the week | 300g baked chicken breastprepared with 1 tablespoon
(15g) olive oil 1 cup (150g) broccoli Half a cup (75g) carrot 1 tablespoon (15g) olive oil |
150g natural with 1 tablespoon (10g)flax seeds | Tunasalad
Green salad 1 carrot 1 pepper half a cup (50g) onion 2 cans (170g) tuna in oil add a little vinegar and salt |
Diet composition according to macronutrients:
Carbohydrates approximately 20% of daily calories (260-300 kcal/24 hours or about 70 grams).
Protein, not less than 1,5 g/kg/24 hours (about 400 kcal/24 hours or about 100 grams).
Fat (the rest of the daily calories, about 700 kcal/24 hours).
It was advised that all patients take a mix of vitamins and minerals and be properly hydrated. A caloric intake of 1300 kcal/24 hours is recommended for all patients without adjusting it according to weight and basal metabolism. This was done because it practically made it difficult to design a diet with such calories, since both, the weight and the value of basal metabolism would change during the intervention period in each patient in a relative measurement. Additionally, the fact that all patients had a high BMI was expected to have a high tolerance in terms of compensating the caloric deficit, which would be done at the expense of adipose tissue catabolism.
Comprehensive plan of action and monitoring of patients in the study
The interviews, history, and clinical/laboratory evaluations for the intervention’s progress were done at each of these control points. (T0), START, notification of the purpose, content and dynamics of the study. Before they could participate, every participant gave their informed consent. Evaluation of the clinical condition by a clinical specialist. Complete laboratory examination: Glycemia, Cholesterol, TG, HDL Chol., LDL Chol., TG/HDL Ratio, Insulinemia, C-Peptide, HbA1C, HOMA-IR, CRP, and ketonuria. Anthropometric measurement: BMI, waist circumference, hip circumference, W/H-ratio, and Basal Metabolic Rate (BMR).
(T1), 4th WEEK, medical history, and basic laboratory evaluation: Glycemia, cholesterol, triglyceride, LDL, HDL, insulin, HOMA-IR, and ketonuria. Anthropometric measurement: BMI, waist circumference, hip circumference, W/H-ratio, and Basal Metabolic Rate (BMR). (T2), WEEK 8, the clinical condition assessed during medical visit. Full laboratory examination: Glycemia, Cholesterol, TG, HDL Chol., LDL Chol, TG/HDL Ratio, Insulinemia, C-Peptide, HbA1C, Homa-IR, CRP, and ketonuria. Anthropometric measurement: BMI, waist circumference, hip circumference, W/H-ratio, and Basal Metabolic Rate (BMR).
Sample preparation and analyses
Blood, urine BMI, WC, and HC samples were collected in the morning. The preparation of blood samples was done according to the conditions and standards required by the technology applied by the manufacturers of laboratory kits. All laboratory parameters are performed with kit reagents ready for installation in dedicated auto-analyzers. Calibrations and internal quality controls have been applied by ROCHE-diagnostic, and have been fully dedicated to the platforms used and are of full quantitative measurements. Immunoassay measurements such as Insulin and C-peptide were performed on the Cobase 400 Roche diagnostic platform (Immuno-Autoanalyzer). Photometric measurements for parameters: Glycemia, Cholesterol, TG, HDL, Chol., LDL, Chol., TG/HDL Ratio, Insulinemia, C-Peptide, HbA1C, Homa-IR, CRP were performed on the Cobas Integra 400 Roche plus, diagnostic platform (Photometer-Autoanalyzer).
Ketones were measured with urine strips (Ketostix) according to the semi-quantitative standard (measurement range 0.5 to 10 mmol/L). Circumference measurements were made with a tape measure graduated by 0.1cm. Waist circumference (WC) measurement was made 1 cm above the crista iliaca. Hip measurement (HC) was made at their most prominent points. Weight and length are measured with an instrument that has integrated both weight scale (accuracy 0.1 kg) and stadiometer (accuracy 0.1 cm) functions. BMI is calculated by the formula: BMI = body weight / height2 (kg/m2).
Statistical analysis
Statistical analysis was conducted in two main directions. First, descriptive statistics were used to summarize all variables, including the mean, standard deviation, and percentage change (Δ%) to assess differences across the three time points (T0, T1, and T2). Second, inferential statistics were applied to evaluate the significance of changes over time. Depending on the distribution of the data, either the paired t-test or the Wilcoxon signed-rank test was employed to determine whether the differences observed between time points were statistically significant, with results reported as p-values. Additionally, based on identified statistical trends, three correlation graphs were generated to illustrate key clinical relationships: (1) weight loss in parallel with reductions in cardiometabolic risk, (2) improvements in insulin sensitivity, and (3) reductions in atherogenic risk. All analyses were performed using METCALC statistical software. A p-value of less than 0.05 was considered indicative of statistical significance.
Results
(Kindly separate results and discussion heading)
During the recruitment phase, a total of 38 individuals were initially assessed through clinical examination and interviews. Of these, 32 participants met the inclusion criteria and consented to participate in the study following a detailed explanation of the dietary intervention and its medical implications. However, within the first week of the intervention, 8 participants withdrew. An additional 3 participants discontinued the intervention during the second week, and 1 participant withdrew after the first phase (T1), corresponding to the fourth week. Ultimately, 20 participants completed the full duration of the study and all phases of clinical assessment (Table 2). It is important to note that the primary reason for participant withdrawal was difficulty adhering to the dietary regimen; no adverse health events were reported as causes for discontinuation.
Table 2: General characteristics of the sample and the relationship with the disease
| No. of subjects in the study | 20 |
| Male | 14 |
| Female | 6 |
| Average age (years) | 49 |
| Period with diabetes (years) | 3.8 |
| Pharmacotherapy related to the disease(n)* | 16 |
| Obese (n)* (BMI>30) | 15 |
| Overweight(n)* (BMI>25) | 5 |
| Specific diet for diabetes or obesity (n)* | 6 |
| Regular physical or sports activity(n)* | 8 |
(n)*- express the number of individuals according to the respective features.
At all three time points assessing the progression of the intervention, statistically significant changes were observed in nearly all measured parameters. Overall, the most pronounced differences were noted between baseline (T0) and the first follow-up (T1), with more modest changes occurring between T1 and the final time point (T2). At baseline (T0), the anthropometric indicators reflected a general state of obesity among the majority of participants, as evidenced by the mean Body Mass Index (BMI) of 32.66 ± 3.83, exceeding the normal reference range (18.5–24.9). Similarly, the distribution of adiposity was predominantly visceral, as indicated by an elevated mean Waist-to-Hip (W/H) ratio of 0.98 ± 0.04, compared to standard cut-off values (<0.90 for men and <0.80 for women), suggesting a high metabolic risk profile. Individual assessments of hip circumference (HC), which averaged 104.3 ± 4.81 cm, and waist circumference (WC), which averaged 102.5 ± 4.79 cm, further corroborated this (Table 3). Both measurements were in line with fat distribution patterns linked to elevated cardiometabolic risk. Baseline readings in the laboratory tests showed atherogenic dyslipidemia, which is mainly defined by high triglycerides and unfavorable cholesterol fractions.
Therefore, the average TG/HDL-cholesterol ratio of 3.23± 0.36 is high in comparison to its normal value of 1.8, indicating a propensity for the atherogenic lipoprotein profile. HOMA-IR also has a fairly high value as an average of 6.99± 1.37, which is an indicator of high insulin resistance compared to the acceptable value of 1.9. This is also reflected by the rather high values of insulinemia as an average of 18.1 ± 2.96, compared with the BMI value, resulted in a direct relationship. The values found in HbA1c 8.19% ± 1.21 as an average reflect a poorly controlled hyperglycemia, specifically in the last 3 months. The presence of ketonuria is at a trace level only in 5 patients, while in the others it is not present, shows of, that ketosis was not induced either by the way of nutrition or any metabolic change in its favor. Moderate values of CRP as an average of 5.22± 0.67 mg/L do not reflect an acute inflammation or infectious state. Moderate CRP values such as mean 5.22± 0.67 mg/L do not reflect an acute inflammatory or infectious state (Table 3). This is considered important since such a condition would not reflect the basic condition even for many of the parameters in the study (in an acute inflammation or febrile condition, glycemia can increase above its average, in the context of diabetes). However, the CRP value above 1 mg/L still does not exclude the degree of low-grade inflammation, characteristic of the course of DM2 disease.
Table 3: The values obtained from descriptive statistics and statistical significance after comparisons between them
| Baseline | 4 weeks | 8 Weeks | ∆Base-Four weeks | ∆Four weeks-Eight weeks | ∆Base-Eight weeks | p Base-Four weeks | p Four weeks-Eight weeks | p Base-Eight weeks | |
| Glycemia | 9.02± 1.78 | 6.56± 1.20 | 5.83±0.77 | -2.46 | -0.74 | -3.20 | 0.0001 | 0.027 | 0.0001 |
| Cholesterol | 5.11± 0.55 | 4.65± 1.03 | 4.38±0.89 | -0.45 | -0.28 | -0.73 | 0.275 | 0.369 | 0.07 |
| TG | 3.22± 0.36 | 1.68± 0.52 | 1.38±0.40 | -1.55 | -0.29 | -1.84 | 0.0001 | 0.052 | 0.0001 |
| HDL | 1.04± 0.16 | 1.17± 0.10 | 1.16±0.10 | +0.14 | -0.02 | +0.11 | 0.0032 | 0.573 | 0.009 |
| LDL | 3.43± 0.38 | 2.92± 0.90 | 2.75±0.77 | -0.51 | -0.16 | -0.67 | 0.154 | 0.541 | 0.052 |
| TG/HDL | 3.23± 0.36 | 1.44± 0.47 | 1.20±0.36 | -1.79 | -0.24 | -2.02 | 0.0001 | 0.082 | 0.0001 |
| Insulinemia | 18.19 ± 2.96 | 9.34± 1.87 | 6.08±0.92 | -8.85 | -3.26 | -12.10 | 0.0001 | 0.0003 | 0.0001 |
| C-Peptide | 3.01± 0.19 | – | 1.89±0.21 | – | – | -1.20 | – | – | 0.0036 |
| HbA1c | 8.19± 1.21 | – | 6.99± 1.23 | – | – | – | – | ||
| HOMA-IR | 6.99± 1.37 | 2.67± 0.43 | 1.57±00.52 | -4.33 | -1.09 | -5.42 | 0.0001 | 0.0001 | 0.0001 |
| BMR | 1740± 158.8 | 1689 ± 129 | 1666±201 | -51.5 | -22.5 | -73.8 | 0.507 | 0.761 | 0.347 |
| Ketones | 0,195± 0.07 | 1.84±0.81 | 1.75± 0.17 | +1.7 | -0.10 | +1.60 | 0.0001 | 0.682 | 0.0001 |
| CRP | 5.22± 0.67 | 2.69± 0.42 | 1.86±0.55 | -2.53 | -0.84 | -3.37 | 0.0007 | 0.043 | 0.0001 |
| BMI | 32.66± 3.83 | 30.48± 2.67 | 29.60±3.85 | -2.17 | -0.89 | -3.06 | 0.137 | 0.490 | 0.0327 |
| WC | 102.5± 4.79 | 93.23± 4.01 | 90.16±11.60 | -9.29 | -3.07 | -12.36 | 0.037 | 0.422 | 0.0056 |
| HC | 104.3± 4.81 | 96.83± 4.06 | 94.22±12.25 | -7.45 | -2.61 | -10.06 | 0.117 | 0.518 | 0.0323 |
| W/H | 0.98± 0.04 | 0.96± 0.02 | 0.96±0.02 | -0.02 | -0.005 | -0.03 | 0.025 | 0.317 | 0.0058 |
Discussion
Table 3 presents integrally the values obtained for laboratory and anthropometric parameters in the three control points (T0, T1, T2). In the first control (T1) after the 4-week application of the IF (18/6) food regimen according to LCD, a difference in values was achieved in almost all the variables under consideration. This difference in the obtained values is evidenced through a descriptive statistic and is expressed as ∆% between T0 and T1. The BMI decreased by an average of 30.48±2.67 in T1 findings, or -6.6 ∆% as a percentage difference from BMI T0. Weight as an average of 88.9 kg or expressed as a percentage difference -6.61 ∆% compared to T0. Waist Circumference (WC) 93.23± 4.01 or -9.0 ∆% compared to T0. Hip Circumference (HC) in 96.83± 4.06 or -7.1 ∆% compared to T0. Improvement of the W/H ratio to 0.96± 0.02. The TG/HDL-cholesterol Ratio has been an average of 1.44± 0.47, which shows of a reduced risk of the atherogenic lipoprotein phenotype. HOMA-IR has an average of 2.67± 0.43, which is dedicated to the decrease of insulinemia values more than those of glycemia. Insulinemia resulted in a very significant decrease, the average reached to 9.34 ± 1.87 mUI/ml or -35 ∆% compared to T0. HbA1c at T1 was not measured, as the time of 4 weeks is too short to reflect changes in its values.
The presence of ketonuria as an average of 1.84 ± 0.81, is in almost every patient, unlike time T0 where it was almost absent in all patients. On average, the CRP readings decreased by 2.7 mg/L, suggesting that inflammation may have decreased. In the second control (T2), i.e. 8 weeks after the application of the IF (18/6) nutritional regime according to LCD, in general, it results a softer difference ∆% compared to the difference between T0/T1 (∆% T0/T1 > ∆% T1/T2), generally in most parameters. After 8 weeks of the IF intervention, in T2, there is a noticeable decrease in BMI, with an average of 29.60±3.85, or a percentage difference of -2.8 ∆%. Weight is 86.2 on average, or -3.0 ∆% as a percentage difference. Waist circumference (WC) decreased by 90.16±11.60, or -3.2 ∆%. Decrease in Hip Circumference (HC) 94.22±12.2 or -2.6 ∆%. W/H-ratio as average 0.96 ±0.02. During the entire period of the intervention, there wasn’t significant change regarding the mean value of basal metabolism rate (BMR). There was also no significant difference in BMR between T0 and T2 (P=0.347), although there is still a slight chance that the food intervention caused a slowdown in basal metabolism.
The TG/HDL-cholesterol Ratio has been an average of 1.20±0.36, which shows of a further risk decrease of the atherogenic lipoprotein phenotype. HOMA-IR has a mean of 1.57 ±0.52 which is an indicator of improvement of insulin resistance. This is also reflected by significantly reduced values of insulinemia in T2 as an average of 6.0 mUI/ml. HbA1c in T2 6.99± 1.23 as an average (P=0.036), which represents a significant decrease during the 2 months of dietary intervention, although its optimal value would be reached only after the third month. The presence of ketonuria 1.75±0.17 has continued in all patients, which means that it correctly reflects the dietary intervention. CRP as an average of 1.86±0.55 shows significant improvement of the inflammatory response. In general, statistical significance for P< 0.05 between T0 and T2 has been reached for most parameters. The exceptions are for cholesterol (P = 0.07) and LDL (P = 0.052). Statistical significance for P<0.05 between T0 and T1 was not reached for these parameters: Cholesterol P=0.275, LDL-cholesterol P=0.154, BMI P⁼0.137, HC P=0.117. While statistical significance for P<0.05 between T1 and T2 was not reached for these parameters: Cholesterol P=0.369, HDL P=0.117, LDL P=0.541, Tg/HDL-ratio P=0.082, BMI P=0.490, HC P=0.518, W/H ratio P⁼0.117, Ketones P=0.682. Very interesting data regarding the monitoring of the progress of health benefits during this intervention emerged from the following three correlations in the three phases of the study. The BMI/Homa IR correlation showed a fairly good trend at T0, T1, and T2, reflecting the decrease in insulin resistance parallel to weight loss.
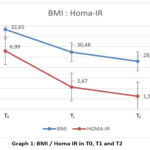 |
Graph 1: BMI / Homa IR in T0, T1 and T2Click here to view Graph |
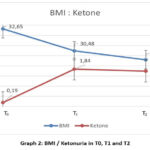 |
Graph 2: BMI / Ketonuria in T0, T1 and T2Click here to view Graph |
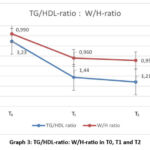 |
Graph 3: TG/HDL-ratio: W/H-ratio in T0, T1 and T2Click here to view Graph |
The BMI / Ketone correlation has given a fairly good trend in T0, T1, and T2, reflecting the metabolic switch throughout lipolysis, which is dedicated to the reduction of fat mass. The correlation of TG/HDL-ratio to W/H-ratio gives a trend in T0, T1, and T2 that shows of improved atherogenic patterns that are attributed to the improvement of the lipoprotein profile (improved TG/HDL-ratio) and the remodeling of the “body shape” (improved W/H-ratio) after nutritional intervention.
The inability to design and implement a personalized dietary intervention for patients based on their metabolic and nutrigenetic characteristics, which is currently the most objective approach for an efficient and safe dietary intervention known as precision weight loss12. Such an approach is based more on the “twin cycle hypothesis” of Taylor et al.,13 a comprehensive hypothesis that figure out etiopathology of DM2. According to this hypothesis, the liver, pancreas, and fat all work together to cause a vicious cycle that leads to prediabetes or diabetes. This hypothesis has in fact provided a strong link between the liver and the pancreas in the context of obesity, which is an antecedent condition related to the outbreak of DM2.
Accordingly, a diet limited in calories and carbohydrates would, in theory, result in a negative energy balance and have a beneficial effect on the illness. This approach is best given by the hypothesis of the etiology of diabetes, known as the twin cycle hypothesis.14 This theory links the two cycles that take place in the liver and pancreas when a person becomes continuously have overfed over time. The mass of carbohydrates taken in excess stimulates insulin for lipogenesis, which in turn, deposits a mass of this fat in itself, pushing even further a decrease in sensitivity to insulin in the liver.
. A paradoxical approach is found today in the medical routine with patients with diabetes, although obesity is considered the main cause of the DM2, much more drugs are prescribed to manage glycemia than for obesity, when in fact the treatment of obesity not only facilitates DM2 patients but also its prevention.15 To go further than just changing the lifestyle and a personalized diet is enough to treat obesity and its consequences and the risk of diabetes.16
In general, nutritional interventions according to this approach have three focuses: Limiting the amount of carbohydrates in such a way that the insulin-lipogenesis effect does not further promote adiposity (very low carbohydrate diets) ,limiting total calories in order to aim for a negative energy balance (very low calorie diet) enabling the reduction of fat mass as well as the food regime for an extended period of fasting according to different protocols (intermittent fasting). All subjects with a BMI over 30 have a good tolerance in terms of dealing with the negative energy balance of an intervention, since it is easily provided by gluconeogenesis and lipolysis, which is calculated to be around ∼400-600 Kcal/day.17
After this stability, they guarantee the use of ketone bodies, which also have energy efficiency for the tissues, but also keep the hunger suppressed, enabling continued adherence to IF.18 The IF protocol applied in our study as well as in other studies has brought benefits, especially in decreasing HOMA-IR and decreasing insulin value.19IF according to the alternate day fasting (ADF) protocol has also shown better adherence and the best results compared to the intervention in calorie restriction (CR), this was also evidenced by the study of Cattenaci et al.,20 where weight loss and the decrease in insulin were greater in the group with ADF than in the ones with CR. The Boden et al.,18 study found the ad libidum ketogenic diet is even more effective in improving insulin sensitivity by 75% within 2 weeks in DM2 individuals. Based on these studies, the intervention according to IF LCD of our study has given very good results based on indicators of body composition, improvements related to parameters that determine inflammatory status, parameters for diabetes and atherogenic risk as well. Thus, the biggest and clinically significant difference is regarding insulin resistance, which has a percentage decrease of -102% after the 8th week of the intervention, this is dedicated to maintaining a constant low level of insulin, a decrease of 83% of the glycemic value from 9.0 to 5.83, which is guaranteed by the IF regime as a result of not eating for a period of about 18 hours of fasting.
This was also evidenced by study of Trepanovski et al.,21 where after a 4-week intervention with two regimens food alternate day fasting (ADF) and calorie restriction (CR) had an improvement in over 45% of HOMA IR due to about 42% decrease in the level of insulinemia after the nutritional intervention. The result obtained for HOMA-IR in the study is closely related to the changes in the BMI value, which has a decrease at the end of the intervention – 9.4% or weight reduction from T0 95.2 kg to T2 86.2 kg (P = 0.032). The correlation of BMI/HOMA-IR is positive, closely reflecting each other’s changes and has been evident throughout the period of the nutritional intervention (Graph 1). The diagnostic value of HOMA-IR is quite objective in terms of insulin resistance in DM2 when it is found in high numbers, but a more dynamic reflection of the Glucose/Insulin relationship is given by their curve after the glucose load, or as it is known, the Kraft test, which has a stronger prognostic value for Insulin resistance.
This test can be recommended in cases where the value of HOMA-IR is oscillating in the borderline of its range to detect an IR as early as possible in individuals that do not even result in impaired glucose tolerance test.22 Intermittent fasting, especially over 12 hours, followed by an LCD diet, causes a metabolic switch that consists in the competition of FFA for the oxidation of the ketones they generate with glucose.23 According to the nutritional intervention of our study, ketones are generated from lipolysis (weight loss) as a result of FFA oxidation, but also from the small amount of carbohydrates in the LCD diet. This situation in our study is reflected quite well with the correlation found during the course of the study between BMI and ketones, which have reflected a negative correlation between them. As weight loss advances, i.e., BMI falls, ketones have increased (at T0=0.19, 1.84 mmol/L), showing the catabolic mode of metabolism that takes place at the expense of fat tissue (Graph 2). At this point, the dilemma arises as to whether a loss of lean body mass is also possible along with adipose tissue. Based on earlier studies, this is not very likely to happen, since in a situation with a high BMI in a short period (a few weeks) it is the adipose tissue that is catabolized and not the muscle mass or lean body mass.24
The study, Bhutani et al.25 reported examined the variations in physical activity in three groups demonstrated that maintaining a high level of physical activity during an intervention like IF is guaranteed to preserve lean body mass and even more effectively reduce fat mass. 25 How effective is the approach through time restricted feeding, to generate ketones through the metabolic shunt, is given by the study of Anton et al.,24 where it turned out that the largest and most consistent generation of ketones was in the ADF diet, especially after the fast state after 12 hours, in the 18-hour daily fasting diet, they were at more moderate levels. Along with the measurements of the laboratory parameters, specifically Triglycerides and HDL, was also analyzed, their correlation with the anthropometric measurements of the Waist and Hip ratio, with the aim of making a possible prediction for the atherosclerotic risk. The correlation between the TG/HDL ratio and the W/H ratio, which is an expression value of adiposity with cardiometabolic risk pattern, based on the findings of Boizel et al.,26 which showed that the TG/HDL ratio stands out for the atherosclerotic risk.
Improper execution of the lipoprotein absorption mechanism also compromises the liver’s ability to regulate lipoproteins. This causes high levels of triglycerides and cholesterol to remain in the circulation, as well.27 The study by Varaday et al.,28 has shown that ADF has a role in increasing LDL particles, whether as a high-fat diet or as a low-fat diet, in the direct measurements of LDL particles that were made. In our study, this is predicted as LDL-size among the values given by the TG/HDL-ratio, which speaks of a close correlation with the size of LDL, thus as an indicator of the atherogenic lipoprotein profile.27 The effects of IF are assumed to be beyond those we have evidenced in this study, even implicating epigenetic changes as evidenced in the study of Shimazu et al.,29 where “BOHB in the range of nutritional ketosis as a powerful epigenetic signal that reduces oxidative stress”.
Conclusion
An intervention combining intermittent fasting (18/6) and a low-carbohydrate diet significantly improved key metabolic parameters in individuals at risk for type 2 diabetes mellitus (T2DM). Notable outcomes included reduced insulin resistance (HOMA-IR), weight loss (BMI), increased ketone production (reflecting fat metabolism), and improved lipid profiles (TG/HDL ratio). Body composition also shifted toward a lower cardiometabolic risk (W/H ratio). These changes suggest a strong correlation between nutritional intervention and metabolic health.
This approach offers a safe, natural, and potentially superior alternative or adjunct to pharmacotherapy, particularly in reducing long-term complications of T2DM.
Acknowledgement
The authors wish to express their gratitude to the University of Rome “Tor Vergata”, Department of Biomedicine and Prevention, Division of Clinical Nutrition and Nutrigenomics, Rome, Italy and Department of Clinical Biochemistry, University Clinical Center of Kosovo, Pristina, Kosovo for generously supporting this research.
Funding Sources
The author(s) received no financial support for the research, authorship, and/or publication of this article.
Conflict of Interest
The author(s) do not have any conflict of interest
Data Availability Statement
This statement does not apply to this article.
Ethics statement
The approval for this study was made after the application for clinical research in the ethical committee of the Chamber of Doctors of Kosovo with no. ref: 119/2022. Details and clinical implications of the study and related study references are provided in the application.
Informed Consent Statement
This study did not involve experiments in human participants, and therefore, informed consent was not required.
Clinical trial registration
This research does not involve any clinical trials.
Permission to Reproduce Material from Other Sources
Not applicable.
Author contributions
- Driton Sopa: Conceptualization, Methodology, Writing – Original Draft.
- Laura Di Renzo: Data Collection, Analysis, Writing – Review & Editing.
- Antonino De Lorenzo: Visualization, Supervision, Project Administration.
- Laura Di Renzo: Funding Acquisition, Resources, Supervision.;
References
- Chandrasekaran P, Weiskirchen R. The Role of Obesity in Type 2 Diabetes Mellitus-An Overview. Int J Mol Sci. 2024; 4:25(3):1882. https://doi.org/10.3390/ijms25031882
CrossRef - World Health Organization. Diabetes. 2021. Retrieved from https://www.who.int/news-room/fact-sheets/detail/diabetes
- Apovian CM., Okemah J, O’Neil PM. Body weight considerations in the management of type 2 diabetes. Advances in Therapy. 2015;32(9):796–813. https://doi.org/10.1007/s12325-015-0231-9
- Feinman RD, Pogozelski WK, Astrup A, et al. Dietary carbohydrate restriction as the first approach in diabetes management: Critical review and evidence base. Nutrition. 2015; 31(1):1–13. https://doi.org/ 10.1016/j.nut.2014.06.011
CrossRef - Saslow LR, Mason AE, Kim S, et al. An online intervention comparing a very low-carbohydrate ketogenic diet and lifestyle recommendations versus a plate method diet in overweight individuals with type 2 diabetes: A randomized controlled trial. Journal of Medical Internet Research. 2017;19(2): e36. https://doi.org/10.2196/ jmir.5806
CrossRef - Patterson RE, Sears DD. Metabolic effects of intermittent fasting. Annual Review of Nutrition. 2017; 37:371–393. https://doi.org/10.1146/annurev-nutr-071816-064634
CrossRef - Wilkinson MJ, Manoogian ENC, Zadourian A, et al. Ten-hour time-restricted eating reduces weight, blood pressure, and atherogenic lipids in patients with metabolic syndrome. Cell Metabolism. 2020; 31(1):92–104.e5. https://doi.org/10.1016/j.cmet.2019.11.004
CrossRef - Cienfuegos S, Corapi S, Gabel K, et al. Effects of 4- and 6-h time-restricted feeding on weight and cardiometabolic health: a randomized controlled trial in adults with obesity. Cell Metabolism. 2020;32(3):366–378.e3. https://doi.org/10.1016/j.cmet.2020.06.018
CrossRef - Freese J, Klement RJ, Ruiz-Núñez B, Schwarz S, Lötzerich H. The sedentary (r)evolution: Have we lost our metabolic flexibility? F1000Res. 2017;2(6):1787. https://doi.org/10.12688/f1000research.12724.2
CrossRef - Theodorakis N, Nikolaou M. The Human Energy Balance: Uncovering the Hidden Variables of Obesity. Diseases. 2025; 13(2):55. https://doi.org/10.3390/diseases13020055
CrossRef - Ruze R, Liu T, Zou X, Song J, Chen Y, Xu R, Yin X, Xu Q. Obesity and type 2 diabetes mellitus: connections in epidemiology, pathogenesis, and treatments. Front Endocrinol (Lausanne). 2023; 21; 14:1161521. https://doi.org/10.3389/fendo.2023.1161521
CrossRef - Merra G, Miranda R, Barrucco S, Gualtieri P, Mazza M, Moriconi E, Marchetti M, Chang TF, De Lorenzo A, Di Renzo L. Very-low-calorie ketogenic diet with amino acid supplement versus very low restricted-calorie diet for preserving muscle mass during weight loss: a pilot double-blind study. Eur Rev Med Pharmacol Sci. 2016;(12):2613-21.
- Taylor R. Pathogenesis of type 2 diabetes: tracing the reverse route from cure to cause. Diabetologia. 2008; 51:1780–1783.
CrossRef - Phillips C. Metabolically healthy obesity: definitions, determinants and clinical implications. Rev Endocr Metab Disord. 2013; 14:219–27.
CrossRef - Thomas C, Mauer E, Shukla A, Rathi S, Aronne L. Low adoption of weight loss medications: A comparison of prescribing patterns of antiobesity pharmacotherapies and SGLT2s. Obesity (Silver Spring). 2016; 24:1955–1961.
CrossRef - Avolio E, Gualtieri P, Romano L, Pecorella C, Ferraro S, Palma G, Di Renzo L, De Lorenzo A. Obesity and Body Composition in Man and Woman: Associated Diseases and the New Role of Gut Microbiota. Curr Med Chem.2020;27(2):216-229. https://doi.org/10.2174/0929867326666190326113607
CrossRef - Cahill GF. Jr. Fuel metabolism in starvation. Annu Rev Nutr. 2006; 26:1-22. https://doi.org/10.1146/ annurev.nutr.26.061505
CrossRef - Boden G, Sargrad K, Homko C, Mozzoli M, Stein TP. Effect of a low-carbohydrate diet on appetite, blood glucose levels, and insulin resistance in obese patients with type 2 diabetes. Ann Intern Med. 2005; 15:142(6):403-11. https://doi.org/10.7326/0003-4819-142-6-200503150-00006
CrossRef - Gabel K, Hoddy KK, Haggerty N, Song J, Kroeger CM, Trepanowski JF, Panda S,Varady KA. Effects of 8-hour time restricted feeding on body weight and metabolic disease risk factors in obese adults: A pilot study. Nutr Healthy Aging.2018;15:4(4):345-353. https://doi.org/10.3233/NHA-170036
CrossRef - Catenacci VA, Pan Z, Ostendorf D, Brannon S, Gozansky WS, Mattson MP, Martin B, MacLean PS, Melanson EL, Troy Donahoo W. A randomized pilot study comparing zero-calorie alternate-day fasting to daily caloric restriction in adults with obesity. Obesity.2016;24(9):1874-83. https://doi.org/10.1002/oby.21581
CrossRef - Trepanowski J, Kroeger C, Barnosky A, Klempel M, Bhutani S, Tsalamandris S, Antonopoulos AS, Oikonomou E, Papamikroulis GA, Vogiatzi G, Papaioannou S, … and Tousoulis D. The role of inflammation in diabetes: current concepts and future perspectives. European cardiology review. 2019;14(1):50.
CrossRef - Patterson R, Laughlin G, LaCroix A, Hartman S, Natarajan L, Senger C, Martínez M, Villaseñor A, Sears D, Marinac C, Gallo L.C. Intermittent Fasting and Human Metabolic Health. J Acad Nutr Diet. 2015;115(8):1203-12.
CrossRef - Randle P, Garland P, Hales C, Newsholem E. The glucose fatty-acid cycle. Its role in insulin sensitivity and the metabolic disturbances of diabetes mellitus. Lancet. 1963;1:785–789.
CrossRef - Anton S, Moehl K, Donahoo W, Marosi K, Lee S, Mainous A, Leeuwenburgh C, Mattson M.P. Flipping the Metabolic Switch: Understanding and Applying the Health Benefits of Fasting. Obesity. 2018; 26:254–268.
CrossRef - Bhutani S, Klempel M, Kroeger C, Trepanowski J, Varady K. Alternate day fasting and endurance exercise combine to reduce body weight and favorably alter plasma lipids in obese humans. Obesity. 2013; 21(7):1370–9.
CrossRef - Boizel R, Benhamou PY, Lardy B, Laporte F, Foulon T, Halimi S. Ratio of triglycerides to HDL cholesterol is an indicator of LDL particle size in patients with type 2 diabetes and normal HDL cholesterol levels. Diabetes Care. 2000;1679-85.
CrossRef - Klop B, Elte J, Cabezas M. Dyslipidemia in obesity: mechanisms and potential targets. Nutrients. 2013;5(4):1218–40.
CrossRef - Varady K, Bhutani S, Klempel M, Lamarche B. Improvements in LDL particle size and distribution by short-term alternate day modified fasting in obese adults. Br J Nutr. 2011; 105(4):580-3.
CrossRef - Shimazu T, Hirschey MD, Newman J, He W, Shirakawa K, Le MN, et al. Suppression of oxidative stress by β-hydroxybutyrate, an endogenous histone deacetylase inhibitor. Science. 2013;339(6116):211-214.
CrossRef

