
Manuscript accepted on :18-06-2025
Published online on: 28-06-2025
Plagiarism Check: Yes
Reviewed by: Dr. Nicolas Padilla
Second Review by: Dr. S Shahi
Final Approval by: Dr. Prabhishek Singh
Majida Motrane1 , Hamid Farhane1, Soufiane Karchali1, Aïcha Motrane2, Fatima-Ezzahra Anaibar1, Said Nassor Abeid1, Abderraouf Hilali3, Nourdin Harich1*
1Department of Biology, Chouaïb Doukkali University, El Jadida, Morocco.
2Diabetes Diagnosis and Treatment Center, El Jadida, Morocco
3Department of Biomedical Sciences, Hassan First University, Settat, Morocco.
Corresponding Author E-mail:harichanthropo@gmail.com
DOI : https://dx.doi.org/10.13005/bpj/3187
Abstract
The study aims to identify the impact of modifiable risk factors on the onset of prediabetes in an apparently healthy adult population from the Doukkala region of Morocco, and to propose effective prevention strategies based on a better understanding of the key risk factors of the prediabetic stage and their interactions. A cross-sectional study was conducted on a sample of 366 apparently healthy volunteers from Doukkala. Participants were divided into two groups: normoglycemic (NG: N=319) and prediabetic (PDT: N=47). The analyzed risk factors included three categories: Anthropometric, sociodemographic and lifestyle factors. Data were collected using a standardized questionnaire during 3 years (from January 2018 to December 2021). Chi-square comparisons between normoglycemic and prediabetic groups revealed that for anthropometric factors: age, general obesity and abdominal obesity were independently associated with prediabetes in the overall sample, and also respectively across women and across men. The association of these factors to PDT, revealed that the risks were multiplied respectively, by 5.42 (p<0.001) for age in the total sample, by 6.47 (p=0.001) in women and by 4.17 (p=0.018) in men. For the two obesity indices (BMI and AO), the overweight BMI’s class was the class that showed the highest risk to develop PDT, both in total sample (OR: 3.89, p<0.001) and by sex (OR: 3.48, p=0.013) in women and (OR: 4.51, p=0.013) in men. When considering abdominal obesity, the OR’s values indicated highest significative risk to PDT development both in total sample (OR: 2.61, p=0.004) and by sex (OR: 2.56, p=0.049) in women and (OR: 3.17, p=0.036) in men. Regarding hypertension, it showed also a significative OR’s value in the total sample (OR: 3.12, p=0.001), but this total sample risk can be attributed only to women (OR: 3.20, p=0.005) and not to men. For dyslipidemia, the only parameter that showed a significative association risk to PDT was hypoHDLemia, being women the own sex to present a significative OR (p=0.024). Sociodemographic parameters revealed significant differences between the PDT and NG groups, only for educational level and marital status, while the lifestyle risk factors do not show any association with PDT. Nevertheless, comparisons between sexes showed some significant differences for tobacco and stress. Our findings highlight that age and weight are the main anthropometric risk factors for the development of prediabetes in the general population. Hypertension and hypoHDLemia were the main biochemical risk factors associated with prediabetes particularly in women. These characteristics seems to be shaped by differences between women and men in stress and smoking lifestyles, and by the patterns of educational levels and marital status for sociodemographic factors. Other results underline gender disparities that should also be considered in recommendations aiming to prevent prediabetes or delay its progression to T2D.
Keywords
Association; Gender; Modifiable risk factors; Morocco; Prediabetes
Download this article as:| Copy the following to cite this article: Motrane M, Farhane H, Karchali S, Motrane A, Anaibar F. E, Abeid S. N, Hilali A, Harich N. Modifiable Risk Factors Associated by Gender With the Onset of Prediabetes in Apparently Healthy Adults from the Doukkala Region (Morocco). Biomed Pharmacol J 2025;18(2). |
| Copy the following to cite this URL: Motrane M, Farhane H, Karchali S, Motrane A, Anaibar F. E, Abeid S. N, Hilali A, Harich N. Modifiable Risk Factors Associated by Gender With the Onset of Prediabetes in Apparently Healthy Adults from the Doukkala Region (Morocco). Biomed Pharmacol J 2025;18(2). Available from: https://bit.ly/3TMpja3 |
Introduction
Prediabetes (PDT) represents a major health concern worldwide. Global estimates suggest that up to 10% of the population is affected,1 with a prevalence of 10.4% and approximately 2.2 million individuals affected in Morocco.2 It is a transitional pathological state characterized by dysglycemia, defined as concentration of fasting glucose higher than the threshold value (1.1 g/L) but remaining below the threshold of type 2 diabetes (T2D) (1.26 g/L).3 It’s prevalence is increasing worldwide, because of the aging and obesity characterizing all populations, often resulting from an unbalanced diet characterized by excessive consumption of calories, carbohydrates, and saturated fats,4 and a sedentary lifestyle marked by insufficient physical activity.5,1 Sociodemographic risk factors, depending of population origin, may play a key role in the variation of PDT prevalence and its progression to complications like DT2, CVD, ….6, 7
PDT is a potentially reversible phase that may be averted through timely preventive measures.8,9 Progression to T2D typically occurs within five years or more, with estimated conversion rates ranging from 15% to 30%.10 Mainly obese individuals are the most affected, and are generally affected by lipid imbalances, such as hypertriglyceridemia and/or hypoHDLemia and/or hypercholesterolemia. These dyslipidemias do not only increase the risk of insulin resistance, a primary driver of progression to T2D,11,12 but also exacerbate the risk of cardiovascular diseases.13
For almost 50% of diabetic cases, the diagnosis is only made when obvious symptoms are present, and in almost half (25%) of cases, the stage of complications have already been reached. These can be of various natures, such as acute metabolic disorders, cardiovascular pathologies or degenerative lesions of target organs.10 It is therefore evident that preventing prediabetes could prevent the onset of TD2 and the development of complications in certain populations. The main objectives of our study are the follows:
* Characterization of modifiable risk factors associated with the development of prediabetes and analysis of their interactions. This will be achieved through a comparative analysis, within the apparently healthy general population of the Doukkala region (Morocco), between two groups of normoglycemic and prediabetic individuals.
* Identification of evidence-based tools for healthcare professionals, enabling the implementation of effective primary prevention strategies adapted to the cultural, sociodemographic, and economic context of the study population.
Materials and Methods
Study Protocol
A cross-sectional, descriptive study, was conducted over three years from 2018 to 2021, using a random method to select participants. An authorization was ensured from the Ministry of Health, and the corresponding approval granted by the Ethics Committee of the Directorate of Epidemiology and Disease Control (reference number 919 DELM/24). All sampling procedures were carried out in accordance with the Declaration of Helsinki, and all volunteers signed written informed consent after receiving full explanations about the purely scientific objectives of the study.
Sampling was conducted during active diabetes screening campaigns organized by associations (mobile caravans), or by screenings performed by the Ministry of Health and Social Protection on the general population and on students from the Faculty of Science at Chouaïb Doukkali University (El Jadida, Morocco). The sample size (n) was calculated using the standard formula for proportions in a large population:
Where: n: represents the required sample size ; N: the population size of the Doukkala region, estimated to 1.36 million inhabitants (HCP, 2024); z: z-score (=1.96 for 95% confidence); p: the estimated proportion (=0.5 if we consider that the prevalence of prediabetics in our population is unknown); and e: margin of error (=5%).
Based on these variables, the minimum sample size required to ensure the representativeness of the results was estimated at 384 individuals.
The inclusion criteria were, being originated from the Doukkala region (Morocco), at least 18 years old, reporting no apparent pathology and to voluntarily sign the informed consent. The validity and repeatability of the used questionnaire were evaluated by three experts in the field, who assessed the relevance, clarity, and comprehensiveness of the questions. Repeatability was tested using a test-retest evaluation on a subsample of participants, indicating good to excellent stability of responses over time. The data from each volunteer were reported on the questionnaire during face-to-face interviews, the collected data concerned anthropometric, sociodemographic and lifestyle factors. Finally venous blood samples were taken by qualified personnel from the Ministry of Health for different analyses.
Data Collection
All determinations followed World Health Organization (WHO) recommendations.
Anthropometric risk factors
Age was the first question asked. For General Obesity (GO), weight (kg) and height (m) were measured using accurate material, and Body Mass Index (BMI) was calculated using the standard formula (weight[kg]/height[m]2). For Abdominal Obesity (AO), we used waist circumference (WC) in centimeters using for measures a non-elastic tape placed midway between the lowest rib and the iliac crest. Elevated WC was defined >90 cm for women and >100 cm for men. Finally, blood pressure was measured in mmHg using an electronic device (OMRON M2) after a 10-minute rest in seated position: Hypertension (HTA) was considered when Systolic blood pressure: SBP≥140 mmHg and/or Diastolic blood pressure: DBP≥90 mmHg.14,15
Biochemical parameters
Glycemic profile
Using a standard common glucometer, fasting blood glucose (FBG) concentration was measured. Individuals were classed into one of the four classes of glycemia: Hypoglycemic: when FBG < 0.70, Normoglycemic: 0.70 ≥ FBG < 1.10, Prediabetic: 1.10 ≥ FBG < 1.26 and Diabetic: FBG ≥ 1.26.
Lipidic profile
Measures were performed using standard enzymatic spectrophotometry. Thresholds were the standards values settled by WHO and NCEP-ATP III (National Cholesterol Education Program Adult Treatment Panel). An individual was considered as affected by hypercholesterolemia when Total Cholesterol (TC)>2 g/L, by hypertriglyceridemia when Plasma triglycerides (TG)≥1.50 g/L and by hypo-HDLemia when HDL-Cholesterol (HDL-C)<0.40 g/L for men and <0.50 g/L for women.
Sociodemographic parameters
Five parameters were considered: place of residence (urban or rural), educational level (three levels were considered: illiterate, middle if middle school or high school, and university), marital status (three status: married, single and divorce or widow(er)), profession (with and without) and finally the family history of diabetes.
Lifestyle
The Smoking status: participants were classified as smokers, if they reported current or past active smoking; as passive smokers, if they were currently exposed to tobacco smoke; and as non-smokers if they reported no such comportment or exposure.
Stress was defined in patients as self-reported feelings of worry or mental tension caused by difficult circumstances at work or in family, like a state of illness, lack of time, financial concerns, or others.
Insufficient physical activity was defined as engaging in less than 150 minutes of physical activity per week.1617
Sedentary behavior was defined as the total time spent sitting or lying down while awake each day. This included time spent during leisure activities (screen time, reading), at work, and when using a private or public means of transport.18
Statistical Analysis
All variables were transformed to Categorical types; they were presented as frequencies or percentages. Comparisons between prediabetic and normoglycemic groups, and between sexes were performed using chi-square tests (χ2). This test was used to assess the association between the categorical variables under study. Binary logistic regression analyses were applied to demonstrate the existence of an association or not, by determining significance of the odds ratios (ORs) with 95% confidence intervals (CIs) obtained. The resulting p-values were used in the interpretation of the statistical significance of the associations, the settled significance threshold was 5%. All statistical analyses were performed using SPSS software (version 26).
Results
Our initial sampling on the general population yielded data from 383 individuals. Analysis of fasting blood glucose (FBG) measurements revealed that not all participants between the control sample exhibited normoglycemia. The distribution of participants across the four recognized glycemic classes was as follows: 1.57% (n=6) were hypoglycemic (FBG < 0.70 g/L); 83.29% (n=319) were normoglycemic (FBG: [0.70-1.10 g/L[); 12.27% (n=47) were prediabetic (FBG: [1.10-1.26 g/L]); and 2.87% (n=29) were hyperglycemic, suggesting the existence of individuals with undiagnosed diabetes (FBG > 1.26 g/L) (figure1). These findings highlight the need for vigilance regarding glucose homeostasis in this population and underscore the importance of studies aimed at identifying risk factors associated with deviations from normal glycemic levels.
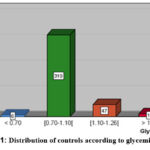 |
Figure 1: Distribution of controls according to glycemic groups.
|
Given that the prediabetic stage is considered potentially reversible, we chose to focus our analysis on comparing the prediabetic (PDT) group with the normoglycemic (NG) group, which are also the two most represented categories among our control sample, to determine their distinct characteristics and deviations. The final study total sample consisted of 366 participants, comprising both NG and PDT individuals: 319 normoglycemic individuals (NG = 87.16%) [190 women and 129 men] and 47 prediabetic individuals (PDT = 12.84%) [31 women and 16 men] (figure 2).
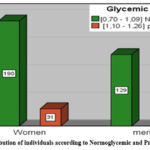 |
Figure 2: Distribution of individuals according to Normoglycemic and Prediabetic by sex.
|
Comparisons
Anthropometric and Biochemical risk factors
Comparisons between prediabetic (PDT) and normoglycemic (NG) individuals (table: 1) revealed that within the total sample, PDT individuals exhibited generally significantly higher proportions of pathological and risky phenotype(s) concerning several modifiable risk factors compared to normoglycemic (NG) individuals.
In the overall sample, Chi square comparisons between PDT and NG groups revealed, as expected, significant differences by age (χ2 = 25.88, p < 0.001), The age classes 30-44 years and 45-59 years were more prevalent among the PDT group (36.2% and 42.6%, respectively) compared to the NG group (26.3% and 17.6%, respectively). Stratified by sex, these age classes were significantly overrepresented among PDT women [(N=31) at 35.5% and 45.2%, respectively], than among NG women [(N=190) at 31.1% and 18.4%, respectively], exhibiting a statistically significant difference (p= 0.001). Among men, the same classes showed the highest and equivalent proportions within the PDT group [(N=16) at 37.5% for both], whereas for NG men subgroup they exhibited the lowest frequencies [(N=129) at 16.3% and 19.4%, respectively; (p= 0.016)]. These findings demonstrate that advancing age as a non-modifiable risk factor, predisposes the population to a higher risk of prediabetes among women, particularly in the [45-59 years] age class; this could be attributable to hormonal changes associated with menopause and metabolic shifts. In contrast, the risk of prediabetes in men appears less influenced by age compared to women and may be more strongly correlated with other factors such as lifestyle or genetic predispositions.
Regarding obesity, we considered the two commonly measured parameters: BMI for general obesity (GO) and waist circumference for abdominal obesity (AO). In the total sample, the prevalence of unbalanced BMI was significantly higher in the PDT group (72.3%) compared to the NG group (44.2%) (χ2 = 13.02, p < 0.001), when considering only two BMI categories. In the case of three BMI categories, the most prevalent category of unbalanced BMI was the overweight category in the PDT group (42.6%) versus 22.1% in the NG group. This last had the normal weight as the most prevalent category (55.8%) (overall χ2 = 14.22, p < 0.001). Abdominal obesity (AO) was significantly more prevalent in the PDT group (68.1%) compared to the NG group (44.1%) (χ2 = 8.78, p = 0.003). As for the prevalence of hypertension (HTA), it was also significantly higher in the PDT group (40.4%) compared to the NG group (17.9%) (χ2 = 12.66, p < 0.001). No statistically significant differences were found between the two groups with respect to lipid profiles.
Within each gender, the comparison of modifiable risk factors between PDT and NG groups in women shows significantly higher prevalence of these factors in the PDT group. Specifically, the prevalence of obesity when considering two categories was significantly higher in PDT group (77.4%) compared to NG group (53.4%) (χ2= 6.24, p= 0.012). Likewise, when considering three categories, overweight and obesity were significantly more prevalent in PDT group, respectively (41.9%) and (35.5%), than in NG group, respectively (24.9%) and (28.6%); χ2= 6.82 (p<0.033). For the second measured parameter (WC) estimating abdominal obesity, the prevalence of AO was also higher in the PDT group (80.6%) than in the NG group (61.9%) (χ2= 4.08, p= 0.043). Hypertension (HTA) was also significantly prevalent in PDT women (41.9%) compared to NG women (18.4%) (χ2= 8.66, p= 0.003). The parameters above had all shown significant chi-square values in the overall sample, but when considering dyslipidemia that had not shown any significant difference, an exception appears only for low-HDLemia in women, which presented a statistically significant difference between the PDT and NG groups. This peculiar pattern seems to be a characteristic of women from the Doukkala region, hence the pathological hypo-HDLemia was more prevalent in NG women (60.8%) than in PDT women (37.9%), and consequently the normal-HDLemia was more present in PDT women (62.1%) than in NG women (39.2%), (χ2 = 5.31, p = 0.021).
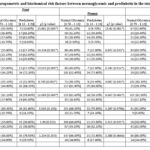 |
Table 1: comparisons of Anthropometric and biochemical risk factors between normoglycemic and prediabetic in the total sample and within each sex.
|
Within men, the comparisons between PDT and NG groups, revealed significant differences only concerning obesity parameters, and no one for the other anthropometric and biochemical risk factors (HTA, total cholesterol, HDL-cholesterol and triglycerides). Hence, a significant predominance of overweight and obesity was detected among PDT men compared to NG men, respectively 43.8% and 18.8 versus 18% and 12.5% (p< 0.05). These results were confirmed by AO ones, that showed more prevalent values in PDT men (43.8%) than in NG men (19.7%) (χ2 = 4.73, p = 0.030).
Comparisons between women and men within the total sample (PDT+NG groups) (table 2), revealed significative differences (p=0.000) only for obesity parameters analyzed, and hence women appear to be more predisposed to developing the risk factor related with weight disorder while still in the normoglycemic (NG) stage. Indeed, within the NG group comparisons indicated that morbid values for general obesity (GO) and for Abdominal obesity (AO), are significatively prevalent in women than in men (p=0.000, for BMI_2 classes, BMI_3 classes and for AO). Within PDT group, comparisons between sexes indicated that GO parameters does show any sex difference, and in this case only the AO parameter showed significant difference (p=0.010), because of the predominance of AO phenotype across women than across men. Table 2, indicated that there was no difference between sexes concerning HTA in the three comparisons (total sample, NG and PDT, groups). Finally, the comparisons between sexes concerning dyslipidemia parameters (table 2) revealed that only hypo-HDLemia risk factor showed a significative difference exclusively in the PDT group (p=0.026), being men who presented the highest prevalence of hypo-HDLemia and women the highest of normal HDL-C.
Sociodemographic factors
In this section we considered five sociodemographic parameters, namely residence, education level, marital status, occupation and family history with diabetes, in order to determine which ones would have an effect on the above repartition into prediabetic (PDT) and normoglycemic (NG) groups. The sociodemographic characteristics within the overall sample and within each gender subgroup, are summarized in Table 3.
In the overall sample, Chi square comparisons between PDT and NG groups revealed significant differences in educational level (χ2 = 15.56, p < 0.001), and in marital status (χ2 = 15.17, p < 0.001). The others sociodemographic factors (residence, profession and the history of diabetes in the family), did not show significant differences between the two glycemic groups.
Different proportions of the educational levels considered, were observed between PDT and NG groups. The illiteracy rate was higher in the PDT group (42.6%) than in the NG group (30.1%). The most represented classes were the secondary education (46.8%) in the PDT group and the university education (40.2%) in the NG group. These results suggest that illiteracy may be a contributing factor to prediabetes in the PDT group, potentially due to limited health literacy, reduced access to health information, and a lack of awareness regarding risky behaviors. Conversely individuals with university education appear to be less vulnerable, possibly due to a greater to understand and manage modifiable risk factors, such as diet, physical activity and stress. The lower proportion of university-educated individuals in the PDT group (10.6% compared to 40.2% in NG group) suggests that higher education may offer a protective effect by facilitating the adoption of healthier lifestyles.
Comparing the proportions of education level classes, between PDT and NG groups within each gender, women showed a significant difference (p=0.012). Hence, illiteracy was the more prevalent class among PDT women (51.6%) compared to NG women (36.7%), followed in the same way by the secondary education, which was higher in the PDT women (38.7%) than in NG women (26.6%). Conversely, it was the NG women who exhibited a significantly higher proportion of university-level education (36.7%) than PDT women (9.7%). In contrast, the significant difference observed in men.
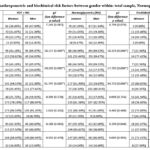 |
Table 2: Comparisons of Anthropometric and biochimical risk factors between gender within: total sample, Normoglycemics and prediabetics
|
Table 3: Sociodemographic risk factors comparisons between Normoglycemic and Prediabetic samples in the total sample and within each sex.
| Total sample | Women | Men | |||||||||
| Normal Glycemia [0.70 – 1.10] |
Prediabetes ]1.10 – 1.26[ |
ꭓ2 (p value) | Normal Glycemia [0.70 – 1.10] |
Prediabetes ]1.10 – 1.26[ |
ꭓ2 (p value) | Normal Glycemia [0.70 – 1.10] |
Prediabetes ]1.10 – 1.26[ |
ꭓ2 (p value) | |||
| Residence | |||||||||||
| Urban | 101 (31.7%) | 15 (31.9%) | 0.001 (0.972) | 55 (28.9%) | 12 (38.7%) | 1.202 (0.273) | 46 (35.7%) | 3 (18.8%)) | 1.819 (0.177) | ||
| Rural | 218 (68.3%) | 32 (68.1%) | 135 (71.1%) | 19 (61.3%) | 83 (64.3%) | 13 (81.3%) | |||||
| Educational level | |||||||||||
| Illiterate | 95 (30.1%) | 20 (42.6%) | 15.568 (0.000) | 69 (36.7%) | 16 (51.6%) | 8.815 (0.012) | 26 (20.3%) | 4 (25.0%) | 6.825 (0.033) | ||
| Middle | 94 (29.7%) | 22 (46.8%) | 50 (26.6%) | 12 (38.7%) | 44 (34.4%) | 10 (62.5%) | |||||
| University | 127 (40.2%) | 5 (10.6%) | 69 (36.7%) | 3 (9.7%) | 58 (45.3%) | 2 (12.5%) | |||||
| Marital status | |||||||||||
| married | 169 (53.0%) | 35 (74.5%) | 15.176 (0.001) | 104 (54.7%) | 22 (71.0%) | 6.711 (0.035) | 65 (50.4%) | 13 (81.3%) | 9.806 (0.007) | ||
| Single | 137 (42.9%) | 7 (14.9%) | 74 (38.9%) | 5 (16.1%) | 63 (48.8%) | 2 (12.5%) | |||||
| divorce or Widow(er) | 13 (4.1%) | 5 (10.6%) | 12 (6.3%) | 4 (12.9%) | 1 (0.8%) | 1 (6.3%) | |||||
| Profession | |||||||||||
| Without | 185 (58.0%) | 24 (51.1%) | 0.803 (0.370) | 121 (63.7%) | 17 (54.8%) | 0.889 (0.346) | 64 (49.6%) | 7 (43.8%) | 0.196 (0.658) | ||
| With | 134 (42.0%) | 23 (48.9%) | 69 (36.3%) | 14 (45.2%) | 65 (50.4%) | 9 (56.3%) | |||||
| Family history of diabetes | |||||||||||
| No | 180 (57.0%) | 28 (59.6%) | 0.114 (0.735) | 104 (55.0%) | 17 (54.8%) | 0.889 (0.346) | 76 (59.8%) | 11 (68.8%) | 0.473 (0.492) | ||
| Yes | 136 (43.0%) | 19 (40.4%) | 85 (45.0%) | 14 (45.2%) | 51 (40.2%) | 5 (31.3%) | |||||
(p= 0.033), was basically due to higher prevalence of university education in NG men (45.3%) than in PDT men (12.5%), and to higher proportion of secondary level (62.5%) and illiteracy (25%) among PDT men than among NG men (34.4%) and (20.3%) respectively.
Regarding marital status, a higher proportion of married individuals was found in the PDT group (74.5%) compared to the NG group (53%) (p < 0.001), although they were both high. This discrepancy may be associated with social and environmental factors within marital contexts, such as shared dietary habits or decreased physical activity, potentially increasing metabolic risks. Conversely, single individuals were more prevalent in the NG group (42.9%) compared to the PDT group (14.9%). This suggests that single individuals may have greater autonomy in managing healthy lifestyle behaviors, and thus a lower exposure to prediabetes risk factors. Divorced individuals also exhibited different rates, with a higher percentage in the PDT group (10.6%) compared to the NG group (4.1%). Divorce may represent a potential vulnerability factor due to its associated psychosocial and economic repercussions, contributing to the development of prediabetes. In the PDT group, the prevalence of married men and women remained the status most represented (81.3% and 71% respectively), while single’s status represented only 16.1% of women and 12.5% of men, and the divorced/widow(er) status 12.9% of women and 6.3% of men. Among NG group, married was also the most common status (54.7% in women and also in men 50.4%); single NG men (48.8%) were more frequent than single NG women (38.9%). These differences in marital status between PDT and NG individuals, would explain the potential impact that can have the psycho-socio-familial context on the onset of prediabetes.
The other socioeconomic risk factors considered (place of residence, professional occupation, and family history of T2D) in the present study (table 3), did not show any significant difference between PDT and NG.
When comparisons are performed between genders, significant differences were observed for three sociodemographic factors (educational levels, marital status and profession), within the total sample and only within the normoglycemic group (NG) (table 4), this last group seems to be responsible of the differences observed at the total sample, due to its large size. are due to that observed in the normoglycemic group. For educational levels in the total sample χ2= 13.006 (p=0.001), women showed higher proportions of illiteracy (38.81%) while men showed the higher rates of middle and university levels (37.50% and 41.67%); in the normoglycemic group, similar results are observed. For Marital status, the total sample showed a χ2= 8.112 (p=0.017), men showed higher proportions of single (44.83%) while women showed the higher rate of divorced and/or widowers (7.24%); the same tendency between sexes was detected in the normoglycemic group. Concerning profession, the comparisons revelated significant differences between women and men, within the total sample (χ2=6.493 (p=0.011)) and within NG sample (χ2=6.245 (0.012)), due to the fact that men with and without profession have values around 50% both in the total and in the NG samples, while the rates of women without are higher (around 63% in the two cases) than women with profession.
Lifestyle factors
In this case, the considered risk factors: smoking, stress, physical activity and sedentary lifestyle, does not show any significative difference between the PDT and the NG blood sugar groups, both within the total sample and within each gender. This indicates that these factors have no direct relationship with the glycemic profile of the Doukkala population (table 5).
Conversely, when the comparisons are performed between the two sexes within the total sample and within each blood sugar group (PDT and NG) (table 6), we founded highly significant differences only for smoking and stress factors but not for physical activity and sedentary lifestyle. Indeed, the comparisons within the total sample highlighted a χ2= 15.770 (p=0.000) for tobacco, and a χ2= 14.927
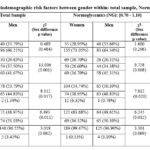 |
Table 4: Comparisons of Sociodemographic risk factors between gender within: total sample, Normoglycemics and prediabetics
|
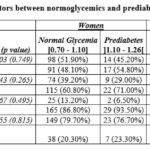 |
Table 5: Comparisons of behavioral and lifestyle risk factors between normoglycemics and prediabetics controls in the total sample and within each gender
|
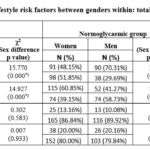 |
Table 6: Comparisons of behavioral and lifestyle risk factors between genders within: total sample, normoglycemic and prediabetics
|
(p=0.000) for stress; within the NG group, χ2= 15.305 (p=0.000) for tobacco, and χ2= 11.632 (p=0.000) for stress; for the tobacco factor, the differences observed are essentially due to ever-increasing prevalence of smokers among men and ever-higher prevalence of passive smokers and non-smokers among women. Concerning stress, it is always women who show the highest prevalence. Finally, within PDT group, prediabetics do not show any significant difference between the 2 sexes.
Association study
The binomial regression performed demonstrated a significant association between several risk factors and the development of prediabetes (table 7). Specifically, age (p < 0.001), general obesity (GO): overweight (p < 0.001) and obesity (p= 0.015), abdominal obesity (AO) (p= 0.004), and hypertension (HTA) (p = 0.001), in the total sample.
The binary regression confirmed that age is the most significant aggravating factor for the development of prediabetes in the total population studied, with a risk multiplied by 5.424 (95% CI: 2.457-11.973). When the risk of developing prediabetes due to increasing age is estimated within each sex, it appears to be higher in women (OR = 6.472, 95% CI: 2.18-19.208, p = 0.001) than in men (OR = 4.167, 95% CI: 1.275-13.620, p = 0.018). Conversely the two BMI classes (overweight and obesity) compared to normal weight, showed that the risk associated with overweight, reached an odds ratio of 3.89 (95% CI: [1.836-8.244], p<0.001) in the total sample, being this time slightly higher among men (OR = 4.514, 95% CI: [1.383-14.734], p=0.013) than in women (OR = 3.477, 95% CI: [1.299-9.309], p=0.013); the obesity class compared to normal weight, showed a significative risk multiplicated by 2.723 (95% CI: [1.219-6.085], p=0.015) only in the total sample but not within each sex. For AO, the odds ratio of developing prediabetes in the total sample was estimated to be 2.614 times (95% CI: [1.362-5.018], p=0.004); and once again, the risk of developing PDT in men [OR=3.173 (95% CI: [1.077-9.347], p=0.036)] was slightly higher than its in women [OR=2.564 (95% CI: [1.0036.552], p=0.049)].
Regarding HTA, a risk multiplication of 3.119 (95% CI: [1.63-5.97], p=0.001) of becoming PDT was observed regardless of sex. However, within each sex, only women presented a significant risk of becoming hypertensive (OR=3.198, 95% CI: [1.434-7.134], p=0.005) compared to men that were not at risk (p = 0.059).
Concerning dyslipidemia parameters, hypo-HDLemia (one of the most predisposing risk factors to metabolic disorders) was the only parameter to represent a risk factor exclusively in NG women, in whom the prevalence is higher than in PTD controls (OR=0.394, 95% CI: [0.175-0.885], p=0.024). This finding suggests that hypo-HDLemia, while showing a ‘protective’ odds ratio, is more prevalent in normoglycemic women than prediabetic women, indicating it might be an early marker or predisposing factor for prediabetes in this specific female population.
Finally, when considering the association of lifestyle risk factors with the development of prediabetes (table 7), no factor between the considered (Tobacco, stress, physical activity and sedentary) showed an association with the predisposition of developing prediabetes.
Discussion
Our study investigated key modifiable risk factors associated with the onset and progression of prediabetes (PDT), namely age, hypertension (HTA) general obesity (GO), and abdominal obesity (AO). Our findings demonstrated significant correlations between age and specific risk factors. Concerning the vulnerability in relation to age, especially classes spanning [30-44] and [45-59] years were the most affected by PDT, particularly among women. These findings are in accordance with a
Table 7: Association between age and modifiable risk factors in the total sample and by gender.
| Risk factors | Total sample | Women | Men | |||||||
| OR | p value | 95% CI | OR | p value | 95% CI | OR | p value | 95% CI | ||
| Age | ||||||||||
| Age ≥ 35 vs Age < 35 | 5.424 | <0.001 | [2.457-11.973] | 6.472 | 0.001 | [2.18-19.208] | 4.167 | 0.018 | [1.275-13.620] | |
| Obesity | ||||||||||
| Overweight vs Normal weight | 3.89 | <0.001 | [1.836-8.244] | 3.477 | 0.013 | [1.299-9.309] | 4.514 | 0.013 | [1.383-14.734] | |
| Obesity vs Normal weight | 2.723 | 0.015 | [1.219-6.085] | 2.561 | 0.067 | [0.936-7.006] | 2.781 | 0.177 | [0.630-12.274] | |
|
Abdominal obesity (AO) |
||||||||||
| AO vs no AO | 2.614 | 0.004 | [1.362-5.018] | 2.564 | 0.049 | [1.003-6.552] | 3.173 | 0.036 |
[1.077-9.347] |
|
| Hypertension (HTA) | ||||||||||
| HTA vs no HTA | 3.119 | 0.001 | [1.63-5.97] | 3.198 | 0.005 | [1.434-7.134] | 2.918 | 0.059 | [0.961-8.866] | |
| Lipids | ||||||||||
| Hypercholesterolemia vs Normal | 1.854 | 0.158 | [0.787-4.371] | 2.402 | 0.077 | [0.911-6.337] | 0.722 | 0.766 | [0.085-6.146] | |
| HypoHDLemia vs Normal | 0.673 | 0.224 | [0.355-1.275] | 0.394 | 0.024 | [0.175-0.885] | 1.991 | 0.265 | [0.593-6.687] | |
| HyperTGemia vs Normal | 1.577 | 0.27 | [0.702-3.54] | 2.333 | 0.072 | [0.928-5.864] | 0.439 | 0.443 | [0.053-3.604] | |
| Dyslipidemia | 0.699 | 0.302 | [0.355-1.38] | 0.491 | 0.087 | [0.217-1.108] | 1.556 | 0.518 | [0.408-5.931] | |
| Tobacco | ||||||||||
| Tobacco vs No | 1.107 | 0.749 | [0.594-2.066] | 1.308 | 0.491 | [0.610-2.804] | 0.929 | 0.898 | [0.302-2.856] | |
| Stress | ||||||||||
| Stress vs No | 1.428 | 0.267 | [0.762-2.676] | 1.573 | 0.284 | [0.687-3.603] | 1.107 | 0.85 | [0.388-3.161] | |
| Physical Activity | ||||||||||
| WHO recommendations not followed vs followed |
0.688 | 0.497 | [0.234-2.024] | 0.455 | 0.302 | [0.102-2.026] | 1.275 | 0.765 | [0.260-6.242] | |
| Sedentarity | ||||||||||
| Sedentary vs not sedentary | 1.077 | 0.847 | [0.508-2.281] | 1.167 | 0.741 | [0.468-2.910] | 0.914 | 0.895 | [0.243-3.446] | |
meta-analysis carried out by the American Diabetes Association (ADA), demonstrating the increase of prediabetes incidence and prevalence with age, and that vulnerability in women may be attributable to hormonal, biological, and behavioral factors.12 Age after 30 and especially classes [30-44] and [45-59] represent critical periods where screening and prevention should increase in order to protect against prediabetes.19 Age is often associated with increased insulin resistance and poor fat distribution.20 Furthermore, other studies indicate that the increased prevalence of AO and GO in women during this age period often coincides with menopause, leading to selective accumulation of abdominal adipose tissue.21
Age is then considered as one of the major predictive risk factors for prediabetes, particularly among women, who exhibit stronger associations of PDT with GO, AO, HTA and hypoHDLemia (the only dyslipidemia encountered in Doukkala’s PDT women). In contrast, among men risk factors are limited to GO and specifically AO, who exhibit the strongest associations. The significant contribution of excess weight with advancing age specially from early 40s to late 50s, on the development of metabolic disorders (T2D, HTA, and cardiovascular diseases) is consistent with prior reports.22 Concerning HTA, its significant association with metabolic disturbances was demonstrated by its high prevalence in the total sample mainly among PDT women; this suggests a predisposition to prediabetes (PDT) in hypertensive individuals. Our results were similar to those reported by Whelton and Williams23 in adults suffering heart diseases. The predominance of prediabetes among women contrasts with some recent investigations suggesting a slight predominance of HTA in men, with a marginally increased risk for prediabetes development depending on geographic regions, culture and dietary habits.24
In men, a predominance of the recognized risk factors (GO and AO) in the PDT group compared to the NG group, was observed; these results are in line with findings reported by Blüher.25 Abdominal obesity shows also significant associations with prediabetes in both genders. Nevertheless, a notable difference of distribution profiles was observed between the 2 sexes: in women the prevalence of AO was found to be predominant in both NG and PDT; whereas in men, normal AOs predominate the anormal AOs in NG group, and also slightly in the PDT group. The AO risk factor is associated with heightened insulin resistance,26 fact that coincides with findings suggesting that AO elevates the risk of developing pre-diabetes in older individuals,27 and others that suggests its increased implication with age in the development of chronic diseases (CVD and T2D), explained by muscle mass loss and poor distribution of visceral fat.28
The prevalence of AO among PDT women in the study is more than double the rate reported by Neeland et al.27 However, the value obtained in our sample from Morocco remains lower than that documented in Algeria and Tunisia.29,30 These differences can be attributable to dissimilarities in dietary patterns or culinary traditions and also to potential socio-economic factors. Our results indicated also, that regarding the sociodemographic characteristics analyzed, marital status (married) and education level (illiterate) were associated with the onset of prediabetes; these results are in line with other studies carried out on other populations worldwide 31,32 for educational level, and with those for marital status.33
Concerning lifestyle, only two factors: tobacco and stress, showed differences in opposite ways among the two genders. These factors have been implicated in the onset of prediabetes by different studies.34,35 For tobacco smoke, the differences observed are essentially due to ever-increasing prevalence of smokers among men and ever-higher prevalence of passive smokers and non-smokers among women; and for stress, the difference is due to women who showed the highest prevalence.
The binomial regression shows a statistically significant association of hypertension (HTA) to pre-diabetes (PDT) only in women, the odds ratio indicated that the risk is multiplied by 3.198 (OR = 3.198, p = 0.005), while in men the association was not significant (p = 0.059). A statistically significant association was found between HTA and AO, with p-values of 0.003 and 0.000, respectively in women and men (results not shown). Other studies have shown that the increasing distribution of abdominal fat is a predictor of HTA, aside from the presence of general obesity.36 AO contributes to the development of HTA through several mechanisms, including the induction of insulin resistance, the overproduction of vasoconstrictive hormones, and inflammatory markers.37 This link between AO and HTA can be explained by the secretion of angiotensinogen by adipose cells of postmenopausal women,38 particularly in the abdominal area.39
It is well-established that increasing age is associated with an elevated risk of HTA. Some of the age-related changes that can lead to HTA are those affecting arteries, such as the progressive reduction in their elasticity or their increased stiffness.40
Concerning the dyslipidemias considered, the only factor which showed an association with prediabetes was hypoHDLemia. Without having an effect on the total sample, only women showed a significant association, being the NG women who have the highest prevalence compared to PDT women (p = 0.021). This finding is consistent with several prior studies.41,42 Conversely, others researches have reported normal HDL levels in prediabetic individuals, highlighting the variability in lipid parameters between populations, which suggests the need of personalized and individualized management of these factors.43
In contrast to our results, several studies have found a significant association between increasing prevalences of hypertriglyceridemia and hypoHDLemia primarily affects women with PDT, and that HypoHDLemia in PDT’s women, can contribute alongside other lifestyle-related factors to the development of cardiovascular diseases.41,42 However, our result on the other modifiable risk factors for prediabetes, such as hypercholesterolemia, physical activity, sedentary behavior, and smoking, did not show significant associations in the overall sample or within either gender (p > 0.05).
Conclusion
Our study on the Moroccan population from Doukkala region, demonstrated that age and other modifiable risk factors are significantly and independently associated with pre-diabetes, with notable variations by sex and in the overall sample. Indeed, the analysis of these risk factors between the two glycemic groups (PDT and NG) revealed that PDT individuals, regardless of sex, exhibited highly significant differences in age, and the prevalences of hypertension (HTA), general obesity (GO), and abdominal obesity (AO). Sex-stratified analysis indicated that PDT men displayed higher prevalences of GO and AO than NG men, with higher associated risks (as measured by Odds Ratios) than in women PDT. In addition to GO and AO risk factors, women showed higher associated risks for age, HTA and hypoHDLemia. This last dyslipidemia was surprisingly significantly more prevalent in NG women, and could be considered as a potential early indicator for obesity and prediabetes predisposition in women.
These findings implies that if we act in time, by adopting effective and efficient preventive strategies in a sex-specific manner, particularly in individuals aged 35 and over, at least during the prediabetic phase which can last up to 5 years or more, we can avoid T2D in general and particularly unrecognized T2D. In the same time, we can then prevent its worsening through the appearance of complications such as metabolic disorders, cardiovascular pathologies, or degenerative lesions of target organs, or other complications.
Acknowledgement
The authors express their thanks to the volunteers for their participation in the study. Our full gratitude to all the doctors and nursing staff at the “Diabetes Diagnostic and Treatment Center” of El Jadida, for their willingness and contribution to sampling and data collection.
Funding Sources
The author(s) received no financial support for the research, authorship, and/or publication of this article.
Conflict of Interest
The author(s) do not have any conflict of interest.
Data Availability Statement
This statement does not apply to this article.
Ethics Statement
This research did not involve human participants, animal subjects, or any material that requires ethical approval.
Informed Consent Statement
This study did not involve human participants, and therefore, informed consent was not required.
Clinical Trial Registration
This research does not involve any clinical trials.
Permission to reproduce material from other sources
Not Applicable
Author Contributions
- Nourdin Harich : Writing – Review & Editing, Visualization, Supervision, Analysis
- Majida Motrane : Methodology, Sampling, Data Collection
- Hamid Farhane : Methodology, Analysis, Data Collection
- Soufiane Karchali, Fatima-Ezzahra Anaibar, Aïcha Motrane, Said Nassor Abeid, Abderraouf Hilali : Methodology
References
- Organization WH. WHO Guideline on Self-Care Interventions for Health and Well-Being, 2022 Revision. World Health Organization; 2022.
- Chetoui A, Kaoutar K, Elmoussaoui S, et al. Prevalence and determinants of poor glycaemic control: a cross-sectional study among Moroccan type 2 diabetes patients. Int Health. 2022;14(4):390-397.
CrossRef - Association AD. Standards of medical care in diabetes—2011. Diabetes Care. 2011;34(Supplement_1):S11-S61.
CrossRef - Ogurtsova K, Guariguata L, Barengo NC, et al. IDF diabetes Atlas: Global estimates of undiagnosed diabetes in adults for 2021. Diabetes Res Clin Pract. 2022;183:109118.
CrossRef - Li Y, Schoufour J, Wang DD, et al. Healthy lifestyle and life expectancy free of cancer, cardiovascular disease, and type 2 diabetes: prospective cohort study. bmj. 2020;368.
CrossRef - Hamoudi R, Saheb Sharif-Askari N, Saheb Sharif-Askari F, et al. Prediabetes and diabetes prevalence and risk factors comparison between ethnic groups in the United Arab Emirates. Sci Rep. 2019;9(1):17437.
CrossRef - Liu S, Zhu J, Zhong H, et al. Identification of proteins associated with type 2 diabetes risk in diverse racial and ethnic populations. Diabetologia. 2024;67(12):2754-2770.
CrossRef - Abdul-Ghani MA, DeFronzo RA. Pathophysiology of prediabetes. Curr Diab Rep. 2009;9(3):193-199.
CrossRef - Brannick B, Dagogo-Jack S. Prediabetes and cardiovascular disease: pathophysiology and interventions for prevention and risk reduction. Endocrinology and Metabolism Clinics. 2018;47(1):33-50.
CrossRef - Smith JJ, Wright DM, Stratton IM, Scanlon PH, Lois N. Testing the performance of risk prediction models to determine progression to referable diabetic retinopathy in an Irish type 2 diabetes cohort. British Journal of Ophthalmology. 2022;106(8):1051-1056.
CrossRef - Nathan DM, Davidson MB, DeFronzo RA, et al. Impaired fasting glucose and impaired glucose tolerance: implications for care. Diabetes Care. 2007;30(3):753-759.
CrossRef - Committee ADAPP, Committee: ADAPP. 7. Diabetes technology: standards of medical care in diabetes—2022. Diabetes Care. 2022;45(Supplement_1):S97-S112.
CrossRef - Joseph JJ, Deedwania P, Acharya T, et al. Comprehensive management of cardiovascular risk factors for adults with type 2 diabetes: a scientific statement from the American Heart Association. Circulation. 2022;145(9):e722-e759.
CrossRef - Wagner A, Arveiler D, Ruidavets JB, et al. Etat des lieux sur l’hypertension artérielle en France en 2007: l’étude Mona Lisa. Bull Epidémiol Hebdomadaire. 2008;49(50):484-486.
- Yayehd K, Damorou F, Akakpo R, et al. Prévalence de l’hypertension artérielle et description de ses facteurs de risque à Lomé (Togo): résultats d’un dépistage réalisé dans la population générale en mai 2011. In: Annales de Cardiologie et d’Angéiologie. Vol 62. Elsevier; 2013:43-50.
CrossRef - Chaabane S, Chaabna K, Abraham A, Mamtani R, Cheema S. Physical activity and sedentary behaviour in the Middle East and North Africa: An overview of systematic reviews and meta-analysis. Sci Rep. 2020;10(1):9363.
CrossRef - Martin R, Murtagh EM, Rmeileh NA, Shalash A. Measurement and prevalence of adult physical activity levels in Arab countries. Published online 2021.
CrossRef - Duclos M. Épidémiologie et effets sur la morbi-mortalité de l’activité physique et de la sédentarité dans la population générale. Revue du Rhumatisme Monographies. 2021;88(3):177-182. doi:10.1016/J.MONRHU. 2020.11.008
CrossRef - Tabák AG, Herder C, Rathmann W, Brunner EJ, Kivimäki M. Prediabetes: a high-risk state for diabetes development. The Lancet. 2012;379(9833):2279-2290.
CrossRef - Gora A, Tiwari P, Saxena A, et al. Presence of Cutaneous Signs of Insulin Resistance with Central Obesity (CO-CSIR) in Asian Indians is a sensitive physical sign of Metabolic Syndrome (MetS). Published online 2024.
CrossRef - Després JP. Cardiovascular disease under the influence of excess visceral fat. Crit Pathw Cardiol. 2007;6(2):51-59.
CrossRef - Lupoli R, Ciciola P, Costabile G, Giacco R, Di Minno MND, Capaldo B. Impact of grape products on lipid profile: a meta-analysis of randomized controlled studies. J Clin Med. 2020;9(2):313.
CrossRef - Whelton PK, Williams B. The 2018 European society of cardiology/European society of hypertension and 2017 American college of cardiology/American heart association blood pressure guidelines: More similar than different. JAMA. 2018;320(17):1749-1750.
CrossRef - Heianza Y, Zhou T, Sun D, Hu FB, Manson JE, Qi L. Genetic susceptibility, plant-based dietary patterns, and risk of cardiovascular disease. Am J Clin Nutr. 2020;112(1):220.
CrossRef - Blüher M. Metabolically healthy obesity. Endocr Rev. 2020;41(3):bnaa004.
CrossRef - Kissebah AH, Sonnenberg GE, Myklebust J, et al. Quantitative trait loci on chromosomes 3 and 17 influence phenotypes of the metabolic syndrome. Proceedings of the National Academy of Sciences. 2000;97(26):14478-14483.
CrossRef - Neeland IJ, Ross R, Després JP, et al. Visceral and ectopic fat, atherosclerosis, and cardiometabolic disease: a position statement. Lancet Diabetes Endocrinol. 2019;7(9):715-725.
CrossRef - Tchernof A, Després JP. Pathophysiology of human visceral obesity: an update. Physiol Rev. Published online 2013.
CrossRef - Bouguerra R, Alberti H, Smida H, et al. Waist circumference cut‐off points for identification of abdominal obesity among the Tunisian adult population. Diabetes Obes Metab. 2007;9(6):859-868.
CrossRef - Taleb S, Yousfi A, Boussakta M. Tour de taille augmenté et facteurs de risque cardiovasculaire. Nutrition & Santé. 2015;4(2):53-61.
CrossRef - Ansarimoghaddam A, Adineh HA, Zareban I, Iranpour S, HosseinZadeh A, Kh F. Prevalence of metabolic syndrome in Middle-East countries: Meta-analysis of cross-sectional studies. Diabetes & Metabolic Syndrome: Clinical Research & Reviews. 2018;12(2):195-201. doi:10.1016/J.DSX.2017.11.004
CrossRef - Santos AC, Ebrahim S, Barros H. Gender, socio-economic status and metabolic syndrome in middle-aged and old adults. BMC Public Health. 2008;8(1):1-8. doi:10.1186/1471-2458-8-62/TABLES/3
CrossRef - Hosseinpour-Niazi S, Mirmiran P, Sohrab G, Hosseini-Esfahani F, Azizi F. Inverse association between fruit, legume, and cereal fiber and the risk of metabolic syndrome: Tehran Lipid and Glucose Study. Diabetes Res Clin Pract. 2011;94(2):276-283.
CrossRef - Behl TA, Stamford BA, Moffatt RJ. The effects of smoking on the diagnostic characteristics of metabolic syndrome: A review. Am J Lifestyle Med. 2023;17(3):397-412.
CrossRef - Schmidt C, Gummesson A, Bäckhed F, Bergström G, Söderberg M. Psychosocial work conditions and prediabetes risks: a cross-sectional study in middle-aged men and women. Sci Rep. 2023;13(1):1198.
CrossRef - Chuang SY, Chou P, Hsu PF, et al. Presence and progression of abdominal obesity are predictors of future high blood pressure and hypertension. Am J Hypertens. 2006;19(8):788-795.
CrossRef - Mancia G, Grassi G. Manual of Hypertension of the European Society of Hypertension. Crc Press; 2014.
CrossRef - Huang L, Xue J, He Y, et al. Dietary calcium but not elemental calcium from supplements is associated with body composition and obesity in Chinese women. PLoS One. 2011;6(12):e27703.
CrossRef - Borys JM, Richard P, Ruault du Plessis H, Harper P, Levy E. Tackling health inequities and reducing obesity prevalence: the EPODE community-based approach. Ann Nutr Metab. 2016;68(Suppl. 2):35-38.
CrossRef - Vasan RS, Larson MG, Leip EP. Impact of high-normal blood pressure on the risk of cardiovascular disease. ACC Curr J Rev. 2002;11(2):31.
CrossRef - Washirasaksiri C, Srivanichakorn W, Godsland IF, et al. Increasing glycaemia is associated with a significant decline in HDL cholesterol in women with prediabetes in two national populations. Sci Rep. 2021;11(1):12194.
CrossRef - Sundharan DS, Ramchandran DS, Jatale R, Chadha K. Dyslipidemia in prediabetes population: a retrospective study of 91780 cases. Int J Health Sci Res. 2022;12(10):132-139.
CrossRef - Deaño RC, Pandya A, Jones EC, Borden WB. A look at statin cost-effectiveness in view of the 2013 ACC/AHA cholesterol management guidelines. Curr Atheroscler Rep. 2014;16:1-7.
CrossRef
Abbreviations
NG: NormoGlycemic;
PDT: PreDiabeTes;
OR: Odds Ratio;
T2D: Type 2 Diabetes

