
Manuscript accepted on :21-04-2025
Published online on: 13-05-2025
Plagiarism Check: Yes
Reviewed by: Dr. Neeta Rai
Second Review by: Dr. Salma Rattani
Final Approval by: Dr. Prabhishek Singh
Raj Gaurang Tiwari1,2* , Tadiwa Elisha Nyamasvisva2, Nurazim Ibrahim3, Ambuj Kumar Agarwal2,4and Amit Garg5
1Department of Computer Science and Engineering, Chitkara University Institute of Engineering and Technology, Chitkara University, Punjab, India
2Department of Computer Science and Networking, Infrastructure University Kuala Lumpur(IUKL), Kajang, Malaysia
3Department of Civil Engineering, Infrastructure University Kuala Lumpur(IUKL), Kajang, Malaysia
4Department of Computer Science and Engineering, Sharda School of Engineering and Technology, Sharda University, Greater Noida, India
5Department of Computer Science and Engineering, Manipal University Jaipur, Jaipur, India.
Corresponding Author E-mail: rajgaurang@chitkara.edu.in
DOI : https://dx.doi.org/10.13005/bpj/3163
Abstract
Nowadays, the healthcare industry is undergoing a transformation with the increased availability of data. In particular, the data generated through visits of patients in their life span to the hospital known as electronic health records (EHR). This research presents a novel method for identifying cigarette smoking habits using measurements of fundamental health parameters, including heart rate, blood pressure, and oxygen saturation. Explainable machine learning techniques are applied to the top-performing machine learning algorithm to enhance human understanding of the results. The proposed approach, employing feature selection strategies and machine learning algorithms, accurately categorizes smoking habits. Evaluation using a publicly available dataset demonstrates an accuracy rate of 81 %. The model's interpretability is ensured by assessing the significance of input features and the model's decision-making process. This approach shows promise for clinical applications, facilitating early diagnosis of smoking-related health issues and the development of personalized smoking cessation programs. The methodology involves rigorous testing and validation, ensuring the reliability and robustness of the classification model. Further research could explore the application of this model in diverse populations and investigate the potential for integration with existing healthcare systems to improve public health outcomes.
Keywords
Explainable machine learning; Feature importance; Machine learning; Model prediction; Smoking
Download this article as:| Copy the following to cite this article: Tiwari R. G, Nyamasvisva T. E, Ibrahim N, Agarwal A. K, Garg A. Applying Explainable Machine Learning to Classify Smoking Status from Basic Health Biological Signals. Biomed Pharmacol J 2025;18(2). |
| Copy the following to cite this URL: Tiwari R. G, Nyamasvisva T. E, Ibrahim N, Agarwal A. K, Garg A. Applying Explainable Machine Learning to Classify Smoking Status from Basic Health Biological Signals. Biomed Pharmacol J 2025;18(2). Available from: https://bit.ly/3GRBEXf |
Introduction
Cancer, cardiovascular disease, and respiratory illnesses are just some of the many chronic diseases for which smoking is a substantial risk factor. The health problems linked with smoking might be mitigated with the aid of early identification and tailored therapies.
There is a need for more objective and trustworthy techniques that can be readily implemented in ordinary healthcare settings, despite the fact that prior research has investigated a variety of approaches to defining smoking status based on self-reported data.1 Heart rate, blood pressure, oxygen saturation, and respiratory rate are only a few examples of the most fundamental health biological signals that may provide important insights about an individual’s health. The use of machine learning algorithms to analyze large amounts of health data and discover useful patterns for illness diagnosis and prognosis has been shown to be feasible.2,3
In healthcare, machine learning algorithms’ lack of openness and interpretability limits their use. Explainable machine learning methods have been developed to explain how these algorithms get their findings and identify the most important factors in their classification performance.
This work uses machine learning to reliably detect smoking status from a limited collection of basic health biology indicators. Use of explainable machine-learning algorithms may improve interpretability and reveal smoking’s physiological mechanics. This study may assist develop better smoking-related chronic disease prevention techniques.
Explainable Machine Learning
An emerging subfield of machine learning, Explainable Machine Learning (XML) aims to simplify complex machine learning models.4 Machine learning is being used in healthcare, banking, and transportation, and models that make accurate predictions and explain their decision-making process are in demand. Machine learning models’ medical decisions may greatly impact patient outcomes, hence this is crucial.
Explainable ML is an approach for constructing and testing ML models that explain predictions. Rule extraction, decision tree visualization, and feature importance ranking may assist. Users trust and comprehend machine learning algorithms that explain their predictions.5
A strength of XML is its ability to detect and rectify machine learning model biases. Distorted data, poor feature selection, and too complex models can induce bias. Users may extract the most relevant elements affecting the model’s predictions and test its generalizability across datasets using XML. Identifying and correcting biases might enhance the model’s reliability and fairness.6
Motivation
Smoking is a global public health concern that causes preventable diseases and early deaths. Smoking prevention is complicated by people’s tendency to disguise their tobacco use, especially while seeking medical care or insurance. This purposeful omission makes risk assessments and interventions less reliable and effective.
This study seeks to develop a non-invasive classification method that can detect smokers using heart rate, blood pressure, and oxygen saturation. Since self-reporting is prone to willful manipulation due to societal guilt, personal prejudices, and financial incentives, this study addresses the inadequacies of standard approaches by uncovering hidden smoking practices.
Categorization may enhance healthcare and insurance. Doctors can better help patients quit smoking by accurately identifying their smoking habits during visits. Early diagnosis of covert smoking may enhance patient outcomes and healthcare costs.
Smoking behavior classification is crucial to insurance risk assessment and premium calculations. Not disclosing smoking, a recognized risk factor for numerous illnesses, might lead to a misleading risk assessment or fraud. Adding non-invasive health parameter analysis to insurance operations can enhance underwriting, provide more equal rates, and eliminate smoking-related financial concerns.
This project will employ non-invasive monitoring methods to acquire a huge dataset of health variables from a range of people. Using advanced machine learning methods including feature selection, dimensionality reduction, and classification algorithms, a complex model is created to detect smoking trends in health data.
This findings might change how healthcare practitioners and insurance assess and treat tobacco use. This study might improve patient care, insurance risk assessment, and transparency by reducing self-reported information. Developing this classification model aims to reduce smoking-related diseases and increase public support for healthy lifestyles.
Contributions of the Research
Research contributions include
Create a new method of categorising smokers based on their resting heart rate, blood pressure, and oxygen saturation levels.
Use a combination of simple, boosting, and ensemble machine learning methods to create classification models that can reliably detect smokers.
Use a wide range of performance assessment measures including lift curve, ROC curve, accuracy, precision, recall, and F1 score to thoroughly assess the classification models.
Using the aforementioned metrics, choose the machine learning model that produces the most trustworthy classification results.
In order to get insight into the relative relevance of various input factors in predicting smoking behaviours, it is important to investigate and explain the feature significance scores produced from the best model.
Give a detailed explanation of how the model made its predictions so that the process may be easily understood and relied upon.
To prove the effectiveness and performance of the suggested technique, provide exhaustive and thorough results of the best machine learning model, including prediction accuracy, precision, recall, and F1 score.
Highlight the potential influence of the categorization model on enhancing patient care, risk assessment, and fraud detection in healthcare and insurance contexts where covert smoking is a problem.
Develop enhanced non-invasive methods of gauging smoking behaviour, relying less on self-reported data and addressing the challenges posed by deliberate exaggeration.
Show that health indicators may be used as predictors of smoking behaviour, leading to better health outcomes with earlier intervention and tailored care.
Collectively, these efforts help close the gap between covert tobacco use and positive identification, paving the way for a more open and efficient approach in healthcare and insurance.
Outline of the paper
Literature Review Section details the related work done in the field of machine learning algorithms and explainable machine learning techniques. The material and methods section describes the data collection and feature extraction, pre-processing and feature extraction, feature selection, and proposed methodology. The results and Analysis section describes results in terms of evaluation metrics of applied machine learning algorithms for smoking. The next section analyses the Interpretability of the best-performing machine learning approach. The last section concludes the paper with key findings, implications and potential applications, limitations, and future directions.
Literature Review
Several researchers have pointed out the usefulness of health metrics as markers of smoking behaviour.7–10 Different patterns of heart rate, blood pressure, and oxygen saturation have been noted in smokers versus nonsmokers. Consistent research has linked smoking to a higher resting heart rate, higher blood pressure, and lower oxygen saturation. Tobacco’s direct impacts on the circulatory and respiratory systems cause these alterations in physiology. Researchers have sought to create models that properly categorise people as smokers or non-smokers by examining these health markers.
Machine learning is becoming useful for classifying smoking by health characteristics. Decision trees, logistic regression, and support vector machines have been used to create classification models.11 These algorithms can help explain input-smoking status relationships. By integrating several weak learners into a strong classifier, AdaBoost and gradient boosting12 improve performance. Ensemble methods like random forests and bagging have been investigated to increase classification accuracy by merging model outputs.13
Finding the best machine learning model requires extensive assessment criteria. Model performance in smoking classification tasks is measured using lift curve analysis, ROC curve, accuracy, precision, recall, and F1 score.14 These factors can assess model prediction and effectiveness.
The best machine learning model results must be assessed using feature significance scores and model predictions.15 Feature significance scores assess feature importance for accurate prediction. They let doctors and scientists zero in on the specific health factors that differentiate smokers from nonsmokers. The model’s prediction process is also transparent and interpretable since it can be examined step by step. Knowing the reasoning behind the model’s prediction may increase confidence, open doors for interventions, and pave the way for more research.16–18
The following literature review highlights the potential of using health parameters, for classifying smoking habits using machine learning.
In a study conducted in Kaohsiung, Taiwan, Jeng et al19 measured the levels of reproductive hormones and assessed the quality of semen from 192 healthy men aged 20-65. There were three methods to categorise cigarette smoking exposure: 1) smoking status (yes/no), 2) daily cigarette consumption (0, 1, 10, > 10), and 3) pack-year accumulation (0, 1, 10, > 20). TT, LH, FSH and TE concentrations in the blood were evaluated. Here, TT is Total testosterone, LH is Luteinizing Hormone, FSH is Follicle stimulating hormone, and TE is Total Estradiol. The characteristics of the sperm were examined to determine their quality. Multiple linear regression was used to compare the average levels of smoking, sperm quality, and hormones while accounting for possible confounding factors such as age, cadmium levels in seminal plasma, body mass index (BMI), and alcohol consumption. On average, smokers had a greater TT and a lower proportion of normal morphology.
Ex-smokers’ saliva microbiomes were utilised to predict smoking behaviour using data augmentation and ML algorithms, as shown by Dez López et al.20
With the use of machine learning, Abirami et al21 investigated the connection between socioeconomic parameters like lifestyle and monthly savings, and sociocultural elements like friend group size, number of friends who drink and smoke, information about parents, etc. This research studied Gaussian NB, SVM, and LR multi-classifier prediction training and methods. The best classifier for predicting whether or not someone would consume alcohol (86.4%) or smoke (97.2%) was determined to be Logistic Regression. The F1 score for the drinking classifier was 0.76, while the F1 score for the smoking classifier was 0.85.
Hookah use among college students was classified using a combination of decision tree and random forest algorithms by Mohammed et al.22 They arrived at the conclusion that random forest outperformed choice tree in terms of classification accuracy.
Pariyadath et al23 employed SVM-based classification to find brain-based characteristics predictive of nicotine dependence in resting state functional connectivity (rsFC) data from nicotine-dependent smokers and healthy controls. Using a network-centric approach, we discovered that functional connectedness within networks was better at predicting smoking status than connectivity between networks or node representativeness within their parent networks.
By aggregating and analyzing the smoking statuses of all clinical papers for a certain patient, as proposed by Sohn et al,24 final smoking status for the patient can be derived effectively.
To determine how well deep learning models can infer patients’ smoking status from clinical progress notes, Rajendran et al25 conducted an investigation. They developed a Natural Language Processing (NLP) Pipeline to scrub the logs before sending them through a Convolutional Neural Network (CNN), a Unidirectional Long Short-Term Memory (LSTM), and a Bidirectional LSTM. The word embedding layer in each of these models was either pre-trained or post-trained. Three more, more conventional machine learning models were used for comparison with the neural networks. Both binary and multi-class labels have been produced by each model. According to our findings, the CNN model that included a pre-trained embedding layer was the most effective at classifying data into binary and multiple classes.
Smoking-cessation outcome predictors were identified by Medina et al26 using SHAP TreeExplainer. In this study, the authors chose CatBoost ML’s explainable variant since it outperformed the competition across all datasets.
A comparative analysis of various research works done in the same field is depicted in Table I.
Table I: Comparative Analysis of Related Work
| Ref. | Dataset | Method/Purpose | Results |
| 19 | Self created dataset of 192 healthy men 20–65 years old | Cigarette smoking and the production of reproductive hormones. Multiple linear regression was used to analyse the correlation between smoking, sperm quality, and hormone levels. | Light smokers have a lower mean percentage of normal morphology. Heavy smokers have lower percentage of normal morphology. There was no discernible difference between smokers and nonsmokers in terms of sperm count, sperm viability, or sperm motility. |
| 20 | Saliva 16S rRNA gene sequencing data | Seven ML methods: LR, k-NN, SVM with linear and radial kernels, DT, RF, and XGBoost | Classification performance was 0.36 for the Matthews correlation coefficient and 0.81 for the area under the curve using SVM with a linear kernel. |
| 21 | Quantitative information regarding cultural elements such as the number of people in one’s social circle who drink and smoke, the characteristics of one’s parents, etc. | Gaussian NB, SVM and LR | Both smoking and drinking behaviours may be accurately predicted by Logistic Regression with an accuracy of 86.4% and 97.2%, respectively. |
| 22 | questionnaire about Hookah Smoking (HS) in the university students | DT and RF | RF outperforms DT in terms of classification accuracy. |
| 23 | Resting state functional connectivity (rsFC) data | Support vector machine (SVM) | 78% classification accuracy is achieved. |
| 24 | Dataset of Mayo Clinic patients | Text analysis components from the Mayo clinical Text Analysis and Knowledge Extraction System which was built within IBM’s UIMA engineering framework | Macro average F-measure of 0.719 and a micro average F-measure of 0.967 |
Materials and Methods
Data Set
The National Health Insurance Service Health Checkup Information dataset27 has been used in this research. Examining details are included along with standard demographics (gender, age range, trial code, etc.) in this dataset (height, weight, total cholesterol, hemoglobin, etc.). The purpose of this research is to use bio-signals to establish whether or not a person is a smoker. Status did not include e-cigarettes.
Methodology
Fig. 2 depicts the theoretical basis for this investigation. To train a machine learning model, it is necessary to gather, clean, handle missing values, and distribute data. The information acquired here serves as a foundation for the next two procedures.
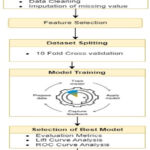 |
Figure 1: Proposed ModelClick here to view Figure |
The following ML algorithms are applied to produce predictions and assess how well they performed using metrics like Classification Accuracy(CA), Area Under Curve(AUC), precision (PRE), and recall (REC).28 AUC, CA, PRE, and REC are used to choose the optimal model, and then explainable ML is applied to that model.
All calculations and analyses were performed in Python 3.6.5.with imblearn, sklearn, xgboost and shap packages.29
Random Forest
Multiple decision trees are combined in Random Forest, an ensemble learning method.
Given B bootstrap samples Db, construct B decision trees.
Each tree Tb is trained on Db with a randomly selected subset of features.
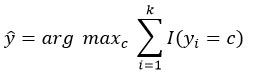
Prediction (classification):
![]()
here I(⋅) is the indicator function.
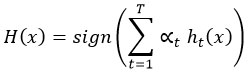
AdaBoost (Adaptive Boosting)
AdaBoost combines weak classifiers iteratively to improve accuracy.
Initialize sample weights: Wi = 1⁄n
Train weak classifier ht(x) at each iteration t.
Compute error:
![]()
Compute model weight:
![]()
Update sample weights and normalize:
![]()
Final prediction:
XGBoost (Extreme Gradient Boosting)
XGBoost optimizes trees using gradient boosting.
Objective function:
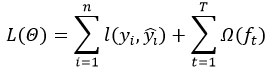
where l(yi,(yi) is a loss function, and Ω(ft) is a regularization term.
Regularization term:
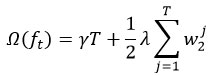
where T is the number of leaf nodes, and wj are leaf weights.
Gradient and Hessian updates are used to optimize the trees.
Decision Tree
Decision trees iteratively partition data by feature values.
Split criterion (Gini Impurity):
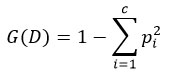
where pi is the proportion of class i.
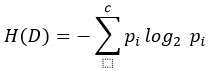
Information Gain (for entropy-based trees):
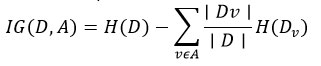
where H(D) is entropy:
CatBoost (Categorical Boosting)
CatBoost optimizes gradient boosting for categorical features.
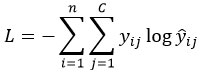
Loss function (log loss for classification):
![]()
Ordered boosting prevents target leakage by using permutations of the data.
Feature combinations are handled using embeddings.
Gradient Boosting
Using loss function minimization, Gradient Boosting constructs models successively.
Define loss function L(y,F(x)).
Compute negative gradient:
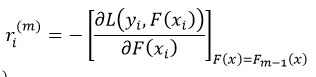
Fit a weak learner hm(x) to ri(m).
Update model:
![]()
where η is the learning rate.
Neural Network
A one-hidden-layer feedforward neural network is:
Forward propagation:
z(l)=W(l)a(l−1)+b(l)
a(l)=σ(z(l))
where W and b are weights and biases, σ is the activation function.
Common loss function (cross-entropy for classification):
Backpropagation:
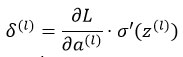
Weights are updated using gradient descent.
Stochastic Gradient Descent (SGD)
Using loss function gradients, SGD iteratively changes model parameters.
Weight update rule:
![]()
where η is the learning rate.
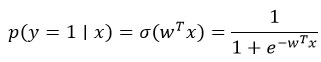
Logistic Regression
Logistic Regression models probabilities using the sigmoid function.
Hypothesis function:
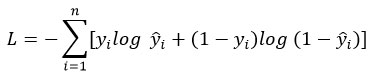
Log loss function:
Naïve Bayes
The Naïve Bayes algorithm implies feature independence based on class.
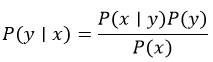
Bayes theorem:
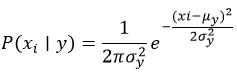
Gaussian Naïve Bayes:
k-Nearest Neighbors (kNN)
kNN assigns a label based on the majority class of the k nearest neighbors.
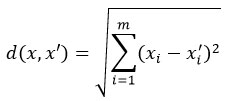
Distance metric (Euclidean):
Prediction:
Support Vector Machine (SVM)
The SVM hyperplane maximizes class margin.
Decision boundary:
f(x)=wTx+b
Optimization problem:
For non-linearly separable data, SVM uses the kernel trick:
![]()
Data Preprocessing and Feature selection
The process of creating a system to identify smoking status from fundamental health biological data using interpretable machine learning algorithms relies heavily on preprocessing and feature extraction. In order to prepare the data for training the machine learning model, it must first be cleaned, transformed, and useful features extracted. Features are selected in accordance with data characteristics and the nature of the inquiry being conducted. Features of heart rate variability, respiration rate, and electrodermal activity were retrieved in our study of smoking status categorization. It has been proven that these traits can distinguish smokers from nonsmokers. Careful feature selection and extraction may improve the accuracy and interpretability of the machine learning model, leading to more reliable conclusions concerning the classification of smokers.
Dataset Splitting
Using 10-fold cross-validation, we estimated the machine learning model quality.30
Model Training
The model is “trained” using the training set and then “tested” using the testing set to evaluate its accuracy. We then built a machine-learning model using the labelled smoking status data and the recovered features. The model is trained using decision trees and ensemble learning techniques to discover an association between the input characteristics and the smoking status labels.
Performance Evaluation Measures
Metrics including accuracy, precision, recall, and F1 score are used to assess the efficacy of the model. These metrics evaluate the model’s performance in distinguishing smokers from non-smokers given a set of input characteristics. To further enhance the model’s performance, we may use methods like cross-validation and grid search to fine-tune its hyperparameters.
Interpretability in machine learning
The capacity to describe how a machine learning model operates and generates predictions is known as its interpretability.31
The results of the best ML model are explained in terms of feature significance scores and predictions in this study. Model prediction gives a step-by-step description of how the model arrived at its forecast, whereas feature significance scores evaluate the relative value of various input variables in creating predictions.
Results
Table II presents the findings obtained from many different machine learning classifiers.
Table 2: Performance Comparison
| ML Method | AUC | CA | PRE | REC | F1 |
| Random Forest | 0.889 | 0.810 | 0.811 | 0.811 | 0.810 |
| AdaBoost | 0.767 | 0.782 | 0.782 | 0.783 | 0.782 |
| XGBoost | 0.863 | 0.781 | 0.782 | 0.783 | 0.781 |
| Tree | 0.713 | 0.775 | 0.773 | 0.773 | 0.775 |
| CatBoost | 0.855 | 0.772 | 0.773 | 0.775 | 0.772 |
| Gradient Boosting | 0.848 | 0.764 | 0.766 | 0.769 | 0.764 |
| Neural Network | 0.840 | 0.756 | 0.756 | 0.755 | 0.756 |
| SGD | 0.721 | 0.730 | 0.733 | 0.738 | 0.730 |
| Logistic Regression | 0.810 | 0.730 | 0.728 | 0.727 | 0.730 |
| Naive Bayes | 0.787 | 0.706 | 0.711 | 0.744 | 0.706 |
| kNN | 0.650 | 0.649 | 0.639 | 0.636 | 0.649 |
| SVM | 0.445 | 0.611 | 0.594 | 0.590 | 0.611 |
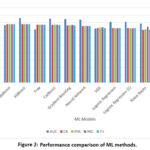 |
Figure 2: Performance comparison of ML methodsClick here to view Figure |
Results shown in Table II are visualized in fig. 2 for better understanding.
Table II and Fig. 2 clearly show that the Randon forest yields the best accuracy among all applied ML algorithms in the correct classification of smoking status from biosignals.
Discussion
Performance Evaluation
Although Table I shows that Random Forest is the best performing algorithm for smoking status classification but to ensure the fact doubly, Lift Curve and ROC curve analysis are performed.14 Fig 3-4 show the lift curve and Fig. 5-6 show the ROC curves for target classes smoking and non-smoking.
 |
Figure 3: Lift curve for target class smokingClick here to view Figure |
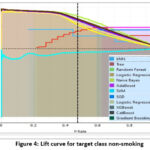 |
Figure 4: Lift curve for target class non-smokingClick here to view Figure |
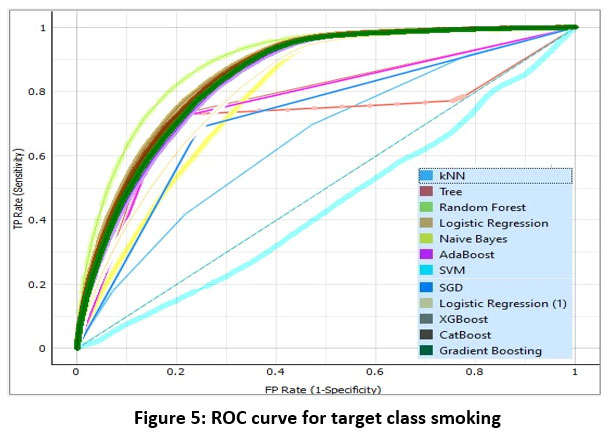 |
Figure 5: ROC curve for target class smokingClick here to view Figure |
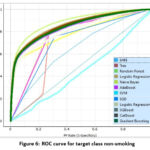 |
Figure 6: ROC curve for target class non-smokingClick here to view Figure |
Fig. 3-4 showed that the random forest algorithm achieved the highest lift values for all levels of cost, indicating that it provided the best performance across all cost scenarios.
ROC curve measures the true positive rate (TPR) against the false positive rate (FPR) for different thresholds of the classification algorithm. A higher TPR and lower FPR indicate better performance. The area under the ROC curve (AUC) provides a single measure of the algorithm’s performance across all possible thresholds. Fig. 5-6 also confirms that Random Forest is the best one for smoking status classification14.
As Random Forest emerges as the best-performing, its decisions are interpreted using Explainable Machine Learning.
Explainable Machine Learning
Feature importance methods
Methods that measure the relative importance of individual characteristics to a model’s accuracy are called “feature importance” methods. Model construction commonly uses feature significance methodologies to assess learning quality and clinical plausibility of feature contributions to predictions.32
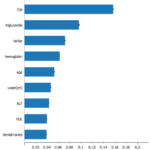 |
Figure 7: Top 10 features toward predictionClick here to view Figure |
Fig. 7 depicts the significance of characteristics, with gender and gamma-glutamyl transpeptidase (γ-GTP) features being the most significant.
Explain Model
Fig. 8 and Fig. 9 show the top ten feature values for predicting smoking and non-smoking in the target class, respectively. For each feature, the SHAP values for each data occurrence are shown as points on the graph (vertical axis). The significance of a feature (in terms of its effect on model prediction; SHAP value) is quantified. Specifically, SHAP evaluates how well one feature may predict another class (when the graph deviates from the center). Having a high SHAP score indicates valuable characteristics for predicting classes (offsets to the right of the center). The issue here is with negative numbers, which are over on the far left. The traits’ relative significance is shown by the colours. More red indicates a greater value in the characteristic, whereas more blue indicates a lower value.
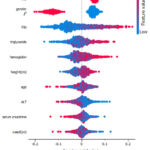 |
Figure 8: Model Explanation for Target Class Smoking.Click here to view Figure |
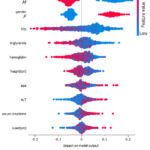 |
Figure 9: Model Explanation for the target class non-smoking.Click here to view Figure |
It can be very clearly interpreted from fig. 8-9 that smoking status is very common in Gender=M with a higher value of GTP while very rare in Gender=F with a lower value of GTP.
Conclusion
To categorize smoking status from biological data, we used a total of 13 distinct machine-learning techniques, including basic, ensemble, and boosting algorithms. According to our findings, the random forest algorithm performed best, with an 81% success rate in classification. In order to better understand what influenced the random forest algorithm’s output, we used explainable machine learning strategies. According to our findings, GTP levels were positively correlated with the ability to identify smoking status in male applicants.
The results reveal that machine learning systems can accurately assess smoking status using biological markers. These findings show that gender and individual biomarkers are needed to accurately assess smoking patterns. Explainable machine learning helped us comprehend the algorithm’s performance and established the framework for future smoking status detection mechanisms. This data may help healthcare providers and politicians adapt smoking cessation programs to high-risk individuals based on gender and biological traits. Machine learning and explainable machine learning approaches in this scenario provide a framework for digital health research and tailored therapy.
Acknowledgement
The authors would like to thank Infrastructure University Kuala Lumpur(IUKL), Malaysia for providing for providing the opportunity of post-doctoral research work. Authors are profoundly grateful to Chitkara University, Punjab for providing the library and other facilities to draft this review
Funding Sources
The author(s) received no financial support for the research, authorship, and/or publication of this article.
Conflict of Interest
The author(s) do not have any conflict of interest.
Data Availability Statement
The manuscript incorporates all datasets examined throughout this research study.
Ethics Statements
This research did not involve human participants, animal subjects, or any material that requires ethical approval.
Informed Consent Statement
This study did not involve human participants, and therefore, informed consent was not required.
Permission to reproduce material from other sources
Not Applicable
Clinical Trial Registration
This research does not involve any clinical trials
Author Contributions
- Raj Gaurang Tiwari: Conceptualization, Methodology, Writing – Original Draft, Review & Editing.
- Tadiwa Elisha Nyamasvisva: Conceptualization, Methodology, Review & Editing
- Nurazim Ibrahim: Analysis, Writing, Visualization.
- Ambuj Kumar Agarwal: Analysis, Writing.
- Amit Garg: Analysis, Writing, Visualization.
References
- Tiwari RG, Husain M, Gupta B, Agrawal A. Amalgamating contextual information into recommender system. In: Proceedings – 3rd International Conference on Emerging Trends in Engineering and Technology, ICETET 2010 : 15-20. doi:10.1109/ICETET.2010.110
CrossRef - El Naqa I, Murphy MJ. What Is Machine Learning? Machine Learning in Radiation Oncology. Published online 2015:3-11. doi:10.1007/978-3-319-18305-3_1
CrossRef - Agarwal AK, Tiwari RG, Kaushal RK, Kumar N. A Systematic Analysis of Applications Of Blockchain in Healthcare. In: Proceedings of IEEE International Conference on Signal Processing, Computing and Control; 2021:413-417, . doi:10.1109/ISPCC53510.2021.9609339
CrossRef - Dosilovic FK, Brcic M, Hlupic N. Explainable artificial intelligence: A survey. 2018 41st International Convention on Information and Communication Technology, Electronics and Microelectronics, MIPRO 2018; 2018 : 210-215. doi:10.23919/MIPRO.2018.8400040
CrossRef - Jain AK, Tiwari RG, Ujjwal N, Singh A. An Explainable Machine Learning Model For Lumpy Skin Disease Occurrence Detection. 2022 International Conference on Data Analytics for Business and Industry (ICDABI); 2022:503-508. doi:10.1109/ICDABI56818.2022.10041665
CrossRef - Bhatt U, Xiang A, Sharma S, et al. Explainable Machine Learning in Deployment. Proceedings of the 2020 Conference on Fairness, Accountability, and Transparency: 648-657 doi:10.1145/3351095
CrossRef - Prince C, Hammerton G, Taylor AE, et al. Investigating the impact of cigarette smoking behaviours on DNA methylation patterns in adolescence. Hum Mol Genet. 2019;28(1):155-165. doi:10.1093/HMG/DDY316
CrossRef - Gu F, Derkach A, Freedman ND, et al. Cigarette smoking behaviour and blood metabolomics. Int J Epidemiol. 2016;45(5):1421-1432. doi:10.1093/IJE/DYV330
CrossRef - Treutlein J, Strohmaier J, Frank J, et al. Smoking behaviour: Investigation of the coaction of environmental and genetic risk factors. Psychiatr Genet. 2014;24(6):279-280. doi:10.1097/YPG.0000000000000051
CrossRef - Ramesh TR, Lilhore UK, Poongodi M, Simaiya S, Kaur A, Hamdi M. Predictive Analysis of Heart Diseases With Machine Learning Approaches. Malaysian Journal of Computer Science. 2022;2022(Special Issue 1):132-148. doi:10.22452/MJCS.SP2022NO1.10
CrossRef - Wang W, Zhang J, Hu B. Meta-learning with Logistic Regression for Multi-classification. Smart Innovation, Systems and Technologies. 2022;270:125-138. doi:10.1007/978-981-16-8558-3_9/COVER
CrossRef - Bahad P, Saxena P. Study of AdaBoost and Gradient Boosting Algorithms for Predictive Analytics. International Conference on Intelligent Computing and Smart Communication; 2020:235-244. doi:10.1007/978-981-15-0633-8_22
CrossRef - Zhang T, Fu Q, Wang H, Liu F, Wang H, Han L. Bagging-based machine learning algorithms for landslide susceptibility modeling. Natural Hazards. 2022;110(2):823-846. doi:10.1007/S11069-021-04986-1/METRICS
CrossRef - Vuk M, Curk T. ROC curve, lift chart and calibration plot. Advances in Methodology and Statistics. 2006;3(1):89–108. doi:10.51936/NOQF3710
CrossRef - Carletti M, Masiero C, Beghi A, Susto GA. Explainable machine learning in industry 4.0: Evaluating feature importance in anomaly detection to enable root cause analysis. Conf Proc IEEE Int Conf Syst Man Cybern. 2019:21-26. doi:10.1109/SMC.2019.8913901
CrossRef - Khan NM, Madhav C N, Negi A, Thaseen IS. Analysis on Improving the Performance of Machine Learning Models Using Feature Selection Technique. Advances in Intelligent Systems and Computing. 2020;941:69-77. doi:10.1007/978-3-030-16660-1_7/COVER
CrossRef - Du M, Liu N, Hu X. Techniques for interpretable machine learning. Commun ACM. 2019;63(1):68-77. doi:10.1145/3359786
CrossRef - Lilhore UK, Poongodi M, Kaur A, et al. Hybrid Model for Detection of Cervical Cancer Using Causal Analysis and Machine Learning Techniques. Comput Math Methods Med. 2022: p. 4688327. doi:10.1155/2022/4688327
CrossRef - Jeng HA, Chen YL, Kantaria KN. Association of cigarette smoking with reproductive hormone levels and semen quality in healthy adult men in Taiwan. Journal of Environmental Science and Health. 2013;49(3):262-268. doi:10.1080/10934529.2014.846195
CrossRef - Díez López C, Montiel González D, Vidaki A, Kayser M. Prediction of Smoking Habits From Class-Imbalanced Saliva Microbiome Data Using Data Augmentation and Machine Learning. Front Microbiol. 2022;13:2576. doi:10.3389/FMICB.2022.886201/BIBTEX
CrossRef - Abirami MS, Vennila B, Chilukalapalli EL, Kuriyedath R. A classification model to predict onset of smoking and drinking habits based on socio-economic and sociocultural factors. J Ambient Intell Humaniz Comput. 2021;12(3):4171-4179. doi:10.1007/S12652-020-01796-4/METRICS
CrossRef - Mohammed AB, Al-Mafrji AAM. A machine learning approach to predict university students Hookah Smoking (HS). Proceedings – 2022 International Conference on Engineering and MIS, ICEMIS 2022: 1-5. doi:10.1109/ICEMIS56295.2022.9914204
CrossRef - Pariyadath V, Stein EA, Ross TJ. Machine learning classification of resting state functional connectivity predicts smoking status. Front Hum Neurosci. 2014;8(JUNE):425. doi:10.3389/FNHUM.2014.00425/BIBTEX
CrossRef - Sohn S, Savova GK. Mayo Clinic Smoking Status Classification System: Extensions and Improvements. AMIA Annual Symposium Proceedings. 2009:619-623.
- Rajendran S, Topaloglu U. Extracting Smoking Status from Electronic Health Records Using NLP and Deep Learning. AMIA Summits on Translational Science Proceedings. 2020:507-516.
- Medina IC, Mohaghegh M. Explainable Machine Learning Models for Prediction of Smoking Cessation Outcome in New Zealand. 2022 14th International Conference on COMmunication Systems and NETworkS, COMSNETS 2022; 2022:764-768. doi:10.1109/COMSNETS53615.2022.9668458
CrossRef - data details | Public data portal. Accessed April 29, 2023. https://www.data.go.kr/data/15007122/fileData.do
- Tiwari RG, Agarwal AK, Kaushal RK, Kumar N. Prophetic Analysis of Bitcoin price using Machine Learning Approaches. In: Proceedings of IEEE International Conference on Signal Processing, Computing and Control. 2021:428-432. doi:10.1109/ISPCC53510.2021.9609419
CrossRef - Parsa AB, Movahedi A, Taghipour H, Derrible S, Mohammadian A (Kouros). Toward safer highways, application of XGBoost and SHAP for real-time accident detection and feature analysis. Accid Anal Prev. 2020;136:105405. doi:10.1016/J.AAP.2019.105405
CrossRef - Wong TT, Yeh PY. Reliable Accuracy Estimates from k-Fold Cross Validation. IEEE Trans Knowl Data Eng. 2020;32(8):1586-1594. doi:10.1109/TKDE.2019.2912815
CrossRef - Dunn J, Mingardi L, Zhuo YD. Comparing interpretability and explainability for feature selection. arXiv preprint; 2021:1-12. doi:10.48550/arxiv.2105.05328
- Kim B, Khanna R, Koyejo O. Examples are not Enough, Learn to Criticize! Criticism for Interpretability. Proceedings of the 30th International Conference on Neural Information Processing Systems,2016: 2288 – 2296

