
Manuscript accepted on :17-04-2025
Published online on: 08-05-2025
Plagiarism Check: Yes
Reviewed by: Dr. Rakam Gopi Krishna
Second Review by: Dr. Shivani Duggal
Final Approval by: Dr. Prabhishek Singh
Immaculate Joy Selvam1* and Moorthi Madhavan2
1Department of Electronics and Communication Engineering, Saveetha Engineering College, Thandalam, Chennai, India.
2Department of Biomedical Engineering, Saveetha Engineering College, Thandalam, Chennai, India.
Corresponding Author E-mail:immaculatejoy@saveetha.ac.in
DOI : https://dx.doi.org/10.13005/bpj/3181
Abstract
Thermography is one of the non-invasive techniques that uniquely identify affected parts of the body. It senses temperature variation between diseased and normal area even at much earlier stage of the disease. Thyroid disease is a problem that affects other important organs of the body. Abnormal blood flow in the affected thyroid glands result in rise of skin temperature. This temperature variation is captured by the thermal camera. Analysis of thermal images is under research development for efficient disease detection and health management. The real-time thermal images captured by the FLIR thermal camera is subjected to pre-processing for possible reduction of noises. Pre-processing of the original thermal image is obtained using discrete wavelet transform. After noise removal, region of interest is segmented and the desired features are extracted by Gray level co-occurrence matrix (GLCM). Features of abnormal and normal thyroid glands are classified using multi-class Support vector machine (SVM) classifier. Performance evaluation metrics for the three classes were obtained respectively as, Normal: Precision- 99.01%, recall- 96.5%, F1 score- 97.8%; Hyper-thyroid: Precision- 89.8%, recall- 89.2%, F1 score- 89.8%; Hypo-thyroid: Precision- 96.7%, recall- 97.4%, F1 score- 96.5%. The results haven shown better classification accuracy of 98.07% as an average with three classes such as hyperthyroid, hypothyroid and normal thermal dataset.
Keywords
Gray level co-occurrence matrix; Support vector machine; Thermography; Thyroid disease
Download this article as:| Copy the following to cite this article: Selvam I. J, Madhavan M. Automatic Detection and Classification of Thyroid Nodules y Thermal Imaging. Biomed Pharmacol J 2025;18(2). |
| Copy the following to cite this URL: Selvam I. J, Madhavan M. Automatic Detection and Classification of Thyroid Nodules y Thermal Imaging. Biomed Pharmacol J 2025;18(2). Available from: https://bit.ly/3EYJJck |
Introduction
Thyroid gland is located just above the trachea in the shape of a butterfly. The fluid produced by the thyroid gland and its hormones are responsible for basic metabolism, brain activity and also to increase oxygen consumption in all parts of the body.1 It plays a vital role in activating every part of body. Hence the thyroid disease identified at its later stage might affect other body parts adversely. Early prophecy of disease can ease the procedure of treatment and also cost effective. The two major hormones manufactured by thyroid gland are triodothyronine (T3) and thyroxine (T4). The generation of these hormones is roused by Thyroid Simulation Hormones (TSH). TSH is produced by the pituitary gland present in the brain. The imbalance resulted in the production of thyroid hormone causes thyroid disease. Broad classification of thyroid gland disease includes two types namely hypothyroid and hyperthyroid. Production of large number of hormones by thyroid gland is called hyperthyroid and less hormone production is called hypothyroid.2 Relative significance of thyroid hormones and nodules are incident more in female than in male.3
Earlier thyroid nodule examination was done through physical neck palpation. Physicians would request the patients to chin-up and swallow. The nodule has to be identified through its movement while swallowing. Thyroid nodules of size greater than 1.5 centimeters can only be visible through neck palpation. Thus, the accuracy of thyroid nodule detection is made impossible by this ancient method.4,5 Ultrasonography imaging provides inadequate details for the detection of nodules present in thyroid gland.6 The other available diagnostic methods in practice includes ultrasound, X-ray imaging emit radiation which may not be safe always.7 Also, it may cause inconvenience to the patients during monitoring. Radio-active iodine test has not proved to be safe for human beings; especially on pregnant women. The radiation emitted has a risk of affecting the fetal thyroid gland. Thermal imaging technique captures the high heat produced by the hyperactive thyroid disease.8 Thus, an alternate diagnostic technique has been used to mark a dramatic significance in possible detection of thyroid nodules is thermography.
Any living organism emits Infra-red radiation that can be captured using a thermal camera. The emitted infrared rays are related directly to the blood flow in the particular region.9 Thermography is economical and non-invasive technique to capture the thermal images of the diseased part of the body. Injured part of the body has more blood flow for healing that particular part. Increase of metabolism and increased blood flow around the affected region gives rise in temperature that can be sensed by using thermal camera.10 The thermal camera displays the temperature variation in the diseased verses normal region. Thermography for biomedical applications is increasing now days.11,12 Majority of its use includes ophthalmology,13 dental,14 breast cancer detection and many more. Thermal cameras can capture the heat radiated by the affected region non-invasively.
The neck images captured through FLIR-30 infrared camera is preprocessed by filtering the noises and finding histogram difference between non-thyroid and thyroid images. The resulting filtered image is subjected to Gray level co-occurrence matrix (GLCM) feature extraction. Texture features of the input gray image obtained from GLCM are simple and readily interpretable has made it more prominent. The extracted features train support vector machine (SVM) for classifying between hyperthyroid, hypothyroid and non-thyroid conditions.
The current workflow is organized under four different sections as follows: section 2 – methodology involves in technical processing, dataset details and algorithms involved in the diagnosis of thyroid nodules. Section 3 presents the algorithm results and classification of the thyroid disease by the classifier and expert radiologist. Section 4 involves in the analysis and comparison between various other proposed methods in the literature, section 5 presents the conclusion and future scope of the work.
Literature Survey
The raise in temperature unconditionally, is an indication of abnormality. When an abnormal mechanical friction occurs in any material increases the heat and leads to its failure.15 All living organisms aim to maintain thermal equilibrium within the body, but any physiological process changes the heat emission dynamically.16 Certainly, human body is also a complex system which when subjected to infection or inflammation produces heat over the skin surface.17 We also remember the initial screening of Covid -19 happened through thermal thermometer to ensure the non-invasive measurement. Infrared thermography is employed in many fields of medical diagnosis including ophthalmology, where the screening was performed over the more sensitive eye region.18 Hence the temperature of skin surface is a potential indicator of any physical dysfunction that may be of health concern.
Infrared thermography for biomedical applications is capable of detecting the radiation emitted by human skin surface that gives the skin or tissue temperature. This infrared variation captured through imaging technique called thermal images, are absolute non-invasive diagnostic method in medical field.19 The skin lesions can be analyzed and benign as well as malignant type skin cancers are identified through infrared thermal imaging technique. The classical diagnosis methods of ultrasonographic view and a needle guided aspiration through ultrasonography is capable of identifying the different types of thyroid nodules. The non-invasive detection of thyroid nodules emerged with the technique called micro-vascular imaging, through which image processing-based analysis was identified. The technique produced the area under the curve was achieved as 0.91 with an efficient classification between benign and malignant thyroid nodules.20 The proposed work has aimed to capture the infrared thermal images from neck region to identify and classify the thyroid nodules from thyroid glands.
Materials and Methods
Dataset
The images were accessed from DITI (Digital Infrared Thermal Imaging) India dataset, which comprises of 30 thyroid person and 21 normal person neck image data. The thyroid abnormality images include 14 hyperthyroid patients and 16 hypothyroid patients. Data acquired from patients at room temperature in seated position with the infrared camera placed 6 meters away. Infrared camera used here is FLIR-30 with an accuracy level of ±2% and thermal images are produced with a resolution of 160×120.
Preprocessing
The pseudo color imaging in thermography is essential for further processing used in manual image analysis. Chromatic light covers 400 – 700 nm in electromagnetic spectrum. The color transformation21 to Luminescence, In-phase, Quadrature (YIQ) model is used in color television and indeed an important model. First step in preprocessing raw thermal image obtained from the patient is converting it from Red, Green and Blue (RGB)22 to YIQ as shown in fig.1.
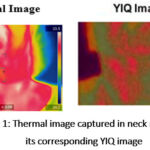 |
Figure 1: Thermal image captured in neck region and its corresponding YIQ image.Click here to view Figure |
By applying histogram equalization to the luminescence part of the YIQ image it appears bright.23 The difference in histogram equalization is calculated with the non-thyroid verses thyroid disease affected person. Two-dimensional discrete wavelet transform is used to denoise the image. The complete flow of the proposed methodology is as depicted in fig.2. The RGB color images may be analyzed using HSI, CIE or YIQ color models. The YIQ image adds more contrast to the high temperature thyroid disease region.
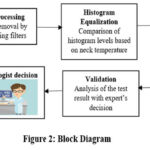 |
Figure 2: Block Diagram.Click here to view Figure |
Segmentation of Region of Interest
The region of interest (ROI) to be identified is the thyroid gland region. The basic shapes include rectangle, square and circle are used for extracting the ROI. These shapes may exclude certain necessary regions or include some unnecessary regions for extraction.24 This might become a hindrance for accurate extraction of features from thyroid nodules. Thus particular region of interest alone is marked through otsu’s thresholding type segmentation.
Gray Level Co-occurrence Matrix
GLCM method calculates the spatial relationship between pixels on the particular gray scale or color image. GLCM features are calculated on the denoised image. GLCM is generally applied to estimate the texture of the image. The matrix contains huge and sparse set of parameters which is used as features to be estimated. GLCM is a square matrix that gives advanced second order statistical data for the selected thermal images. It represents the joint probability distribution between inter pixels in different directions of the given image.25
Initial to its application the image is converted to grayscale. From the gray scale image the texture can be measured by the co-occurrence matrix. The GLCM matrix is described in terms of i,j,d and ө for the provided image I as in (1).

i and j are ith and jth elements of a normalized gray tone spatial dependence matrix respectively. M(i,j) is the Normalized probability distribution function of the co-occurrence matrix, with inter pixel distance d and the angular displacement ө. x and y are the coordinate values of pixels in the image .
Energy in (2) represents distribution of pixels uniformly in the image. It is otherwise known to measure repeated occurrence of the number of pixel pairs.26 Contrast in (3) quantifies intensity or relative variance in an image. Homogeneity in (4) describes the amount of resemblance with available number of images. Correlation in (5) enumerates the number of gray level values depending on the co-occurrence matrix linearly. These equations provide a wide variety of texture analysis by comparing the pixel value against its neighboring one. On comparison, the classification of finding the similarity and difference between the pixel value contribute for the image recoginition and segmentation.
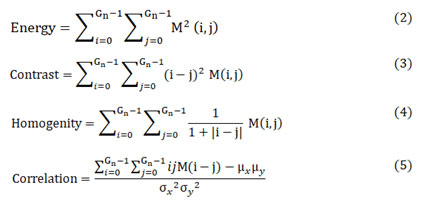
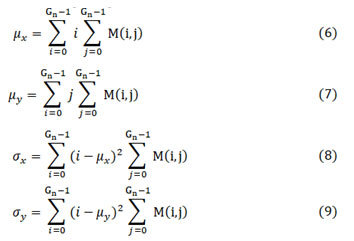
where μx, μy, σx and σy given in (6), (7), (8) and (9) are the mean values and standard deviations of co-occurrence matrix along horizontal-x and vertical-y directions respectively.
The image is converted to gray scale whose total gray levels are denoted as Gn. The extracted main features include energy, contrast, homogeneity and correlation as given in equation (2), (3), (4) and (5).
Classification
SVM has proved to be more powerful classifier for medical image classification.27 Also classification results have proved to be more genuine and free from error. Proper selection of vector models maintains perfect tradeoff between over fitting and poor approximation. These vector models are selected for reorganization of suitable hyperplane. The attributes of the hyperplane are the features to be trained for SVM classifier.28 The extracted features of the GLCM matrix are utilized to train SVM classifier model.29 Performance measure can be obtained based on the training and testing done by the classifier.30
Proposed methodology
The thyroid nodules are abnormal lesions found in the thyroid glands different from surrounding parenchyma. Due to this abnormality the rise in temperature over skin surface can be captured through the infrared thermal camera FLIR 30. The mapping of temperature change over the surface is called thermography or thermal imaging. The captured images are further subjected to denoising process of median filtering along with histogram normalization is performed. This pre-processed noise free image is segmented with the boundary condition using thresholding technique, then the regional features from GLCM are extracted. The features extracted is classified with the multi class SVM for the three classes namely normal, hyperthyroid and hypothyroid.
Results
Most of the diseases developed in human body impacts abnormal blood flow around that particular tissue. The variation in the flow of blood can be sensed by the change of temperature over the skin surface. Development of nodules in the thyroid gland induces change of skin temperature in the neck region. This temperature variation is captured by the thermal camera. Resulting thermal image can be used to identify thyroid disease verses normal person. The proposed method classifies between the hypo, hyper and normal thyroid glands in patients. Thermal Image is processed in three stages namely segmentation of ROI, feature extraction and classification.
Discrete two-dimensional wavelet transform removes undesired noise components from input image. Wavelet decomposition filters at level 2 and soft thresholding value of 4.34 is adapted based upon the horizontal and vertical details. Residuals from the noisy image are filtered to render the denoised image. The region of the thyroid gland location (in front of adams apple) from the neck image is the desired ROI to be segmented.
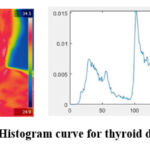 |
Figure 3: Normalized Histogram curve for thyroid disease affected personClick here to view Figure |
From the selected ROI the thyroid nodules are made to be visible clearly. Normalized Histogram and its difference are calculated for thyroid affected person as shown in fig. 3 and histogram curve of the healthy person is as shown in fig. 4.
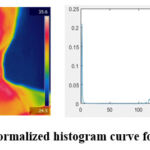 |
Figure 4: Normalized histogram curve for normal personClick here to view Figure |
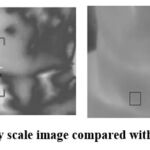 |
Figure 5: Gray scale image compared with rescaled imageClick here to view Figure |
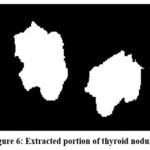 |
Figure 6: Extracted portion of thyroid nodulesClick here to view Figure |
The automated technique proposed localizes the particular ROI that is, the thyroid gland region scaled in gray scale as in fig. 5. Based upon the distribution of temperature in the particular ROI the presence of thyroid nodules is extracted as shown in fig. 6. The pseudo colored YIQ image is transformed to gray scale for obtaining statistical values of GLCM matrix. The gray-comatrix function in MatLab develops the co-occurrence matrix automatically from the gray-scale image. The features extracted from GLCM matrix are used to train the SVM classifier. The appropriate RBF kernel is adapted for the classifier to classify between the various input images. Accuracy specifies the number of rightly classified images, specificity denotes number of false positive to the total negative and sensitivity marks the number of true positive to actual total positive values. For the ease of classification, abnormal thyroid glands are identified with standard deviation above 33 as abnormal and upto 33.0 is treated as normal. The average temperature around the range of 360C is normal, above which is hyper thyroid and less than 350C is considered to be hypothyroid. After training and testing of the images the classifier gave an accuracy of 98.07% by using multi class SVM model. The performance measure of classification of thyroid nodules were analyzed by the metrics recall, precision and F1 score by the equations (10 – 12) which is depicted in fig. 7.
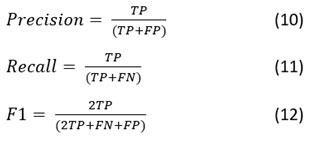
Where, TP = actual nodules from thyroid glands
FP = absence of nodules in thyroid glands
TN = actual nodules not present in thyroid glands
FN = absence of nodules not present in thyroid glands
 |
Figure 7: Performance measure based on the classification of thyroid nodulesClick here to view Figure |
Expert was asked to identify for normal or abnormal presence of thyroid nodules from the processed thermal image. Decision rendered by the expert radiologist is accompanied against the classifier results are as shown in Table I.
Table 1: Classification estimated by svm classifier
| Images | Temperature level (0C) | Standard Deviation (σ) | Classification | Expert decision |
| Therm_Im002 | 36.05 | 17.32 | Normal | Normal |
| Therm_Im017 | 36.10 | 28.55 | Normal | Normal |
| Therm_Im055 | 34.03 | 42.08 | Hypo | Abnormal |
| Therm_Im057 | 37.25 | 38.50 | Hyper | Abnormal |
| Therm_Im063 | 35.30 | 26.70 | Normal | Normal |
| Therm_Im071 | 38.23 | 44.34 | Hyper | Abnormal |
| Therm_Im074 | 37.50 | 37.27 | Hyper | Abnormal |
| Therm_Im086 | 35.10 | 34.62 | Hypo | Abnormal |
| Therm_Im088 | 36.24 | 25.02 | Normal | Normal |
| Therm_Im090 | 35.95 | 18.62 | Normal | Normal |
Discussion
The behavior of thermal images evaluated by dynamic thermography is considered to be the fundamental step and results are obtained in the current work. Percutaneous microwave ablation is also a heating strategy of microwave antenna insertion through the tumour, which then generated high frequency.31 This kind of treatment possess high risk in case of thyroid nodules in the throat region. A non-invasive as well as cost effective diagnosis method to read the abnormality in thyroid glands have been analyzed with computer aided tool is proposed in the current work. Heat emitted by the thyroid nodules (both benign and malignant) are capable to produce visible patterns under specific conditions when acquired by infrared sensors over the skin. The influence of analytical approach should be done to analyze all related diverse parameters for each individual human skin temperatures.32 For this purpose, the nodule size, thickness, fat tissue and blood flow in these regions are to be analyzed. Previous work of diagnosing the nodules from thyroid glands using Wilcoxon test on the temperature variation between the abnormal and normal tissue region. The statistical analysis had resulted with the significance level of 95% between benign and control subjects under measure.33 Whereas in this work we had classified the hypothyroid and hyperthyroid separately to aid the clinicians and achieved the accuracy of 98%. Another study based on identification of cancer cells in thyroid glands was performed by imaging the thyroid glands by computer tomography (CT) and analyzed with the neural network technique. But the study had reported that the network attenuates its performance with the increase in temperature. During their next phase 10 normal neck thermal images and 3 cancerous thermal imaging had achieved an efficiency of 96% with the same network.34 The accurate classification of the type of the thyroid nodule and its background information are given in the current work with the better classification accuracy. Computer based analysis not only saves time but also the accuracy when more electronic data are streamed together and it reduces the human error to a minimum level.35 This is well achieved in the current work by processing and classifying the thermal images automatically.
Conclusion
Thermography has started to replace ancient papillary techniques in thyroid disease diagnosis. Automatic detection and classification of thyroid nodules may ease the physicians for quick analysis. Also early stage analysis of thyroid disease can help to prevent adverse conditions. The acquired thermal images capture the abnormal blood flow in the disease affected region non-invasively. Proposed method preprocesses the thermal image by discrete wavelet transform which results in denoised image and the desired ROI is identified for proper segmentation of the thyroid gland. Analysis of thermal images is carried through GLCM feature vectors energy, contrast, homogeneity and correlation. The features of co-occurrence matrix are used for training SVM classifier. SVM classifier is combined to classify between the hyper, hypo and normal thyroid nodules. Limitation identified is better accuracy results can be made possible by training the classifier with more image datasets. Further studies are also required to assess clinical viability of the proposed algorithm. As a continuation of the current work we will consider designing an automatic algorithm to diagnose and predict the thyroid nodules.
Acknowledgement
We thank Saveetha Engineering College, Thandalam, Chennai for providing the laboratory facility for us to carry out this research work.
Funding Sources
The author(s) received no financial support for the research, authorship and/or publication of this article.
Conflict of Interest
The author(s) do not have any conflict of interest.
Data Availability Statement
This statement does not apply to this article.
Ethics Statement
This research did not involve human participants, animal subjects, or any material that requires ethical approval.
Informed Consent Statement
This study did not involve human participants, and therefore, informed consent was not required.
Clinical Trial Registration
This research does not involve any clinical trials.
Permission to reproduce material from other sources
Not applicable
Authors’ Contribution
- Immaculate Joy Selvam: Conceptualization, Methodology, Data Collection, Analysis, Writing – Original Draft.
- Moorthi Madhavan: Visualization, Supervision, Project Administration – Review & Editing.
References
- Leese GP. NICE guideline on thyroid disease: where does it take us with liothyronine? Thyroid Res. 2020;13:7.
CrossRef - Leng O, Razvi S. Hypothyroidism in the older population. Thyroid Res. 2019;12:2.
CrossRef - Razvi S, Bhana S, Mrabeti S. Challenges in interpreting thyroid stimulating hormone results in the diagnosis of thyroid dysfunction. J Thyroid Res. 2019;2019:4106816.
CrossRef - Dauksiene D, Petkeviciene J, Klumbiene J, Verkauskiene R., Vainikonyte-Kristapone J., Seibokaite A., Ceponis J., Sidlauskas V., Daugintyte-Petrusiene L., Norkus A., Zilaitiene B. Factors associated with the prevalence of thyroid nodules and goiter in middle-aged euthyroid subjects. Int J Endocrinol. 2017;2017:8401518.
CrossRef - Kushchayev S. V., Kushchayeva Y. S., Tella S. H., Glushko T., Pacak K., Teytelboym O. M. Medullary thyroid carcinoma: an update on imaging. J Thyroid Res. 2019;2019:1893047.
CrossRef - Assaad S., Helal S., Bondok M., Abdewahab M., Saber A. MON-573 Comparative study between clinical examination and ultrasonography of the thyroid gland as a screening for thyromegaly and/or thyroid nodules among Alexandria population. J Endocr Soc. 2019;3(Suppl 1):MON-573.
CrossRef - Kumar V., Webb J., Gregory A., Meixner D. D., Knudsen J. M., Callstrom M., Fatemi M., Alizad A. Automated segmentation of thyroid nodule, gland, and cystic components from ultrasound images using deep learning. IEEE Access. 2020;8:63482-63496.
CrossRef - Ballal S, Soundararajan R, Bal C. Re-establishment of normal radioactive iodine uptake reference range in the era of universal salt iodization in the Indian population. Indian J Med Res. 2017;145(3):358-364.
CrossRef - Harrap M. J. M., Hempel de Ibarra N., Whitney H. M., Rands S. A. Reporting of thermography parameters in biology: a systematic review of thermal imaging literature. R Soc Open Sci. 2018;5(12):181281.
CrossRef - González J. R., Conci A., Moran M. B. H., Araujo A. S., Paes A., Damião Ch., Fiirst W. G. Analysis of static and dynamic infrared images for thyroid nodules investigation. In: 2019 IEEE/ACS 16th International Conference on Computer Systems and Applications (AICCSA); 2019; Abu Dhabi, United Arab Emirates:1-7.
CrossRef - Magalhães C., Vardasca R., Mendes J. Recent use of medical infrared thermography in skin neoplasms. Skin Res Technol. 2018;24(4):587-591.
CrossRef - Zhang L., Guo H., Li Z. Application of medical infrared thermal imaging in the diagnosis of human internal focus. Infrared Phys Technol. 2019;101:127-132.
CrossRef - Gulias-Cañizo R., Rodríguez-Malagón M. E., Botello-González L., Belden-Reyes V., Amparo F., Garza-Leon M. Applications of infrared thermography in ophthalmology. Life (Basel, Switzerland). 2023;13(3):723.
CrossRef - Lakshmi P. S., Kiran S. M., Joy T. E. A review on thermography in dentistry. J Evolution Med Dent Sci. 2018;7(10):1289-1293.
CrossRef - Ring E. F. The historical development of thermometry and thermal imaging in medicine. J Med Eng Technol. 2006;30(4):192-198.
CrossRef - Flores-Sahagun J. H., Vargas J. V. C., Mulinari-Brenner F. A. Analysis and diagnosis of basal cell carcinoma (BCC) via infrared imaging. Infrared Phys Technol. 2011;54:367-378.
CrossRef - Salles M. S., da Silva S. C., Salles F. A., Roma L. C., Faro L. E., Bustos Mac Lean P. A., de Oliverira C. E. L., Martello L. S. Mapping the body surface temperature of cattle by infrared thermography. J Therm Biol. 2016;62(Pt A):63-69.
CrossRef - Minatel Riguetto C., Minicucci W. J., Moura Neto A., Tambascia M. A., Zantut-Wittmann D. E. Value of infrared thermography camera attached to a smartphone for evaluation and follow-up of patients with Graves’ ophthalmopathy. Int J Endocrinol. 2019; 2019:7065713.
CrossRef - Verstockt J., Thiessen F., Cloostermans B., Tjalma W., Steenackers G. DIEP flap breast reconstructions: thermographic assistance as a possibility for perforator mapping and improvement of DIEP flap quality. Appl Optics. 2020;59(17):E48-E56.
CrossRef - Luo H., Yin L. Diagnostic value of superb microvascular imaging and color Doppler for thyroid nodules: A meta-analysis. Front Oncol. 2023;13:1029936.
CrossRef - Kim H. J., Shrestha A., Sapkota E., Pokharel A., Pandey S., Kim C. S., Shrestha R. A study on the effectiveness of spatial filters on thermal image pre-processing and correlation technique for quantifying defect size. Sensors (Basel, Switzerland). 2022;22(22):8965.
CrossRef - Negishi, T., Abe, S., Matsui, T., Liu, H., Kurosawa, M., Kirimoto, T., Sun, G.. Contactless Vital Signs Measurement System Using RGB-Thermal Image Sensors and Its Clinical Screening Test on Patients with Seasonal Influenza. Sensors (Basel). 2020;20(8):2171.
CrossRef - Souridi P., Chrysafi A. P., Athanasopoulos N., Siakavellas N. J. Simple digital image processing applied to thermographic data for the detection of cracks via eddy current thermography. Infrared Phys Technol. 2019;98: 174-186.
CrossRef - Hoffer, O. A., Ben-David, M. A., Katz, E., Zoltnik Kirshenabum, D., Alezra, D., Zimmer, Y., Kelson, I., Gannot, I. Thermal imaging as a tool for evaluating tumor treatment efficacy. J Biomed Opt. 2018;23(5):1-6.
CrossRef - Xing Z., Jia H. An improved thermal exchange optimization based GLCM for multi-level image segmentation. Multimed Tools Appl. 2020;79:12007-12040.
CrossRef - Pantic, I., Cumic, J., Dugalic, S., Petroianu, G. A., Corridon, P. R. Gray level co-occurrence matrix and wavelet analyses reveal discrete changes in proximal tubule cell nuclei after mild acute kidney injury. Sci Rep. 2023;13(1):4025.
CrossRef - Jin R., Luk K. D., Cheung J. P. Y., Hu Y. Prognosis of cervical myelopathy based on diffusion tensor imaging with artificial intelligence methods. NMR Biomed. 2019;32(8):e4114.
CrossRef - Deng, R., Lin, Y., Tang, W., Gu, F., Ball, A. Object-Based Thermal Image Segmentation for Fault Diagnosis of Reciprocating Compressors. Sensors (Basel). 2020;20(12):3436.
CrossRef - Khaldi B., Aiadi O., Kherfi M. L. Combining colour and grey-level co-occurrence matrix features: a comparative study. IET Image Process. 2019;13(9):1401-1410.
CrossRef - Soto, R. F., Godoy, S. E. An automatic approach to detect skin cancer utilizing active infrared thermography. Heliyon. 2024;10(23):e40608..
CrossRef - Zheng, L., Liu, F. Y., Yu, J., Cheng, Z. G., Yu, X. L., Dong, X. C., Han, Z. Y., Liang, P. Thermal ablation for papillary thyroid microcarcinoma located in the isthmus: a study with 3 years of follow-up. Future Oncol. 2022;18(4):471-480.
CrossRef - Zhang, X., Ni, T., Zhang, W.. Ultrasonography-Guided Thermal Ablation for Cervical Lymph Node Metastasis of Recurrent Papillary Thyroid Carcinoma: Is it Superior to Surgical Resection? Front Endocrinol (Lausanne). 2022;13:907195.
CrossRef - de Camargo V. M. B., Ulbricht L, Coninck J. C. P., Ripka W. L., Gamba H. R. Thermography as an aid for the complementary diagnosis of nodules in the thyroid gland. Biomed Eng Online. 2022;21(1):41.
CrossRef - Bahramian F, Mojra A. Analysis of thyroid thermographic images for detection of thyroid tumor: An experimental-numerical study. Int J Numer Methods Biomed Eng. 2019;35(6):e3192.
CrossRef - Jiang, X., Wang, Y., Wang, Y., Zhou, M., Huang, P., Yang, Y., Peng, F., Wang, H., Li, X., Zhang, L., Cai, F. Application of an infrared thermography-based model to detect pressure injuries: a prospective cohort study. Br J Dermatol. 2022;187(4):571-579.
CrossRef

