
Manuscript accepted on :15-04-2025
Published online on: 07-05-2025
Plagiarism Check: Yes
Reviewed by: Dr. Narasimha Murthy
Second Review by: Dr. Hany Akeel
Final Approval by: Dr. Prabhishek Singh
Simran , Shiva Mehta, Rishabh Sharma, Vinay Kukreja* and Ayush Dogra
Department of Computer Science and Engineering, Chitkara University Institute of Engineering and Technology, Chitkara University, Rajpura Punjab, India
Corresponding Author E-mail: onlyvinaykukreja@gmail.com
DOI : https://dx.doi.org/10.13005/bpj/3202
Abstract
Degeneration of knee cartilage is a significant health concern, particularly among the elderly and individuals with a history of joint pain. Early diagnosis and classification are crucial for effective intervention and treatment. The proposed work aims to develop an AI-based diagnostic model that combines 3D convolutional neural networks (CNN) with 3D vision transformer (ViT) to extract high-level spatial information from 3D MRI images and improve the recognition of subtle patterns in cartilage degeneration and classify degeneration into stages: healthy cartilage, mild cartilage, severe cartilage, cartilage lesions, and osteoarthritis-related changes. 3D CNN and 3D ViT were used to extract spatial hierarchies and features from MRI data and trained on annotated knee MRI scans to improve classification. 3D CNN and 3D ViT models outperform the methods in the classification of knee cartilage degeneration, providing accurate and reliable disease detection for bio-medical purposes. The model achieved an accuracy of 90.46%. Combining 3D CNN with a 3D ViT effectively identifies cartilage degeneration in the knee. The technology helps increase diagnostic accuracy, shorten analysis time, and create personalized treatment plans. This strategy can improve patient outcomes through timely intervention and is particularly useful for early diagnosis and treatment of degenerative diseases.
Keywords
Biomedical Imaging; Cartilage Degeneration Classification; Knee Cartilage Degeneration; MRI Image Analysis; 3D Convolutional Neural Network (3D CNN); 3D Vision Transformer (3D ViT)
Download this article as:| Copy the following to cite this article: Simran S, Mehta S, Sharma R, Kukreja V, Dogra A. Synergistic Integration of 3D CNN and Vision Transformers for Enhanced Bio-Medical for Knee Cartilage Pathology Detection. Biomed Pharmacol J 2025;18(2). |
| Copy the following to cite this URL: Simran S, Mehta S, Sharma R, Kukreja V, Dogra A. Synergistic Integration of 3D CNN and Vision Transformers for Enhanced Bio-Medical for Knee Cartilage Pathology Detection. Biomed Pharmacol J 2025;18(2). Available from: https://bit.ly/3EPn6Hb |
Introduction
Knee chondromalacia is a widespread complaint that affects a large number of people, such as the elderly or those who have a history of knee injuries. This leads to suffering, decreased ability to move, and stiffening, having a massive influence on the standard of living. This condition is a significant cause of disability and, in most cases, a disease that involves the gradual breakdown of cartilage in the joints. Magnetic Resonance Imaging (MRI) and Computer tomography (CT) scans are conventional diagnostic tools with poor sensitivity in the early detection of the initial stages of degenerative changes and quantitative assessment of cartilage health. The significant health concerns of knee cartilage degeneration are in the ageing population, excessive mechanical stress, and those who have a history of joint injuries. Cartilage degeneration is the ability of a joint to function correctly, which can cause pain, reduced mobility, and stiffness. This condition is a leading cause of disability and knee pain, especially in older generations; it can also affect younger due to injury.1
It is crucial to understand knee cartilage degeneration and mitigate its impacts. The proposed study’s primary focus is the classification of knee cartilage degeneration using a combination of 3D CNN and a 3D vision transformer. The 3D CNN is used for feature extraction, and the Transformer is used for classification for bio-medical purposes. The five classes utilized in this study are healthy cartilage, mild cartilage degeneration, severe cartilage degeneration, cartilage lesions, and osteoarthritis-related changes. The knee joint is a complex structure consisting of the femur, tibia, and patella, and the ends of this bone are covered with cartilage or smooth tissue that acts as a cushion.2 The two main types of cartilage in the knee are articular cartilage and meniscal cartilage. An articular cartilage covers the ends of the bones in the joint. Also, it provides a smooth surface for movement, but compared to the meniscal cartilage, it provides stability and cushioning that contains two wedge-shaped discs.3 Meniscal cartilage is a flexible tissue between the knee thigh and shin bone that provides cushioning by distributing body weight evenly around the entire knee surface. However, sudden turns and twists can cause knee tears in the articular or meniscus cartilage while walking.4 So, over time, knee cartilage can wear down due to the potential for cartilage loss on the knee, or tissue quality degenerates with overuse and ageing. The knee cartilage pain, injuries, or locking of the knee can lead to difficulties while running, walking, and doing other activities. Pain is the most common symptom of knee cartilage damage, but recurring swelling is a standard warning sign.5 So, it can be difficult to point to cartilage damage as the reason for the knee pain. The symptoms of knee cartilage locking sensation while moving the joint, catching, or when knee blends can feel it snag during motion. The multidisciplinary team of medical doctors can diagnose and treat it as a knee injury.6 Knee cartilage degeneration cannot be cured, but many treatments and strategies help to improve the patient’s condition, such as medications like acetaminophen or NSAIDs, topical analgesics, physical therapy, and lifestyle modifications like weight management, low-impact exercise, corticosteroid injections, surgical options like arthroscopy, osteotomy, or joint replacement.7 Those treatments improve the patient’s quality of life, and the motive of these treatments is to reduce pain, improve joint function and inflammation, and promote overall well-being. With medical imaging and data analysis advancements, techniques revolutionized its ability to understand and manage knee cartilage degeneration. Traditional imaging modalities such as MRI and X-rays, computed tomography (CT), and ultrasound imaging, optical Imaging, quantitative imaging biomarkers, machine learning & AI integration, biomechanical analysis, and molecular Imaging give necessary insights into the structural changes in cartilage and bone.8 These technologies provide detailed information on cartilage structures and compositions, generating research and clinicians to find disease progression, calculate treatments for effectiveness, and develop some new strategies. 9 Researchers can improve their understanding of knee cartilage degeneration and patient outcomes with the composition of various imaging modalities and analysis techniques. These techniques have disadvantages in detecting early-stage degeneration and quantifying subtle changes in cartilage health.10
With the recent advancements in deep learning, medical imaging analysis has been transformed with the prominent use of 3D (CNNs) in volumetric data analysis. Still, CNNs remain limited in capturing long-term dependencies and contextual information, which is essential for classification purposes. The deficiencies discussed above are crucial, and this research aims to develop a fresh combined model of 3D CNNs and 3D (ViTs). Local features are identified using the 3D CNN, while the ViT is used to determine global spatial hierarchies. This integrated approach is expected to improve the accuracy of classifying knee cartilage degeneration into five progressive stages with the help of both models, which should provide a detailed feature extraction capability. 3D CNN provides new possibilities for analyzing complex 3D medical images. Traditional 2D CNN processes only flat images but can handle volumetric data, unlike 3D CNN. It is well-suited for CT and MRI scans that give detailed 3D representations of the knee joint. 3D CNN applies convolutional filters to analyze three-dimensional data, capturing spatial hierarchies and patterns across different plates.11 Its ability to allow for the extraction of features that are not declared in 2D slices improves the detection of early cartilage and facilitates a more accurate assessment of cartilage degeneration. 3D CNN can be trained in clinical settings to automatically segment and classify cartilage regions or identify degeneration patterns and predict disease progression. The automatic method can improve diagnostic accuracy, reduce the time required for analysis, and support personalized treatment planning.12 Recently, transformers have been used in medical Imaging, initially developed for natural language processing tasks. The transformers are mainly helpful in capturing long-range dependencies and contextual information, making them valuable tools for analyzing complex image data. However, knee cartilage degeneration transformers are utilized to improve the performance of the 3D CNN by integrating contextual information and enhancing feature representation. The Transformer employed self-attention mechanisms to prioritize relevant features in input data, disregarding less critical information.13 A transformer can understand cartilage degeneration, and its progression is highly due to its ability to capture global dependencies and contextual relationships. Integrating 3D CNN and Transformer represents a promising method for advancing the analysis of knee cartilage degeneration. At the same time, transformers improve 3D CNN spatial feature extraction from volumetric images by providing contextual insights and enhancing data interpretation.
Contributions of the Study
Integrating two methods, 3D CNN and ViT Transformer for knee cartilage degeneration combines advanced deep learning techniques to improve predictive accuracy and interpretability. So, there are some main contributions of this model are:
3D CNN enhances feature extraction and representation by capturing spatial features in volumetric data like MRI scans by leveraging 3D structure or can identify intricate patterns and degenerative changes in knee cartilage. Meanwhile, the Transformer captures long-range dependencies and contextual relationships between regions in the scan.
Knee cartilage degeneration is essential in medical research to improve understanding, treatment, quality of life, and preventive measures and drive research for enhanced joint health management.
Research on Knee cartilage degeneration improves understanding of cartilage cell biology, extracellular matrix behavior, chondrocyte behavior, tissue repair, and ageing treatments.
Related work
The previous research studies focused on four factors contributing to knee cartilage degeneration: 1. AI and Machine Learning for Knee Disease Detection and Classification, 2. Predictive Modeling and Risk Assessment, 3. AI in Treatment Planning and Outcome Prediction, and 4. Integration of AI with Imaging Technologies.
AI for Knee Disease Detection and Classification
Artificial intelligence (AI) and machine learning are essential aspects of medical diagnostics that detect and classify knee diseases. AI and ML are the branches of computer science that create a system that can do tasks like learning from data, problem-solving, decision-making, and reasoning. In comparison, ML is a subset of AI. AI includes training algorithms to learn from predictions or decision-based data.14 At the same time, the ML model enhances their performance with extra data exposure. Some techniques help to detect knee diseases for image-based detection, such as X-rays, MRI scans, and ultrasounds. The machine learning model uses X-ray images to detect the signs of knee diseases. Deep learning models like CNN are utilized with MRI scans to clarify abnormalities like bone marrow and cartilage loss or meniscal tears.15 Machine learning algorithms also use ultrasound images to identify condition. 16 It’s crucial for personalized treatment plans and predicting disease progression, predictive analytics, and assessing risk based on historical data. This prediction efficiency generates early intervention and customized management methods, potentially slowing disease progression and improving patient results.17 AI and ML integrate with different data sources, such as imaging outcomes and clinical history, to comprehensively view the patient’s condition. AI and ML improve knee disease detection and classification by providing advanced diagnostic tools to enhance accuracy and personalized treatment, thus improving patient care and clinical practice.
Predictive Modeling and Risk Assessment
Knee cartilage is gradually becoming important in healthcare for predictive modeling, risk management, and understanding complex issues related to cartilage deterioration. Using stable techniques, machine learning, and biomechanical insights, predicted cartilage health results are based on the input data, whereas the risk assessment evaluates the likelihood of these results based on input data, risk assessment, Individual characteristics, and lifestyle factors.18 Predictive modeling of knee bone health uses regression analysis and machine learning algorithms to analyze big data, including demographic information, lifestyle choices, medical history, genetic predispositions, and detailed information (like MRI scans). 19 Advanced learning techniques like random forests or neural networks can address irregular relationships in the data and predict cartilage more accurately. Biomechanical modeling is essential for predicting the structure of knee cartilage. The technology simulates the mechanical and physical stresses the knee joint experiences during various activities. By understanding the different forces and movements that affect the knee over time, doctors and scientists can predict which activities are at particular risk of damaging the cartilage in individuals. Knee fracture risk assessment tools identify modifiable and no modifiable factors contributing to the risk prediction model, such as age, gender, and genetic predisposition. As we age the risk of cartilage damage or the likelihood of osteoarthritis increases due to wear and tear and genetic factors that predispose some people to cartilage damage.20 Risk assessment can identify, and address risk assessment can identify and address moderate risk factors such as body mass index (BMI), physical activity, and knee injury. Measuring body weight or repetitive tasks that may cause cartilage wear can identify these conditions in patients by assessing the risk and making recommendations to reduce their effects, such as recommending safety and weight control. 21 Predictive model risk assessments are essential for improving health and treatment planning through early identification of individuals at high risk of knee osteoporosis, facilitating the inclusion of such low-impact exercise and routine maintenance. Prediction models can also recommend treatment, such as physical therapy, or surgery, such as knee replacement.22 Personalized treatment plans delivered through predictive models allow for personalized interventions that target individual risk, potentially improving outcomes and reducing the risk of osteoporosis more gently.
AI in treatment planning and outcome prediction
AI uses machine learning algorithms and data analytics to create and implement treatment strategies, predict patient outcomes with unprecedented accuracy and efficiency, and provide outcome prediction in various medical conditions. For medical planning, AI improves the accuracy of medical decisions by analyzing a patient’s medical history, genetic information, health status, and current andrology; intelligent algorithms can interpret medical images such as MRI and CI scans to identify tumors accurately. 23 These algorithms use deep-learning techniques to identify subtle patterns invisible to the human eye. AI also suggests the best options based on the patient’s condition, allowing for personalized treatment plans, especially in cases where modern technology cannot meet the patient’s needs. It plays a crucial role in medical planning by predicting treatment outcomes based on historical data from many patients. This predictive capability can used to try different treatments, helping doctors predict potential outcomes and side effects before implementing specific strategies. 24 For example, in heart disease, AI can calculate the likelihood that a patient will respond to a particular intervention, such as medication or surgery, allowing for more personalized treatments and eliminating costly and time-consuming trial and error. The benefits of patient AI factors play a crucial role in assessing patient expectations and managing long-term health outcomes. 25 Machine learning models can analyze a wide range of data, including electronic medical records, test results, and patient-reported outcomes, to identify conditions and predict the spread of disease. 26 AI can predict the likelihood of recurrence in cancer patients and the complexity of chronic diseases such as diabetes. This prediction is based on a complex process that combines many variables, allowing for a better understanding of additional healthcare resources and also helping to influence risk, allowing doctors to prioritize and allocate intervention more effectively. AI can help manage patients with chronic obstructive pulmonary disease (COPD) by predicting exacerbations and suggesting preventive measures to reduce hospitalizations and improve the Bio-Medical environment quality of life.
Integration of AI with Imaging Technologies
Integrating AI and technology is essential to revolutionize diagnosis by improving the accuracy and efficiency of diagnosis and treatment. Medical Imaging relies on technologies such as MRIs, CT scans, X-rays, and ultrasounds to provide valuable insight into the human body’s inner workings. The sheer volume of data generated by these imaging techniques and difficulty interpreting that data pose significant challenges. AI has revolutionized the imaging industry by improving interpretation and automating labor-intensive processes with machine learning algorithms and data processing capabilities. The role of AI in machines begins with the ability to analyze large data sets with high quality and accuracy. Deep learning algorithms can be trained on large datasets to identify subtle patterns and abnormalities confusing the human eye. 27 AI electronic systems can detect small changes in scans to detect early signs of cancer, stroke, or lung disease, improving accuracy and facilitating early intervention, often a problem for better treatment and outcomes. In addition, the integration of AI and technology is streamlining work and reducing the workload of doctors. AI-powered tools automate routine tasks such as segmentation and classification, allowing radiologists to focus on complex patients. AI can also help solve critical problems by quickly flagging signs and enabling essential situations to be rapidly resolved.28 Another crucial benefit of drawing skills is their role in developing sound, consistent images. AI algorithms can perform noise reduction, image enhancement, and artifact correction to increase the clarity and efficiency of scientific research. This development is perfect for procedures such as MRI and CT scans, where image quality can affect the accuracy of diagnosis.29 AI helps generate more reliable data for analysis and interpretation, ultimately contributing to more diagnoses by refining image quality. Integrating AI with imaging technologies provides a potential for personalized medicine, and it analyzes data with patient-specific information, such as generic profiles and medical histories, to develop tailored diagnostic and treatment plans.30 This customized approach improves the effectiveness of treatment and decreases the risk of adverse effects. Local features are identified using the 3D CNN, while the ViT is used to determine global spatial hierarchies. This integrated approach is expected to improve the accuracy of classifying knee cartilage degeneration into five progressive stages with the help of both models, which should provide a detailed feature extraction capability. 3D CNN provides new possibilities for analyzing complex 3D medical images
Materials and Methods
The methodological framework includes a detailed plan and procedures for conducting research and collecting data. It ensures the reproducibility, validity of findings, and transparency. The proposed work divided the methodological framework into four sections. In the first data management, 3D CNN Architecture, 3D transformer integration, and classification are illustrated, as shown in Figure 1.
 |
Figure 1: Overview of Methodological FrameworkClick here to view Figure |
Data management
Data management is essential in the methodology section for many reasons. It ensures that data is collected or stored and processed sequentially and securely, improving the reliability and accuracy of the research findings. Proper data management helps researchers handle vast amounts of data efficiently, maintain data integration and inconsistencies, or minimize errors. Effective data management aids in organizing data in an efficient way that makes it easy to analyze and interpret, ultimately supporting robustness and credible conclusions. Moreover, data management in the methodology section is crucial for ensuring, transparency, and reproducibility of research outcomes. In this study, the proposed work divided data management into data collection and preprocessing. The study which comprises 3D knee MRI scans. Some of the data preprocessing steps include but are not limited to, resizing 2D DICOM images to 3D volumes, Pixel normalization, and Data augmentation, including rotation and translation flipping, among others. This slightly improves the class balance, enhancing the model’s reliability, as shown in Figure 2.
 |
Figure 2: Overview of Methodological FrameworkClick here to view Figure |
Data Collection
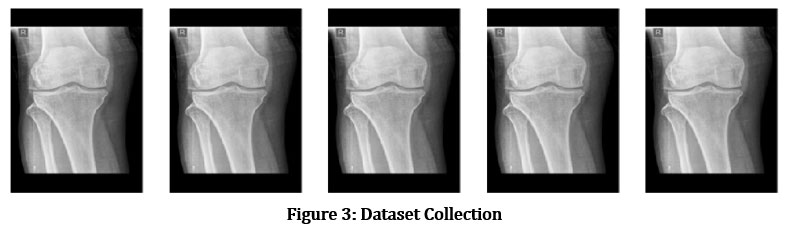
The current study on knee cartilage degeneration uses data from the MRnet datasets collection, which has been used for research, leveraging a large dataset containing various information types, as shown in Fig 3. To analyze this data, the proposed works on advanced models, specifically 3D CNN and 3D ViT. In the current study, AI techniques are also used to improve the interpretation of predictive models and deepen our understanding of the factors contributing to cartilage degeneration. The OAI provides participants with long-term information, including clinical assessments, visual outcomes, and patient history results in a Bio-Medical environment. These measurements are important in assessing the progression of cartilage degeneration and other joint conditions. The data is collected from the Kaggle website, and the link is https://www.kaggle.com/datasets/sachinkumar413/ osteoporosis-knee-dataset-preprocessed128x256. Some sample images are shown in figure 3.
 |
Figure 3: Dataset CollectionClick here to view Figure |
Data Preprocessing
Preliminary data include several vital steps to study knee cartilage degeneration using the OAI and MRnet datasets. This information is valuable for assessing MRI imaging and provides essential information for understanding cartilage degeneration. This preparation includes several vital steps to prepare the medical for quality analysis using advanced machine learning models. An MRNet data containing knee MRI scans in DICOM format is the first dataset to convert all 2D images into 3D volumes. These volumes are then converted to a standard size (e.g., 64* 64*64 pixels) to normalize the input data. These pixel intensities are also normalized to a single measurement to ensure observation consistency. Finally, the program uses data augmentation techniques such as rotation, translation, and inversion to increase the training set’s variability and improve the model’s robustness.
Normalization
Normalization is often essential to improve model performance and stability in tasks such as analysis of knee cartilage deterioration in MRI scans. Batch Normalization (BN) is a commonly used technique to train all layers normally in small batches. For the given explicit x, BN first calculates the mean value of the process in the minimum batch, “meanB” and the variable number of the process “VarB“. Then, the normalized 1x^. The function is calculated as follows in Equation 1:

Where the normalized will be scaled, and instead, a small constant ϵ will be used to avoid division by zero equation 2:
![]()
And γ and β are not learned. Regarding knee cartilage degeneration, BN ensures that the feature maps extracted from MRI scans maintain consistent distributions, make it easier for the network to learn relevant patterns, and enhance diagnostic accuracy.
Resampling
Resampling in deep learning includes adjusting data dimensions and resolution to maintain consistency or suitability for model input. Deep learning resampling, especially for knee cartilage degeneration analysis from MRI scans, involves adjusting data spatial resolution to manage consistency and enhance model performance. Resampling can be crucial when integrating data from various sources and standardizing input sizes for neural networks. It involves either up-sampling (increasing resolution) or down-sampling (decreasing resolution). In the downsampling to minimize the resolution, the image is often reduced by averaging or pooling with each pixel. xi, j The output is computed as equation 3 follows:
![]()
N is the downsampling factor, and (p, q) are the indices in the down-sampled region. For up-sampling resolution, interpolation techniques, such as bilinear or cubic interpolation, upsampled images with a new pixel value, are used. xi, j are evaluated by equation 4:
![]()
The weights are derived from While wk,l are the surrounding pixels used for calculations. The accurate sampling ensures that MRI scans are uniformly processed in knee cartilage degeneration, which is essential for training CNN to detect and classify the condition reliably.
Converts 2D images into 3D volume
Converting 2D information into 3D is not always necessary for classifying 3D data, but it may be crucial depending on the application. To convert 2D images into a 3D volume, the following steps are typically involved:
Slice Ordering
Slice ordering is necessary to transform 2D images into 3D volumes. The proposed work acquires multiple 2D slices from an imaging device, each representing a cross-sectional view. Additionally, these slices must be registered and scaled to reconstruct the 3D volumes accurately. Correct ordering is necessary to avoid interference in the reconstruction of the 3D model, and it should be verified before the stacking phase. In the mathematical concept of slice ordering, suppose each 2D slice. Ii (x,y) has a corresponding position zi in the z-axis, ensuring that z1 < z2 <…< zn for slices I1, I2…, In. The sequence of slices is sorted according to Z-coordinates using a simple sorting algorithm equation 5:
![]()
A series of 2-dimensional slices that stack correctly to form a 3-dimensional unit.
Stacking Slices
Stacking of slices to prepare the cut for three-dimensional packaging. The planning process involves assembling the slices to form a 3-dimensional stacking of the 2-dimensional slices along a new dimensional (usually the z-axis). The method of aligning the slices in the Z-axis is controlled by special software or imaging equipment, which creates a three-dimensional array without gaps or overlapping slices. Stacking is correctly placing 2D forms to create a 3D pixel grid, where each pixel V(x,y,z) corresponds to a specific location in the 3D space. If the slices are parallel to the Z-axis by a ∆z, the 3-dimensional volume can be expressed as equation 6:
![]()
A 3D pixel grid where each slice is placed according to its depth.
Spatial Calibration
Spatial calibration determines and corrects the exact dimensions of a 3D volume, ensuring that the sizes and distances of the word are accurately defined. To avoid interference, use the calibration function of the imaging software to evaluate and adjust the data outside of the imaging equipment or scanning settings. Spatial calibration converts pixel coordinates to real-world coordinates to ensure that the physical dimensions of 2D slices match their dimensions in 3D space. In the mathematical notations, given the pixel spacing sx and sy In the x and y directions and the thickness of the ∆z segment, the real-world coordinates (X, Y, Z) of the pixel are calculated as equation 7:
![]()
This technique creates spatially accurate 3D volumes where pixel dimensions accurately reflect actual measurements.
Resolution Adjustment
The resolution must be adjusted according to the slice size to achieve the exact resolution across the entire 3D volume. This process involves ensuring consistent resolution, ensuring 3D reproduction, preserving image quality, and preventing noise through techniques such as bilinear or cubic interpolation. The exact resolution across the 3D volume is achieved by adjusting the data to retrieve if the 2D slice resolution or difference changes. This can be done using mathematics such as trilinear interpolation equation 8:
![]()
Where Wijk are weights based on the interpolation method and pixel values are resampled. This results in a 3D volume with a uniform resolution, essential for accurate visualization and analysis.
Volume Validation
This is the final step in the work to validate the resulting 3D volume to ensure it is considered an exciting model. This includes visual inspection and the ability to perform adequate testing against known or used standards. Volume validation is a process that ensures the accuracy and completeness of a 3D reconstruction of a volume to ensure it is considered an original 2D part. This may include visual inspection, comparison to known standards, or quantitative measurements. The result is a 3D volume that is recognized and ready for analysis, visualization, or modeling.
3D CNN Architecture
The architecture typically includes numerous layers of 3D convolutional filters that operate on 3D patches of the input volume, such as MRI slices. These filters maintain spatial context by extracting spatial information in all three dimensions to recognize the minute alterations linked to cartilage degradation. Pooling layers, which come after convolutional layers, lower the spatial dimensions while keeping the most noticeable characteristics, increasing the computational efficiency of the network. The final layers are fully linked, transferring acquired attributes to the output space, often a binary or multi-class classification, like deteriorated vs. healthy cartilage. The typical steps for 3D CNN architecture include:
Model design
The model architecture consists of a local 3D CNN for capturing local features and a global 3D ViT model for capturing the international context of the video. The 3D CNN contains several convolutional and max-pooling layers that extract the spatial hierarchy from the MRI volumes. The ViT model uses self-attention to pay special attention to features essential to the classifier and recognizes long-range interactions. The model design uses the OAI MRNet dataset, which includes MRI scans of the knee, to provide images and labels for cartilage degeneration. The dataset is preprocessed by normalizing pixel intensities, resizing 3D MRI volumes, and applying data augmentation techniques such as random rotations, translations, and flips to increase the dataset’s variability and improve model robustness. Firstly, the input layer is defined to match the dimensions of the preprocessed MRI scans. Then, 3D convolutional layers are added to extract features for MRI scans. Rectified Linear Unit activation functions introduce non-linearity and allow the network to learn more complex patterns. After that, 3D max-pooling layers are applied to reduce the spatial dimensions of the feature maps, which helps minimize computation and control overfitting. Furthermore, after convolutional layers, BN is added to stabilize the training process by normalizing activations. Table I shows that fully connected layers interpret features extracted by convolutional layers.
Table 1: 3D CNN Model Layers Design for Knee Cartilage Degeneration Classification
| Layer Type | Number Of Filters | Filter Size (Depth x Height x Width) | Stride (Depth x Height x Width) | Padding | Output Size (Depth x Height x Width x Channels) | Activation Function |
| Input Layer | – | – | – | – | 64 x 64 x 64 x 1 | – |
| 3D Convolution Layer | 32 | 3 x 3 x 3 | 1 x 1 x 1 | Same | 64 x 64 x 64 x 32 | ReLU |
| 3D Max Pooling | – | 2 x 2 x 2 | 2 x 2 x 2 | Valid | 32 x 32 x 32 x 32 | – |
| 3D Convolution Layer | 64 | 3 x 3 x 3 | 1 x 1 x 1 | Same | 32 x 32 x 32 x 64 | ReLU |
| 3D Max Pooling | – | 2 x 2 x 2 | 2 x 2 x 2 | Valid | 16 x 16 x 16 x 64 | – |
| 3D Convolution Layer | 128 | 3 x 3 x 3 | 1 x 1 x 1 | Same | 16 x 16 x 16 x 128 | ReLU |
| 3D Max Pooling | – | 2 x 2 x 2 | 2 x 2 x 2 | Valid | 8 x 8 x 8 x 128 | – |
| 2D Convolution Layer | 256 | 3 x 3 x 3 | 1 x 1 x 1 | Same | 8 x 8 x 8 x 256 | ReLU |
| 3D Max Pooling | – | 2 x 2 x 2 | 2 x 2 x 2 | Valid | 4 x 4 x 4 x 256 | – |
| Flatten | – | – | – | – | 16,384 | – |
| Fully Connected | 512 | – | – | – | 512 | ReLU |
| Dropout | – | – | – | – | – | – |
| Fully Connected | 1 | – | – | – | 1 | Sigmoid/Softmax |
Model configuration
The model configuration involves compiling the model using the Adam optimizer, choosing a loss function, tracking accuracy, training on preprocessed MRI scans, evaluating performance on a test set, and regularizing the model with dropout layers to reduce overfitting risk. The model’s performance is assessed using metrics like accuracy, precision, recall, and F1-score, which are used for detailed performance assessment. The input layer uses 64x64x64 with one channel for 64x64x64 images. 3D convolution layers apply a set of filters to the input data, 3D max pooling reduces feature map size, flattens output into a 1D vector, performs classification using convolutional layers, drops units to prevent overfitting, and outputs Sigmoid or Softmax for binary or multi-class classification. The model configuration Table II provides detailed information on each layer in a 3D CNN architecture, including filter number, size, stride, padding, output size, and activation functions. The model architecture consists of a local 3D CNN for capturing local features and a global 3D ViT model for capturing the international context of the video. The 3D CNN contains several convolutional and max-pooling layers that extract the spatial hierarchy from the MRI volumes. The ViT model uses self-attention to pay special attention to features essential to the classifier and recognizes long-range interactions, as shown in Table 2.
Table 2: 3D CNN Model Overview and Statistics
| Aspect | Description | Value/Setting |
| Optimizer | The algorithm is used to minimize the loss function during training. | Adam |
| Learning Rate | The step size for updating model weights. | 0.001 |
| Loss Function | The function is used to calculate the difference between predicted and actual values. | Binary Cross-Entropy (binary classification) |
| Categorical Cross-Entropy (multi-class classification) | ||
| Batch Size | The number of samples processed before the model weights are updated. | 32 or 64 |
| Number of Epochs | The total number of passes through the entire training dataset. | 50-100 |
| Dropout Rate | The fraction of neurons dropped during training to prevent overfitting. | 0.5 |
| Weight Initialization | The strategy for initializing the model weights before training begins. | He Normal (or Xavier) |
| Regularization | Techniques used to reduce overfitting. | L2 Regularization (optional) |
| Early Stopping | A technique to halt training when no improvement is seen in the validation loss. | Monitor validation loss with patience (e.g., 5 epochs) |
| Data Augmentation | Techniques applied to artificially increase the size of the training dataset. | Rotations, Flips, Intensity Shifts |
Transformer integration
The 3D CNNs and 3D ViT are combined to classify knee cartilage degeneration is driven by the need for a model that can handle complex spatial relationships in 3D medical images, providing a robust, accurate, and interpretable model capable of effectively diagnosing and grading knee cartilage degeneration from MRI scans. The Transformer’s global context awareness and long-range dependency collecting abilities are combined with CNN’s local feature extraction capacity. From 3D MRI scans, CNN extracts local features. These features are then embedded into a form appropriate for the vision Transformer. The Transformer processes the embedded tokens to get global relationships. The combined outputs from the CNN and Transformer create a comprehensive feature representation. Finally, the outputs are aggregated and sent through a classification layer to the cartilage degeneration class as predicted. Additionally, the Transformer creates attention maps to help in decision-making.
Feature embedding
In this integrated approach, the knee MRI scans are first processed by the 3D CNN to extract detailed spatial features. These features cover aspects of cartilage morphological features, including thickness, texture, and lesion presence. Then, the CNN flattens these feature maps into high-dimensional vectors by creating feature maps that capture these fine features. These vectors act as the feature embedding to encode the spatial and structural details of the knee cartilage. The 3D CNN’s feature map output is separated into smaller 3D patches, each embedded into a vector space with a lower dimension. The 3D CNN output FCNN is divided into non-overlapping patches Pi,j,k. In the mathematical representation of patch formation is shown in equation 9.
![]()
In the linear embedding, each patch Pi,j,k It is flattened and passed through a linear projection layer to create embeddings, equation 10.
![]()
Whereas, WE and bE are learnable parameters of the linear projection. Transformers require positional encodings to be applied to the patch embedding because they do not naturally encode spatial information, equation 11.
![]()
Transformer architecture
The transformer architecture is designed to handle sequential data, but it processes 3D CNN feature embeddings in this integration. The Transformer’s self-attention mechanism enables it to understand the global context of feature embeddings, learning the relationships and dependencies between different cartilage regions. Each feature embedding is treated as the token, and the transformer models interactions between these tokens, capturing how different parts of cartilage relate to each other and identifying patterns of degeneration. The Transformer’s multi-head self-attention layers analyze these embeddings to identify local and global characteristics that lead to cartilage degeneration. Figure 4 depicts the transformer architecture.
 |
Figure 4: Integration of 3D Vision Transformer with 3D CNNClick here to view Figure |
After processing the patch embeddings, the 3D Vision Transformer records global relationships throughout the MRI scan’s 3D environment. The Transformer computes dependencies between various patches using self-attention, equation 12.

Whereas the query, key, and value matrices that come from the patch embeddings are Q,K,V, and the dimensionality of the vital vector is dk. Multiple attention heads are utilized to capture various relationship elements, equation 13.
![]()
Where headi and 𝑊𝑜 represents the output from the 𝑖-the attention head is the learnable weight matrix. An output of the attention layer is passed through a feed-forward network, as shown in equation 14.
![]()
Where weight and biases of the FFN are W1, W2 and b1, b2. Ultimately, the final output of the Transformer FTransformer Contains globally refined features.
Feature aggregation
After passing through the ViT model, the outputs are combined with the original CNN features to depict the knee cartilage completely. Combining the modified data with the unprocessed features that the CNN extracted is known as feature aggregation. Concatenation and fusion are two techniques that can be used to do this. They combine the global context supplied by the ViT model with the specific local features extracted from the CNN. The combined elements give the cartilage a rich, multidimensional representation that improves the model’s capacity to precisely determine and categorize the degree of deterioration. The CNN and transformer process feature extraction and processing to create a comprehensive feature representation concatenated or linearly combined by feature fusion, as shown in equation 15.
![]()
Where α is a learnable parameter balancing, the contributions of the CNN and Transformer, afterwards, the aggregated features are passed through a fully connected layer for final classification, as shown in equation 16.
![]()
Whereas Wfinal and bfinal are the weight and bias of the final classification layer, y^ Represents the predicted probabilities for each class. The model uses integrated features from the Vision Transformer and 3D CNN to accurately classify knee conditions, generating probabilities for healthy ACL tears or meniscus tears. The model is trained using Optimizer Adam Learner Rate chosen based on 0. 001 and a batch size of 32 samples. Cross-entropy loss is used to optimize the model. Measures for assessing the performance level include accuracy, precision, recall, F1 score, and AUC. The training process involves hyperparameter optimization and dropout to avoid overfitting.
Results
The study on knee cartilage degeneration shows the effectiveness of integrating 3D CNN with 3D ViT, augmented by Explainable AI techniques, in accurately identifying and classifying different stages of cartilage degeneration on a large dataset of 3D MRI scans. The Vision Transformer helped to capture global dependencies within the data, improving the model’s ability to distinguish between minute variations in degeneration stages. At the same time, the integration of 3D CNN enabled the extraction of spatial features crucial for comprehending the structural changes in cartilage. Precision, recall, F1 score, and accuracy Jaccard index (also known as the Intersection over Union (IOU)), dice coefficient, Matthews Correlation Coefficient (MCC), Cohen’s Kappa, and Area under the Precision-Recall Curve (AUC) were among the key performance indicators that were consistently high, demonstrating the model’s resilience in a variety of test scenarios. The model did very well identify between severely deteriorated cartilage and healthy cartilage. Combined with the ViT model and 3D CNN, explainable AI techniques provide a robust method for automated diagnosis of knee cartilage deterioration, enhancing patient outcomes and diagnostic accuracy and enhancing trust among medical practitioners for accurate diagnosis and treatment planning. The proposed model Acquired a classification of 90% between normal and attack. 46%, far exceeding the performance of state-of-the-art models for knee cartilage degeneration classification. Table III shows performance for each class in further detail, and as it can be observed, the model is very accurate in detecting osteoarthritis-related changes as it has F1=0. 91 and the Jaccard Index of 0. 82. Still, the performance for mild cartilage degeneration was slightly lower, indicating that there is still room for improvement in the algorithm. Based on the epoch-wise training and testing accuracy plot (Fig. 4), it can be seen that the training accuracy remains constant after the 20 epochs, and the testing accuracy also increases gradually and is characterized by overfitting. The learning rate comparison (Figure 5) also shows that a higher rate than 0. 001 gives the best results, and the hyperparameter tuning experiments depict that the best performance is achieved when the batch size is 16, as pictorially represented by Figure 5.
Performance parameters results
Table 3 presents diverse statistical metrics for assessing a classification model across numerous classes pertaining to cartilage health: Normal cartilage, A/C I, A/C II, A/C III, Cartilage lesion, and OA. All these indicators provide an overall assessment of the performance of the model. Accuracy refers to the number of actual positives estimated for each class divided by the total number of all positive observations assuming randomness. The range falls between 0.85 and 0.91 for several classes, resulting from the model’s ability to avoid false positives. Based on Table 3, the highest precision score of the model is for Osteoarthritis at 0.91, which reflects that the model gives better accuracy in this class than in other classes. Recall or Sensitivity gives the proportion of true positive observations for a range of 0.83 to 0.92. Osteoarthritis has the highest recall, therefore revealing that this class is easiest to identify by the model. The combined F1 Score, which balances precision and memory, ranges between 0.84 and 0.91, with all classes displaying outstanding performance. The highest score was again achieved in the Osteoarthritis class. The accuracy as the proportion of the number of well-classified instances to the overall count of instances for each class is, once again, considered high, ranging between 0.84 and 0.91. The Jaccard Index was calculated to quantify the similarities between anticipated and actual values, which ranged from 0.75 to 0.82, as exhibited by osteoarthritis. A similar work is also identified with the help of another measure known as the Dice Co-efficient, and the values obtained from this vary in the range of 0.77 to 0.84, which reveals the ability of the model to predict the class margin accurately. The Matthews connection Coefficient (MCC) checks the quality of binary classifications in which MCC, ranging from 0.73 to 0.84, portray a connection between the expected and actual classes. Cohen’s Kappa, a measure of the relative observed agreement that allows for more than random chance, varies from 0.71 to 0.8, suggesting considerable agreement for most classes. The first evaluation metric is the AUPRC (Area Under the Precision-Recall Curve), which is 0.74 to 0.81, sharing the capability to balance between precision and recall, especially with the Osteoarthritis class. It can be seen that the specific model provides the highest scores for Osteoarthritis, as all its values are constantly high, proving the high effectiveness of this model in identifying this class. The low values of Mild Cartilage Damage point toward the fact that this class is challenging for the model, possibly because of proximity to other classes. Altogether, these performance measurements provide a complete picture of the model, showing its advantages and disadvantages to allow for further improvement, as shown in Table 3.
Table 3: Results Of Performance Parameters
| Classes | Precision | Recall | F1 Score | Accuracy | Jaccard Index (IOU) | Dice Coefficient | MCC | Cohen’s Kappa | AUPRC |
| Healthy Cartilage | 0.9 | 0.88 | 0.89 | 0.9 | 0.8 | 0.82 | 0.78 | 0.76 | 0.79 |
| Mild Cartilage Degeneration | 0.85 | 0.83 | 0.84 | 0.84 | 0.75 | 0.77 | 0.73 | 0.71 | 0.74 |
| Severe Cartilage Degeneration | 0.88 | 0.89 | 0.88 | 0.88 | 0.77 | 0.79 | 0.75 | 0.73 | 0.76 |
| Cartilage Lesions | 0.87 | 0.86 | 0.86 | 0.87 | 0.78 | 0.8 | 0.76 | 0.74 | 0.77 |
| Osteoarthritis-Related Changes | 0.91 | 0.92 | 0.91 | 0.91 | 0.82 | 0.84 | 0.8 | 0.78 | 0.81 |
Epoch-wise performance analysis
In knee degeneration, epoch-wise performance analysis is vital to ensure that a deep learning model learns well and generalizes well to new information. Over several training sessions, this analysis tracks critical performance parameters such as accuracy, precision, recall, and F1 score. The main goal of this work is to track the learning behaviour of the model as it processes data each time. Among these, epoch-wise performance analysis is a tool used to track deep learning models across multiple training cycles or “epochs.” In this process, 3D MRI information on knee degeneration is fed into a model to identify features corresponding to different stages of degeneration. This image shows the over 20-fold improvement of the model dividing the cartilage of knee degeneration. The training accuracy of this model is stable and reaches 90% up to 20 times. However, validation lags at 86%, as given in Figure 5. This indicates overfitting, where the learning model recognizes specific patterns for the training set but fails to recognize new elements. However, the model shows stable performance overall.
 |
Figure 5: Epoch-wise performance analysisClick here to view Figure |
Learning rate comparison
Comparing studies on knee cartilage degeneration requires evaluating how different studies affect the performance of deep learning (e.g., 3D CNN or Vision transformer) trained to classify different stages of knee cartilage degeneration using 3D MRI data. The update rate of the weighted model during back expansion at each iteration is determined by a critical hyperparameter called the learning rate. The learning rate determines how the model converges to the optimal solution. Comparisons of studies on knee cartilage degeneration are often made by training, as shown in Figure 6.
 |
Figure 6: Learning rate comparisonClick here to view Figure |
The training samples were from different subjects, and performance outcomes were measured, including accuracy, loss, precision, recall, and F1 scores. Figure 6 shows a comparison of three studies on knee cartilage degeneration classification. The model with a learning rate of 0.001 performed best, gradually increasing the time to 90% accuracy, as shown in Figure 6. The model with a learning rate of 0.01 started faster but remained at 87%. The model with the highest learning rate of 0.1 struggled to achieve 82% accuracy, exceeding the recommendation.
Hyperparameter tuning comparison
The practice of optimizing model parameters such as learning rate, batch size, and number of layers to improve performance on tasks such as knee cartilage classification is called hyperparameter tuning. This is important because these metrics impact the performance of deep learning models. If the model is not tuned, it may be too slow, unable to recognize complex patterns, or too rigid. Therefore, hyperparameter tuning is essential to achieve the best accuracy and training performance. Hyperparameter tuning experiments show lower learning rates and sizes that suit knee cartilage detection or classification. The maximum (0.90) was achieved with a run of 0.001 and a batch size 16, indicating that the model’s ability is improved. Batch size affects accuracy; accuracy generally decreases as learning increases, and the minimum learning efficiency is 0.1, as shown in Figure 7.
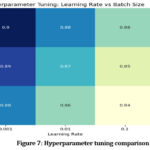 |
Figure 7: Hyperparameter tuning comparisonClick here to view Figure |
Batch, size comparison
Regarding knee cartilage degradation, batch size comparison is relevant to evaluate how different bone types affect deep learning models’ performance to classify cartilage degradation stages using 3D MRI data. The number of samples in the training data is included in the sample before each weight adjustment and is size-dependent. Models can be trained using different parameters to classify activities associated with knee cartilage degradation and evaluate how each parameter affects performance metrics, including accuracy, precision, recall, F1 score, and speed training. Several comparisons are made with small, medium, and large batch sizes to evaluate how different parameters affect the model’s ability to detect differences in cartilage degradation in MRI data. Figure 8 shows the performance of the studied model with other parameters (16, 32, and 64) to detect knee cartilage degradation. The model’s performance improves as the number of epochs increases, with batch size 16 showing the best performance. Batch size 32 shows the average performance with an efficiency of 0.87 at time 20, as shown in Figure 8. In summary, small batches (especially batch size 16) still lead to good performance over time. Evaluate the performance of the classifiers in identifying changes in healthy bones, mild cartilage, severe cartilage degeneration, cartilage, and osteoarthritis. This model has AUC scores of 0.77 for healthy cartilage, 0.89 for mild degeneration, 0.85 for severe degeneration, and 0.82 for cartilage, as shown in Figure 9. The model’s classification performance is based on higher AUC values, particularly for mild and severe cartilage degeneration. However, it struggles with osteoarthritis-related changes and healthy cartilage, as shown in Figure 9.
 |
Figure 8: Batch size comparisonClick here to view Figure |
The model’s performance is generally satisfactory but may require refinement for the accurate distinction between wholesome and osteoarthritis-related changes, as shown in Figure 9, the ROC curve.
 |
Figure 9: The ROC curves for knee cartilage classificationClick here to view Figure |
State-of-the-art comparison
Based on their accuracy percentages, several cutting-edge models for knee cartilage degeneration analysis are compared in the graph. The comparison of various models, including Hybrid 3D CNN with 3D ViT model, 3D CNN, 3D ViT, 3D U-Net, and Graph Convolutional Networks (GCNs), is used. The study analyzed the performance of 3D CNNs in detecting knee cartilage degeneration. CNNs achieved 79.33% accuracy but were lower than other models due to their limitations in capturing long-range spatial dependencies. 3D Vision Transformers outperformed CNNs with 85.17% accuracy. 3D U-Net had 75.99% accuracy, while GCNs had 82.2% accuracy. The Hybrid 3D CNN with 3D ViT model achieved the highest accuracy at 90.46%. Moreover, the Hybrid 3D CNN with ViT model is the most effective approach, followed by 3D Vision Transformers and Graph Convolutional Networks. In contrast, 3D U-Net and 3D CNNs show lower performance, as shown in Figure 10 below.
 |
Figure 10: State-of-the-art comparisonClick here to view Figure |
Discussion
Combining 3D CNN and 3D Vision Transformer (ViT) for categorizing knee cartilage degradation is a significant advancement in medical imaging, particularly addressing the challenges of confusing early recognition and staging degenerative diseases such as osteoarthritis. This work also benefited from the demonstration that the combination of the local spatial feature extraction capabilities of 3D CNN with the global contextual awareness of 3D ViT could enhance the identification and differentiation of phases of knee cartilage degeneration. The hybrid model outperformed the conventional techniques with 90.46% as the normalized accuracy, showing a step up from depending on only CNN or ViT-based models.
These results suggest that the 3D CNN is highly capable of pinpointing intricate local features of cartilage from MRI images, including thickness and texture, which are critical in differentiating early degenerative changes. However, CNN models sometimes struggle to fix long-distance relations and contextual coupling in medical images, which is essential in evaluating cartilage health in general. ViT well handles this shortcoming to capture global dependencies of the self-attention process that aids in understanding the pattern of cartilage degradation. This complementing combination enables a more complete feature representation, significantly improving classification accuracy, particularly in detecting the more subtle phases of cartilage degradation.
The model’s ability to distinguish between several grades of knee degeneration, including standard, mildly degenerative, severely degenerative, and osteoarthritis-related changes, provides potential for clinical use. Here, the model exhibited excellent sensitivity toward osteoarthritis-related changes (F1 score 0.91, Jaccard Index 0.82) relevant for early diagnosis. It was also noted that because of suboptimal sensitivity and specificity in identifying moderate cartilage degeneration, the model could be further improved to detect early signs of the condition more efficiently. This may be attributed to cartilage changes at a mild stage where they are almost invisible even by employing advanced techniques such as MRI.
Explainable AI techniques like LIME applied in this work enhance transparency in making predictions to doctors by providing them with some form of visual perception of the decision-making system. This is particularly important in clinical settings since the acceptance of automated diagnostic equipment relies on confidence in their performance. The Vision Transformer enriches the depiction of essential regions of the MRI by producing attentiveness maps, thereby improving the openness and reliability of the Vision Transformer’s forecast.
Analysis of epoch-wise and hyperparameter tuning confirms that the selected combination of learning rate 0.001 and batch size 16 offered high accuracy and less overfit. These data suggest that more model performance can be achieved with hyperparameter tuning. Moreover, a comparison of the batch sizes showed that the final overall performance was higher for the smaller batch size, which was equal to 16, most likely due to the better ability of the model to learn the generalization based on the more intensive updating of weights during training.
The developed hybrid model performs better than conventional techniques such as 3D CNNs, 3D ViT and 3D U-net models. This expounds on the effectiveness of using spatial and contextual features of feature extraction in complex medical imaging applications. The study reveals that the suggested technique advances a diagnosis’s accuracy and builds specific extermination plans regarding the extent of cartilage degeneration.
The proposed 3D CNN and 3D ViT show the potential for the early diagnosis and classification of knee cartilage degeneration. This better or higher accuracy and appealing performance outlooks support its impending application in clinical settings for improving early detection, initiating timely treatments, and developing customized regarding a particular disease or ailment] intervention strategies. Subsequent research might focus on expanding the model’s scope for recognizing early-stage degeneration and its application to other joint-related pathologies. Moreover, incorporating more extensive and diverse input data would improve the model’s applicability and helpfulness in therapy.
Conclusion
The study demonstrates the effectiveness of the combined 3D CNN and 3D ViT model in knee cartilage degeneration classification with an overall accuracy of 90.46%. 3D CNN best captures the local spatial features of MRI scans, and models with 3D vision transformers can better understand the global connections and complex patterns in the data. The combination allows the model to identify different stages of cartilage degeneration, which is a challenging process in medicine. The research aims to integrate two powerful techniques, 3D CNN and vision transformer, specifically designed to manage advanced medical data. MRI scans and other volumetric data have long been well-suited to 3D CNN, but understanding the distribution of the world into multiple beads or regions of interest has been difficult. In the state-of-the-art comparison, the hybrid 3D CNN with 3D ViT model achieved 90.46% accuracy, outperforming 3D ViT and Graph Convolutional Networks, while 3D U-Net and 3D CNNs showed lower performance. In other critical areas, they allow for the increase of The proposed works and offer a new way to improve the diagnosis of knee cartilage, making it one of the first studies to use both-like combinations in medical practice. The results show that the hybrid model can overcome the shortcomings of a single model (like 3D CNN or Transformer) alone, providing greater accuracy and efficiency. The current study addresses the complexity of medical tasks by combining two deep-learning methods to achieve effective classification. In addition, the study presents methods to manage 3D clinical data quality by providing the most appropriate information for evaluating knee health. The research aims to improve the model’s generalization ability by increasing the datasets and explanatory strategies for cognitive development. By combining images and clinical data, the predictive power and applicability of the model in the natural clinical setting can also be improved, which will help in the early diagnosis and treatment planning of cartilage degeneration.
Acknowledgment
The authors wish to extend their sincere gratitude to Chitkara University Institute of Engineering and Technology, Chitkara University, Rajpura-140401, Punjab, India, for its unwavering support in facilitating this research.
Funding Sources
The author(s) received no financial support for the research, authorship, and/or publication of this article.
Conflict of Interest
The author(s) do not have any conflict of interest.
Data Availability Statement
The data is collected from the Kaggle website, and the link is https://www.kaggle.com/datasets/sachinkumar413/osteoporosis-knee-dataset-preprocessed128x256.
Ethics Statement
This research did not involve human participants, animal subjects, or any material that requires ethical approval.
Informed Consent Statement
This study did not involve human participants, and therefore, informed consent was not required
Clinical Trial Registration
This research does not involve any clinical trials.
Permission to reproduce material from other sources
Not Applicable
Author Contributions
- Simran: Conceptualization, Writing – Original Draft.
- Shiva Mehta: Methodology, Writing – Review & Editing
- Vinay Kukreja: Supervision, Writing – Review & Editing.
- Rishab Sharma: Visualization, Supervision.
- Ayush Dogra: Visualization and Validation.
References
- Panfilov E, Saarakkala S, Nieminen MT, Tiulpin A. Predicting Knee Osteoarthritis Progression from Structural MRI Using Deep Learning. In: 2022 IEEE 19th International Symposium on Biomedical Imaging (ISBI). 2022:1-5.
CrossRef - Liu F, Zhou Z, Jang H, Samsonov A, Zhao G, Kijowski R. Deep convolutional neural network and 3D deformable approach for tissue segmentation in musculoskeletal magnetic resonance imaging. Magn Reson Med. 2018;79(4):2379-2391.
CrossRef - Alshehri S, Alahmari KA, Alasiry A. A Comprehensive Evaluation of AI-Assisted Diagnostic Tools in ENT Medicine: Insights and Perspectives from Healthcare Professionals. J Pers Med. 2024;14(4):1-35.
CrossRef - Guida C, Zhang M, Shan J. Knee Osteoarthritis Classification Using 3D CNN and MRI. Appl Sci. 2021;11(11):1-12.
CrossRef - Philpott HT, Birmingham TB, Carter MM,. Association between synovial tissue damage and pain in late-stage knee osteoarthritis: A cross-sectional study. Osteoarthr Cartil. 2024;32(11):1503-1512.
CrossRef - Kleemann RU, Krocker D, Cedraro A, Tuischer J, Duda GN. Altered cartilage mechanics and histology in knee osteoarthritis: relation to clinical assessment (ICRS Grade). Osteoarthr Cartil. 2005;13(11):958-963.
CrossRef - Kuettner KE, Cole AA. Cartilage degeneration in different human joints. Osteoarthr Cartil. 2005;13(2):93-103.
CrossRef - Chu CR, Williams AA, Coyle CH, Bowers ME. Early diagnosis to enable early treatment of pre-osteoarthritis. Arthritis Res \& Ther. 2012;14:1-10.
CrossRef - Angelone F, Ciliberti FK, Tobia GP,. Innovative Diagnostic Approaches for Predicting Knee Cartilage Degeneration in Osteoarthritis Patients: A Radiomics-Based Study. Inf Syst Front. Published online 2024.
CrossRef - Mahmoudian A, Lohmander LS, Mobasheri A, Englund M, Luyten FP. Early-stage symptomatic osteoarthritis of the knee—time for action. Nat Rev Rheumatol. 2021;17(10):621-632.
CrossRef - Wang S, Zhuang Z, Xuan K,. 3dmet: 3d medical image transformer for knee cartilage defect assessment. In: Machine Learning in Medical Imaging: 12th International Workshop, MLMI 2021, Held in Conjunction with MICCAI 2021, Strasbourg, France, September 27, 2021, Proceedings 12. ; 2021:347-355.
CrossRef - Ciliberti FK, Guerrini L, Gunnarsson AE,. CT-and MRI-based 3D reconstruction of knee joint to assess cartilage and bone. Diagnostics. 2022;12(2):279.
CrossRef - Emadi Andani M, Salehi Z. An affordable and easy-to-use tool to diagnose knee arthritis using knee sound. Biomed Signal Process Control. 2024;88:105685.
CrossRef - Shah RF, Martinez AM, Pedoia V, Majumdar S, Vail TP, Bini SA. Variation in the thickness of knee cartilage. The use of a novel machine learning algorithm for cartilage segmentation of magnetic resonance images. J Arthroplasty. 2019;34(10):2210-2215.
CrossRef - Joseph GB, McCulloch CE, Sohn JH, Pedoia V, Majumdar S, Link TM. AI MSK clinical applications: cartilage and osteoarthritis. Skeletal Radiol. Published online 2022:1-13.
- Kalo K, Niederer D, Sus R,. The detection of knee joint sounds at defined loads by means of vibroarthrography. Clin Biomech. 2020;74:1-7.
CrossRef - Azhideh A, Pooyan A, Alipour E, Haseli S, Hosseini N, Chalian M. The Role of Artificial Intelligence in Osteoarthritis. In: Seminars in Roentgenology. Vol 59. ; 2024:518-525.
CrossRef - Andriacchi TP, Favre J, Erhart-Hledik JC, Chu CR. A systems view of risk factors for knee osteoarthritis reveals insights into the pathogenesis of the disease. Ann Biomed Eng. 2015;43:376-387.
CrossRef - Su K, Yuan X, Huang Y,. Improved Prediction of Knee Osteoarthritis by the Machine Learning Model XGBoost. Indian J Orthop. 2023;57(10):1667-1677.
CrossRef - Shen L, Yue S. A clinical model to predict the progression of knee osteoarthritis: data from Dryad. J Orthop Surg Res. 2023;18(1):628.
CrossRef - Kokkotis C, Moustakidis S, Giakas G, Tsaopoulos D. Identification of risk factors and machine learning-based prediction models for knee osteoarthritis patients. Appl Sci. 2020;10(19):6797.
CrossRef - Deveza LA, Downie A, Tamez-Pena JG, Eckstein F, Van Spil WE, Hunter DJ. Trajectories of femorotibial cartilage thickness among persons with or at risk of knee osteoarthritis: development of a prediction model to identify progressors. Osteoarthr Cartil. 2019;27(2):257-265.
CrossRef - Salazar D, Rossouw PE, Javed F, Michelogiannakis D. Artificial intelligence for treatment planning and soft tissue outcome prediction of orthognathic treatment: A systematic review. J Orthod. 2024;51(2):107-119.
CrossRef - Mahmoudian A, Lohmander LS, Jafari H, Luyten FP. Towards classification criteria for early-stage knee osteoarthritis: A population-based study to enrich for progressors. Semin Arthritis Rheum. 2021;51(1):285-291.
CrossRef - Aubonnet R, Ramos J, Recenti M,. Toward new assessment of knee cartilage degeneration. Cartilage. 2023;14(3):351-374.
CrossRef - Khanagar SB, Al-Ehaideb A, Vishwanathaiah S,. Scope and performance of artificial intelligence technology in orthodontic diagnosis, treatment planning, and clinical decision-making-a systematic review. J Dent Sci. 2021;16(1):482-492.
CrossRef - Khalifa M, Albadawy M. AI in diagnostic imaging: Revolutionising accuracy and efficiency. Comput Methods Programs Biomed Updat. Published online 2024:100146.
CrossRef - Ni M, He M, Yang Y,. Application research of AI-assisted compressed sensing technology in MRI scanning of the knee joint: 3D-MRI perspective. Eur Radiol. 2024;34(5):3046-3058.
CrossRef - Lastrucci A, Wandael Y, Barra A,. Exploring Augmented Reality Integration in Diagnostic Imaging: Myth or Reality? Diagnostics. 2024;14(13):1-35.
CrossRef - Oyeniyi J, Oluwaseyi P. Emerging Trends in AI-Powered Medical Imaging: Enhancing Diagnostic Accuracy and Treatment Decisions. Int J Enhanc Res Sci Technol Eng. 2024;13(4):81-94.

