
Manuscript accepted on :27-01-2025
Published online on: 11-03-2025
Plagiarism Check: Yes
Reviewed by: Dr. Jagdish Joshi
Second Review by: Dr. Jothiraj Selvaraj
Final Approval by: Dr. Gul Ozcan
Muniraj Gupta1 , Sheetal Bhatia2, Naveen Sharma3, Nidhi Verma4, Saurabh Kumar Sharma1* and Rajkumar Brojen Singh5
1School of Computer and Systems Sciences, Jawaharlal Nehru University, New Delhi, India.
2 Department of Biotechnology, Hemvati Nandan Bahuguna Garhwal University, Dehradun, Uttarakhand, India.
3Indian Council of Medical Research, New Delhi, India.
4Department of Microbiology, Ramlal Anand College, University of Delhi, New Delhi, India.
5School of Computational and Integrative Sciences, Jawaharlal Nehru University, New Delhi, India.
Corresponding Author E-mail: saurabhsharma@jnu.ac.in
DOI : https://dx.doi.org/10.13005/bpj/3147
Abstract
Brain tumor classification is a crucial task in medical image analysis due to the complexity of the neurological system. With the rapid advancements in deep learning techniques, particularly in medical imaging, there is growing potential to enhance the accuracy and efficiency of brain tumor diagnosis using the magnetic resonance imaging (MRI). This paper proposes an optimized and low-computation deep learning model built on the backbone MobileNetv2 convolutional neural network architecture to classify the brain tumors into three categories: glioma, meningioma, and pituitary tumors. The model is trained, validated, and tested using a dataset of T1-weighted contrast-enhanced brain MR images (T1W-CE MRI). Preprocessing steps are incorporated to enhance the classification efficiency. We evaluate the model's performance on both equally and unequally distributed classes of the images and achieve an accuracy of 92.23% and 93.59%, with F1 scores of 92.21% and 93.65%, respectively, for both the distributions. The experimental results demonstrate that the proposed model efficiently classifies the brain tumors using the MR images and achieves superior accuracy to the latest literature methods and state-of-the-art models: "ResNet50, VGG16, NASNetMobile, InceptionResNetV2, and InceptionV3". Thus, the proposed model may help assisting the radiologists in fast and better diagnoses.
Keywords
Brain tumor; Classification; Convolution Neural Network; Deep Learning; MR images.
Download this article as:| Copy the following to cite this article: Gupta M, Bhatia S, Sharma N, Verma N, Sharma S. K, Singh R. B. Classification of Brain Tumor Using an Optimized Deep Learning Technique to Correlate with Disease State. Biomed Pharmacol J 2025;18(1). |
| Copy the following to cite this URL: Gupta M, Bhatia S, Sharma N, Verma N, Sharma S. K, Singh R. B. Classification of Brain Tumor Using an Optimized Deep Learning Technique to Correlate with Disease State. Biomed Pharmacol J 2025;18(1). Available from: https://bit.ly/3FooZdS |
Introduction
Cancer in critical central nervous system (CNS) regions, including the brain, represents a significant public health concern worldwide. They are characterized by high mortality rates, low survival rates, and an unfavorable impact on patient superiority of life. 1 As per GLOBOCAN 2022, CNS and brain cancers are 19th in prevalence (1.6% of all cancers) and 12th in cancer-related mortality (2.6% of all cancers).2 The cases of CNS (also including brain tumor) are consistently rising globally due to demographic transitions and various lifestyle factors that’s results by the year 2050, the number of new CNS cases worldwide is projected to reach 5,03,910, marking a staggering 56.6% increase compared to estimates of 2022 which were 3,21,879 as per “International Agency for Research on Cancer (IARC)”. This alarming trend is particularly pronounced in rapidly growing and densely populated continents such as Asia, where the number of new CNS cases is expected to rise from 1,77,139 in 2022 to 2,72,803 by 2050, signifying a 54% increase. Correspondingly, deaths in Asia due to this cancer are projected to 63.8%, increasing from 1,32,799 in 2022 to 2,17,518 by 2050.3
The formation of a tumor in the brain is due to the aberrant growth of some of the brain cells that damages the critical tissues and leads to the brain cancer. Tumors may often be divided into two categories: benign and malignant. Tumors that are benign do not spread to other tissues and mature slowly, whereas malignant tumors mature rapidly and destructively invade surrounding tissues. Over 150 types of brain tumors have been identified based on the location, size, and form of the brain. But brain tumors are mainly classified into two groups: a.) primary and b.) secondary, as shown in Fig.1. A primary tumor originates from brain cells, while a secondary tumor arises when cancer from another part of the body spreads to the brain. 4 Due to this classification, brain tumors are generally three types: gliomas, meningioma, and pituitary.5 Gliomas comprise 78% of malignant occurrences of adult brain tumors, making them the most common kind where glial cells inside the brain are responsible for gliomas. Meningioma and pituitary are benign types where meningioma develops on the membrane enclosing the brain and spinal cord.6 The pituitary gland, a key structure beneath the brain that generates hormones, is where pituitary tumors arise. Tumors are categorized into grades I to IV by the World Health Organization (WHO) according to variables such as growth rate, malignancy, recurrence, and aggressiveness. Grade I and II are considered low-grade tumors, whereas grades III and IV are categorized as high-grade tumors.7
Clinically, MRI is the most effective noninvasive tool for visualizing the anatomy and functionality of brain tumors.8 Because of the significant rate of mortality, prompt diagnosis and precise classification of tumors inside the brain enhance the chances of survival. However, due to manual diagnosis, the rate of misdiagnoses is high; therefore, using computer-aided diagnosis (CAD) is essential to helping radiologists make faster, more accurate diagnoses.9 Significant potential has been demonstrated in CAD by recent developments in deep learning (DL) techniques that explore data from several sources, such as text, audio, and images. Recently, convolution neural networks (CNNs) under deep learning have made significant progress in addressing detection and classification issues in medical imaging. CNNs have the ability to automatically extract the most valuable features from MR images and minimize the dimensionality,10,11 so that the traditional handmade features are no hardly required. However, challenges still need to be addressed, such as high error rates in large datasets, computational expense, and inadequate training.
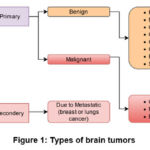 |
Figure 1: Types of brain tumors |
Because CNNs are highly data-hungry, they require extensive training data samples since, in general, the higher the training data will be give, the better the CNN model performs and accuracy. However, the medical sector is a substantial barrier because to the extensive quantity of labeled image data. Additionally, CNNs have the drawback of being computationally intensive compared to traditional machine learning methods, requiring substantial resources such as enormous quantities of Random Access Memory (RAM) for training and Graphical Units. Transfer learning offers a solution to these challenges by delivering strong performance with fewer training samples and reduced training time.12
To address these challenges, we have introduced an optimized deep learning-based approach for brain tumor classification using transfer learning, where we applied a pre-trained MobileNetv213 architecture as a base, which provides a lightweight, computationally efficient solution while maintaining high accuracy. The novelty of our work lies in combining MobileNetv2’s architecture with fine-tuning techniques, enabling classification across three tumor types: glioma, meningioma, and pituitary, while overcoming hardware and dataset limitations. Specifically, the proposed method is designed to perform smoothly on low-power devices, offering a practical tool for clinical applications. The aim of this research is to develop an efficient and accessible deep-learning model for brain tumor classification that achieves high performance with reduced computational requirements.
The main objective of this research is to design a low computationally expansive auto-computer-aided diagnosis system that classifies brain tumors without the need for extensive radiologist intervention.
Our study attempts to tackle all the above-discussed problems in contrast with existing state-of-the-art models (SOTAM) such as “ResNet50,14 VGG16,15 NASNetMobile,16 InceptionResNetV2,17 and InceptionV318“. That focuses on the classification of brain tumors using MR images into glioma, meningioma, and pituitary. In this work, transfer learning of pre-trained MobileNetv2 is used as a backbone, and they are fine-tuned explicitly on the T1W-CE MRI brain tumor dataset for feature extraction and classification. The pre-trained MobileNetv2 is further enhanced with many top layers, which are subsequently trained and assessed with significant contributions in brain tumor classification that are mentioned in section 2.
The rest of the paper structure is like that: Section 2 highlights the relevant research. Section 3 explores the materials and methods. Section 4 setup the experimental framework and evaluation measures. The results and discussion are presented in Section 5, and the study is concluded with future directions in Section 6.
Related work
Advancements in deep learning (DL) and machine learning (ML) have emerged as fundamental techniques in order to classify medical diagnoses.19,20 Similarly, numerous investigations have looked into the use of ML algorithms for brain tumor classification, including k-nearest neighbor, support vector machines (SVM), and decision trees.21-23 Furthermore, CNNs have proven to be exceptionally good at extracting prominent features, efficiently classifying using the last fully connected layers, and producing excellent outcomes in the domain of medical imaging. The latest advances in human-driven research on magnetic resonance imaging-based detection, segmentation, and classification of brain tumors have become pressing priorities, as they hold the potential to facilitate timely and appropriate treatment interventions.24-26 In,27 a segmentation method combining Otsu Binarization with K-Means clustering was proposed, and for feature extraction and dimensionality reduction, Discrete Wavelet Transform (DWT) and Principal Component Analysis were employed, respectively. The reduced features were then classified using a SVM. Sensitivity, specificity, and accuracy measures were used to compare the outcomes of each processed image to the ground truth in order to assess the system’s performance, but due to an unsupervised mechanism, it was not too impactful in such a task. In,28 various noise removal techniques were implemented as a pre-processing step for brain tumor segmentation. Their method made use of DWT-based features and the Gray-Level Co-occurrence Matrix (GLCM), and it also included morphological filtering to get rid of the noise that was created during segmentation. The model for identifying tumor locations in MRI brain images was trained and evaluated using a probabilistic neural network classifier. It achieved almost 100% accuracy in differentiating between normal and malignant tissues in MRI scans. In,29 five different CNN architectures for brain tumor classification were proposed. According to their findings, architecture 2, which consists of an output layer, a fully connected layer, and two max-pooling and convolutional layers, outperformed the other four, with 98.51% training and 84.19% validation accuracy. In,30 a CNN-based complex network was introduced, which modified activation functions for classifying MRI brain tumors.
CNNs are highly effective in handling visual images, but they require large datasets to avoid overfitting and generalize well to unseen instances. To address these limitations,31 proposed Capsule Networks (CapsNets), which are more robust to image rotations and affine transformations and require less data compared to CNNs, under explored the multi-class classification of brain tumor types using CapsNets32, conducting experiments on both MRI images and segmented tumor masks. Their model produced sixty-four feature maps with a single convolutional layer, yielding an 86.56% test accuracy. In,33 a novel approach involved augmenting the locality of the tumor region to enhance the task’s performance in terms of classification. Their approach consisted of three separate feature extraction processes: a gray-level co-occurrence matrix, a bag of words, and an intensity histogram that makes its approach complex. This comprehensive approach resulted an accuracy of 91.28%. In,34 multiple CNN models are performed using transfer learning, such as VGG 19, to recognize brain tumors with an accuracy of 81%. In,35 a generalized deep learning (GDL) technique was presented for MRI-based brain tumor classification with an average five-fold cross-validation and got an accuracy of 91.43%, but it has limitations in handling complex spatial relationships. In,36 an unsupervised generative adversarial network (GAN) was implemented for brain tumor classification task and tested the network performance through multiple evaluation metrics such as accuracy, precision, recall, and F1 score of 91.70%, 91.17%, 90.16%, and 90.66% respectively.
Despite the exploration of diverse techniques and algorithms for brain tumor classification, existing approaches often face limitations. Traditional ML classifiers rely on manually crafted features, a process that can be time-consuming, computationally expensive, and can compromise the efficiency of the system. Conversely, convolutional neural networks have gained traction because they have the ability to directly recognize the features from unprocessed metadata. However, CNNs can be computationally demanding, require fixed input image sizes, and necessitate careful selection of hyper-parameters to optimize performance. Additionally, many prior works involve extensive pre-processing steps, which can introduce complexities. This research addresses these limitations by employing minimal pre-processing and a meticulously chosen deep-learning model with optimized hyperparameters and contributed significantly, which are discussed below.
The following are our study’s significant contributions:
This paper proposes an optimized, low-computation deep learning model based on the MobileNetv2 architecture for the classification of brain tumors into three categories: Glioma, Meningioma, and Pituitary.
We utilized an open-accessed brain tumor MRI image dataset, applying minimal preprocessing during the training and testing stage.
We analyzed the comparative performance metrics achieved by our proposed model with SOTAM such as “ResNet50, VGG16, NASNetMobile, InceptionResNetV2, and InceptionV3”.
We analyzed the model performance on equally and unequally distributed classes (glioma, meningioma, and pituitary).
In comparison to latest literature methods, our proposed approach exhibits outstanding performance across several key metrics, including precision, recall, F1 score, and accuracy, on both the training and testing sets. Additionally, the confusion matrix and ROC curve for the testing set further highlight its effectiveness.
Materials and methods
This section provides a detailed description of the technique, under which it deals with data collection and pre-processing, dataset selection, and the proposed work.
Data collection and pre-processing
The data utilized in this methodology is T1W-CE MRI that has been obtained from an open-access Figshare repository,37 which was uploaded by Cheng, Jun. These dataset images were acquired from 233 patients from a clinical study in China; T1W-CE MRI consists of 3,064 images of brain tumors overall and is divided into three categories: glioma (1426), meningioma (708), and pituitary (930). These images are distributed across three anatomical planes: sagittal (1025), axial (994), and coronal (1045), all with a resolution of 512×512 pixels. The specimen images for each case of T1W-CE MRI are shown in Fig.2.
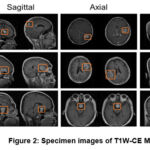 |
Figure 2: Specimen images of T1W-CE MRI |
Pre-processing is a critical image enhancement technique used to improve image quality by eliminating distortions and refining specific properties that are valuable for further analysis. In this study, essential pre-processing steps are applied to MRI images to ensure accurate input to the system, thus creating an optimized environment for image analysis. Initially, the raw images from the dataset are cropped to remove irrelevant regions, to reducing unnecessary complexity in the model. To enhance feature extraction and improve image clarity, a non-linear, edge-preserving bilateral filter is applied, which accounts for both spatial distance and pixel intensity differences when averaging neighboring pixels. Additionally, histogram equalization38 is employed to detect anomalies such as tumors and tissue boundaries, enhancing contrast and visibility by remapping pixel intensities, resulting in a more contrasted image. Finally, the images are resized to ensure better compatibility with the proposed model. The complete pre-processing workflow is illustrated in Fig. 3.
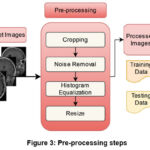 |
Figure 3: Pre-processing steps |
Dataset Selection
To achieve fast computation and high model performance while utilizing optimal computational resources, the selection and preparation of the dataset are crucial. In this study, T1W-CE MRI images were resized to a resolution of 128 x 128. The model performance has been evaluated under both unequal and equal distributions of the three image categories. The data under-sampling technique has been applied to ensure equal distribution across categories.39 Following pre-processing, the dataset has been divided into training, testing, and validation subsets, with 70% distributed for training and the remaining for testing (30%), as described in Table 1. Additionally, data augmentation was employed on the training images to generate additional samples, thereby reducing overfitting and enhancing model performance.
Table 1: Description of dataset and augmentation details
| Class | Original count | Split (Train:Test) | Training set | Validation
set |
Test set | |||
| Glioma | 1426 | 70:30 | 990 | 2280 | 2232 | Validation split = 0.1 | 436 | 206 |
| Meningioma | 708 | 502 | 2264 | 2232 | 206 | 206 | ||
| Pituitary | 930 | 652 | 2232 | 2232 | 278 | 206 | ||
| Total | 3064 | 2144x | 6776y | 6696z | 920x | 618z | ||
x: original image count (without augmentation), y: image count after augmentation (unequally distributed classes), z: image count after equally distributed classes.
Augmentation: A1 = 90o random rotation, A2 = Vertical flip, A3 = Horizontal flip, A4, Factor = 2,4,3 respectively for glioma, meningioma and pituitary.
K-fold cross validation
It is a widely used technique in ML and deep learning DL for tasks such as image classification. It is employed to evaluate model performance and mitigate issues like overfitting. This approach divides the dataset into K subsets, commonly known as folds, ensuring that each subset is of approximately equal size.40 The model is trained iteratively K times, using K-1 folds for training and reserving one fold for validation in each iteration. This process enables a comprehensive assessment of the model’s performance across different portions of the dataset. To validate the data split (70:30) discussed earlier, we set the value of K to 3. For this 3-fold cross-validation, the dataset was divided into three folds, each comprising approximately 33.33% of the data. During training, two folds (approximately 66.66% of the data) were used for model training, while the remaining fold (approximately 33.33% of the data) was designated for validation.
Proposed work
In this study, we present an optimized low-computation model built upon the foundational architecture of MobileNetv213 via fine-tuning that excludes the ImageNet classifier layer at the top and adds proposed dense layers. This model is customized for brain tumors classification tasks, leveraging its prior training on ImageNet datasets. The output from the second-to-last dense layer is retrieved once the base model is acquired, and then a flattened layer is used; subsequently, several new dense layers are introduced, incorporating ReLU activation and dropout layers. The complete proposed network architecture, illustrated in Fig. 4, comprises three layers: an initial fully connected (FC) layer with 256 neurons, followed by another FC layer with 128 neurons, and lastly, there is a layer for multi-classifier that uses a softmax function. The dropout rates for the first and second added layers are fixed at 0.5 and 0.2, respectively. The model processes input from the base architecture of MobileNetv2 and produces outputs for classification into glioma, meningioma, and pituitary categories built with a learning rate of 0.001 using the Nadam optimizer that extracts better features in less time. Our proposed model architectures encompass multiple parameters and hyper-parameters to enhance its efficiency, such as the number of epochs, early stopping conditions, tracking the accuracy of training and validation, and their corresponding losses, with the consideration of categorical cross-entropy loss function41.
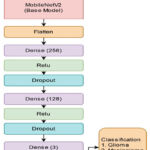 |
Figure 4: Proposed model network architecture |
Experimental setup and evaluation measures
The experiment has been carried out on an Intel Core i9 processor with an integrated GPU and utilized a Python environment with Tensorflow, Keras, OpenCV, and Scikit learn libraries. Using the Nadam as an optimizer, the model has been trained with batch sizes of 32 and a 0.001 learning rate. Several assessment metrics,42 including accuracy, precision, recall, F1 score, confusion matrix, Receiver Operating Characteristic (ROC) curve, True Negative Rate (TNR), False Negative Rate (FNR), False Positive Rate (FPR), Negative Predictive Value (NPV), False Discovery Rate (FDR), and False Omission Rate (FOR) have been utilized to assess model performance for the classification tasks in the training and testing sets.
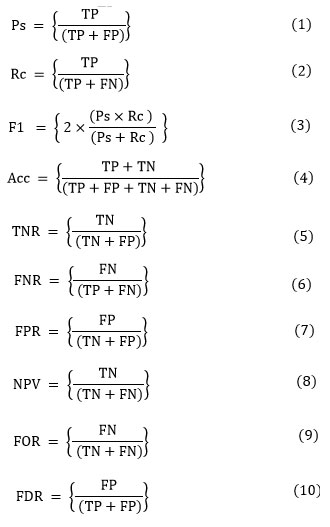
A confusion matrix (error matrix), is a counter that compares true labels with predicted classes, and provides a thorough assessment of a model’s functionality and adaptability to various classes (refer Fig. 5). Precision (Ps), defined in Eq. (1), finds the percentage of positively correlated cases that are accurately predicted. Recall (Rc), defined in Eq. (2), quantifies the percentage of actual positives that are correctly identified. F1 score (F1), defined in Eq. (3), evaluates the balance between precision and recall for the positive class. Accuracy (Acc), defined in Eq. (4), is employed to evaluate the proposed model overall efficacy. True Negative Rate (TNR), defined in Eq. (5), measures the proportion of actual negatives that are correctly classified. False Negative Rate (FNR), defined in Eq. (6), evaluates the percentage of actual positives that are misclassified as negatives. False Positive Rate (FPR), defined in Eq. (7), represents the fraction of actual negatives incorrectly classified as positives. Negative Predictive Value (NPV), defined in Eq. (8), determines the likelihood that a predicted negative case is truly negative. False Omission Rate (FOR), defined in Eq. (9), estimates the proportion of predicted negative cases that are actually positive. Finally, False Discovery Rate (FDR), defined in Eq. (10), calculates the proportion of predicted positive cases that are falsely identified.
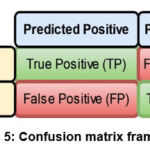 |
Figure 5: Confusion matrix framework |
Results and Discussion
Here, we assess our model efficacy to classify glioma, meningioma, and pituitary of the brain tumor images using an optimized, low-computational, fine-tuned DL model in conjunction with dense layers along the ReLU activation function. In our experiment, we trained our model for 35 epochs with a batch size of 32 on MRI images with an input image of 128×128. The dataset is separated into sets of training, validation, and testing. During the training of the model, 70% of the overall data images are used for training the model, with a split of 0.1 from training data for validation, and 30% of data images are used to test the proposed model effectiveness.
To check the proposed model performance, we utilized the datasets in two parts that are unequal distribution and equal distribution of image classes (glioma, meningioma, pituitary), to avoid any kind of biasedness. Fig. 6(a, b) shows the model performance in terms of loss and accuracy over the training and validation sets, and Fig. 6(c,d) shows the model performance in terms of the confusion matrix and ROC of a test set in an unequally distributed classes dataset. The model achieved a training accuracy of 99.90%, 100%, 100% with F1 scores of 99.95%, 99.90%, and 100% for glioma, meningioma, and pituitary categories, respectively. Similarly, the test set accuracy have 92.89%, 89.32%, and 97.84%, with F1 scores of 94.30%, 86.38%, and 98.02% for glioma, meningioma, and pituitary categories, respectively, for unequally distributed classes of the dataset, as shown in Table 2.
Fig. 7(a, b) shows the model performance in terms of loss and accuracy over the training and validation sets, and Fig. 7(c,d) shows the model performance in terms of the confusion matrix and ROC of a test set in an equally distributed classes dataset. The model achieved a training accuracy of 99.80%, 99.20%, and 100%, with F1 scores of 99.60%, 99.50%, and 99.90% for glioma, meningioma, and pituitary categories, respectively. Similarly, the test set accuracy have 91.26%, 87.86%, and 97.57%, with F1 scores of 91.48%, 88.29%, and 96.87% for glioma, meningioma, and pituitary categories, respectively, for equally distributed classes of the dataset, as shown in Table 3.
Similarly, as above, Table 5 represents the cross-validation performance of our overall model under K-fold (K=3) to validate the generalizability of model in terms of accuracy, precision, recall, and F1-score in both the distribution of datasets.
Figs. 8,9, which compares the performance of our model with SOTAM as shown in Table 4 in both the distribution of datasets, demonstrating that our technique exhibits superior efficiency. Similarly with comparison with latest existing methods as shown in Table 6 and Fig. 10, our model outperforms, specially the model36 with significant margins of 1.89% (93.59% vs. 91.70%) in accuracy, 2.6% (93.77% vs. 91.17%) in precision, 3.43% (93.59% vs. 90.16%) in recall, and 2.99% (93.65% vs. 90.66%) in F1 score.
Table 2: Performance analysis of the proposed model on the unequally distributed classes ( in %)
| Perf. | Class | Acc | Ps | Rc | F1 | TNR | FNR | FPR | NPV | FDR | FOR |
| Training Set | 1 | 99.90 | 100.0 | 99.90 | 99.95 | 100.0 | 00.10 | 00.00 | 99.91 | 00.00 | 00.09 |
| 2 | 100.0 | 99.80 | 100.0 | 99.90 | 99.94 | 00.00 | 00.06 | 100.0 | 00.20 | 00.00 | |
| 3 | 100.0 | 100.0 | 100.0 | 100.0 | 100.0 | 00.00 | 00.00 | 100.0 | 00.00 | 00.00 | |
| Testing Set | 1 | 92.89 | 95.74 | 92.89 | 94.30 | 96.28 | 07.11 | 03.72 | 93.76 | 04.26 | 06.24 |
| 2 | 89.32 | 83.64 | 89.32 | 86.38 | 94.96 | 10.68 | 05.04 | 96.86 | 16.36 | 03.14 | |
| 3 | 97.84 | 98.19 | 97.84 | 98.02 | 99.22 | 02.16 | 00.78 | 99.07 | 01.81 | 00.93 |
Perf.: Performance, 1: Glioma, 2: Meningioma, 3: Pituitary, Acc: Accuracy, Ps: Precision, Rc: Recall, F1: F1 score.
Table 3: Performance analysis of the proposed model on the equally distributed classes ( in %)
| Perf. | Class | Acc | Ps | Rc | F1 | TNR | FNR | FPR | NPV | FDR | FOR |
| Training Set | 1 | 99.80 | 99.40 | 99.80 | 99.60 | 99.70 | 00.20 | 00.30 | 99.90 | 00.60 | 00.10 |
| 2 | 99.20 | 99.80 | 99.20 | 99.50 | 99.90 | 00.80 | 00.10 | 99.60 | 00.20 | 00.40 | |
| 3 | 100.0 | 99.80 | 100.0 | 99.90 | 99.90 | 00.00 | 00.10 | 100.0 | 00.20 | 00.00 | |
| Testing Set | 1 | 91.26 | 91.71 | 91.26 | 91.48 | 95.87 | 08.74 | 04.13 | 95.64 | 08.29 | 04.36 |
| 2 | 87.86 | 88.73 | 87.86 | 88.29 | 94.42 | 12.14 | 05.58 | 93.96 | 11.27 | 06.04 | |
| 3 | 97.57 | 96.17 | 97.57 | 96.87 | 98.06 | 02.43 | 01.94 | 98.78 | 03.83 | 01.22 |
Table 4: Performance comparison of the proposed model with the SOTAM ( in %).
| Class distributed | Model | Acc | Ps | Rc | F1 | TNR |
| Unequally | ResNet50 | 76.30 | 79.57 | 76.30 | 69.21 | 88.15 |
| VGG16 | 90.98 | 90.86 | 90.98 | 90.66 | 95.49 | |
| NASNetMobile | 86.41 | 86.06 | 86.41 | 86.15 | 93.21 | |
| InceptionResNetV2 | 88.91 | 87.69 | 87.25 | 87.13 | 94.46 | |
| InceptionV3 | 85.54 | 85.22 | 85.54 | 85.31 | 92.77 | |
| Proposed | 93.59 | 93.77 | 93.59 | 93.65 | 96.79 | |
| Equally | ResNet50 | 69.26 | 74.42 | 69.26 | 64.58 | 84.63 |
| VGG16 | 88.51 | 88.50 | 88.51 | 88.38 | 94.26 | |
| NASNetMobile | 85.28 | 85.29 | 85.28 | 85.01 | 92.64 | |
| InceptionResNetV2 | 88.51 | 88.89 | 88.51 | 88.54 | 94.26 | |
| InceptionV3 | 78.48 | 79.59 | 78.48 | 77.1 | 94.30 | |
| Proposed | 92.23 | 92.20 | 92.23 | 92.21 | 96.12 |
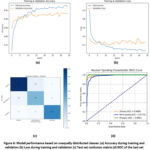 |
Figure 6: Model performance based on unequally distributed classes: (a) Accuracy during training and validation (b) Loss during training and validation. |
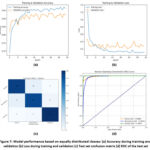 |
Figure 7: Model performance based on equally distributed classes: (a) Accuracy during training and validation (b) Loss during training and validation. |
Table 5: Performance metrics of K-fold (K = 3) validation ( in %).
| Class distributed | K-fold | Acc | Ps | Rc | F1 |
| Unequally | Fold 1 | 92.95 | 92.86 | 92.95 | 92.76 |
| Fold 2 | 93.05 | 93.00 | 93.05 | 93.02 | |
| Fold 3 | 93.93 | 93.92 | 93.93 | 93.92 | |
| Mean | 93.31 | 93.26 | 93.31 | 93.23 | |
| Equally | Fold 1 | 93.13 | 93.12 | 93.13 | 93.08 |
| Fold 2 | 92.20 | 92.24 | 92.20 | 92.20 | |
| Fold 3 | 93.06 | 93.07 | 93.06 | 93.06 | |
| Mean | 92.80 | 92.81 | 92.80 | 92.78 |
Table 6: Comparison of the proposed model with existing methods from recent literature
| Method | Datasets | Acc (%) | Ps (%) | Rc (%) | F1 (%) |
| VGG1934 | MR Images | 81.00 | 82.75 | 80.25 | 80.50 |
| CapsNet 32 | MR Images | 86.56 | – | – | – |
| GDL35 | MR Images | 91.43 | – | – | – |
| GAN36 | MR Images | 91.70 | 91.17 | 90.16 | 90.66 |
| Proposed | Equally distributed | 92.23 | 92.20 | 92.23 | 92.21 |
| Unequally distributed | 93.59 | 93.77 | 93.59 | 93.65 |
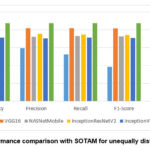 |
Figure 8: Performance comparison with SOTAM for unequally distributed classes |
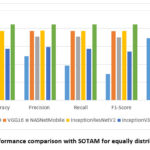 |
Figure 9: Performance comparison with SOTAM for equally distributed classes |
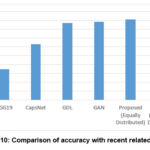 |
Figure 10: Comparison of accuracy with recent related works. |
Limitations of the proposed approach
The proposed model has several limitations that should be considered. Its performance and generalizability largely depend on the quality, diversity, and representativeness of the training and evaluation datasets. Factors such as limited dataset size or a lack of diversity in tumor types, patient demographics, or imaging modality could adversely affect its effectiveness. Additionally, the model requires validation on external datasets to ensure its reliability across different populations, imaging devices, and clinical settings. The interpretability of Mobilenetv2 also presents challenges, as their decision-making processes can be difficult to understand. For instance, the proposed model necessitates exactly three input channels, and minimum dimensions of 32×32 images should be considered; if not met, it could lead to biases or errors. Furthermore, clinical validation through medical professionals and rigorous trials is essential to evaluate the model’s impact on patient outcomes, treatment strategies, and healthcare workflows.
Conclusion and future work
In this research, an effective, optimized technique that requires minimal pre-processing and computational power for classifying brain tumor using the MR dataset has been introduced. The proposed method uses fine-tuned, MobileNetv2 architecture to accurately classify brain tumors into its different categories. While compared to relevant work on comparable datasets, our model showed the highest classification accuracy, achieving 92.23% and 93.59% in equally and unequally distributed categories, respectively. Various metrics have been utilized to estimate the robustness and performance of the system. Compared to existing methods, our low computational robust automated classification technique significantly reduces the effort and time needed to classify brain tumors, which can help radiologists. Furthermore, investigating the effects of various activation functions, regularization factors, and kernel initializers on model performance in the future may help determine the ideal hyperparameters for brain tumor classification. The model’s clinical applicability and generalizability may be assessed by applying it to different datasets and real-world scenarios to enhance model performance.
Acknowledgement
We would like to thank Professor Satish Chand, School of Computer and Systems Sciences, Jawaharlal Nehru University for his valuable insights and contributions to the discussions during this work.
Funding Sources
SKS and RKBS are financially supported by Indian Council of Medical Research (ICMR), DHR under R.11013/30/2021-GIA/HR.
Conflict of Interest
The author(s) do not have any conflict of interest.
Data Availability
This statement does not apply to this article.
Ethics Statement
This research did not involve human participants, animal subjects, or any material that requires ethical approval.
Informed Consent Statement
This study did not involve human participants, and therefore, informed consent was not required.
Clinical Trial Registration
This research does not involve any clinical trials.
Author Contributions
Muniraj Gupta: Conceptualization, methodology, outcomes analysis, data curation, figure preparation, writing–original draft of the manuscript.
Sheetal Bhatia: Data collection, analysis.
Nidhi Verma: Investigation, data analysis, manuscript review.
Naveen Sharma: Investigation, data analysis, manuscript review.
R.K. Brojen Singh: Methodology, data analysis, outcomes analysis, writing–review and editing of manuscript.
Saurabh Kumar Sharma: Writing–review and editing of manuscript, outcomes analysis, investigation, supervision.
References
- Siegel RL, Miller KD, Fuchs HE, Jemal A. Cancer Statistics, 2022. CA: a cancer journal for clinicians. 2022;72(1):07-33.
CrossRef - Bray F, Laversanne M, Sung H, Ferlay J, Siegel RL, Soerjomataram I, Jemal A. Global cancer statistics 2022: GLOBOCAN estimates of incidence and mortality worldwide for 36 cancers in 185 countries. CA: a cancer journal for clinicians. 2024;74(3):229-263.
CrossRef - The Global Cancer Observatory. International Agency for Research on Cancer. https://gco.iarc.who.int. Accessed December 16, 2024.
- Ricard D, Idbaih A, Ducray F, Lahutte M, Hoang-Xuan K, Delattre JY. Primary brain tumours in adults. The Lancet. 2012;379(9830):1984-1996.
CrossRef - Louis DN, Perry A, Reifenberger G, Von Deimling A, Figarella-Branger D, Cavenee WK, Ohgaki H, Wiestler OD, Kleihues P, Ellison DW. The 2016 World Health Organization classification of tumors of the central nervous system: a summary. Acta neuropathologica. 2016;131:803-820.
CrossRef - Types of brain tumors. American Association of Neurological Surgeons. https://www.aans.org/patients/ conditions-treatments/brain-tumors. April 16, 2024. Accessed May 28, 2024.
- Gritsch S, Batchelor TT, Gonzalez Castro LN. Diagnostic, therapeutic, and prognostic implications of the 2021 World Health Organization classification of tumors of the central nervous system. Cancer. 2022;128(1):47-58.
CrossRef - Wang S, Feng Y, Chen L, Yu J, Van Ongeval C, Bormans G, Li Y, Ni Y. Towards updated understanding of brain metastasis. American Journal of Cancer Research. 2022;12(9):4290.
- Hamed G, Marey M, Amin S, Tolba M. Comparative study and analysis of recent computer aided diagnosis systems for masses detection in mammograms. International Journal of Intelligent Computing and Information Sciences. 2021;21(1):33-48.
CrossRef - Özcan H, Emiroğlu BG, Sabuncuoğlu H, Özdoğan S, Soyer A, Saygı T. A comparative study for glioma classification using deep convolutional neural networks. Molecular Biology and Evolution. 2021.
CrossRef - Lundervold AS, Lundervold A. An overview of deep learning in medical imaging focusing on MRI. Zeitschrift für Medizinische Physik. 2019;29(2):102-27.
CrossRef - Niu S, Liu Y, Wang J, Song H. A decade survey of transfer learning (2010–2020). IEEE Transactions on Artificial Intelligence. 2020;1(2):151-66.
CrossRef - Akay M, Du Y, Sershen CL, Wu M, Chen TY, Assassi S, Mohan C, Akay YM. Deep learning classification of systemic sclerosis skin using the MobileNetV2 model. IEEE Open Journal of Engineering in Medicine and Biology. 2021;2:104-110.
CrossRef - He K, Zhang X, Ren S, Sun J. Deep residual learning for image recognition. InProceedings of the IEEE conference on computer vision and pattern recognition. 2016:770-778.
CrossRef - Simonyan K. Very deep convolutional networks for large-scale image recognition. arXiv preprint arXiv. 2014:1409.1556.
- Zoph B, Vasudevan V, Shlens J, Le QV. Learning transferable architectures for scalable image recognition. InProceedings of the IEEE conference on computer vision and pattern recognition. 2018:8697-8710.
CrossRef - Szegedy C, Vanhoucke V, Ioffe S, Shlens J, Wojna Z. Rethinking the inception architecture for computer vision. InProceedings of the IEEE conference on computer vision and pattern recognition. 2016:2818-2826.
CrossRef - Szegedy C, Ioffe S, Vanhoucke V, Alemi A. Inception-v3, inception-resnet and the impact of residual connections on learning. InProceedings of the AAAI conference on artificial intelligence. 2017;31(1).
CrossRef - Solanki S, Singh UP, Chouhan SS, Jain S. Brain tumor detection and classification using intelligence techniques: an overview. IEEE Access. 2023;11:12870-86.
CrossRef - Garg P, Mohanty A, Ramisetty S, Kulkarni P, Horne D, Pisick E, Salgia R, Singhal SS. Artificial intelligence and allied subsets in early detection and preclusion of gynecological cancers. Biochimica et Biophysica Acta (BBA)-Reviews on Cancer. 2023:189026.
CrossRef - Ahmad I, Ullah I, Khan WU, Ur Rehman A, Adrees MS, Saleem MQ, Cheikhrouhou O, Hamam H, Shafiq M. Efficient Algorithms for E‐Healthcare to Solve Multiobject Fuse Detection Problem. Journal of Healthcare Engineering. 2021;2021(1):9500304.
CrossRef - Bansal M, Goyal A, Choudhary A. A comparative analysis of K-nearest neighbor, genetic, support vector machine, decision tree, and long short term memory algorithms in machine learning. Decision Analytics Journal. 2022;3:100071.
CrossRef - Binaghi E, Omodei M, Pedoia V, Balbi S, Lattanzi D, Monti E. Automatic segmentation of MR brain tumor images using support vector machine in combination with graph cut. Scitepress. 2014:152-157.
CrossRef - Ait Amou M, Xia K, Kamhi S, Mouhafid M. A novel MRI diagnosis method for brain tumor classification based on CNN and Bayesian Optimization. InHealthcare MDPI. 2022;10(3):494.
CrossRef - Biswas A, Islam MS. A Hybrid Deep CNN-SVM Approach for Brain Tumor Classification. Journal of Information Systems Engineering & Business Intelligence. 2023;9(1).
CrossRef - Poonguzhali R, Ahmad S, Sivasankar PT, Babu SA, Joshi P, Joshi GP, Kim SW. Automated brain tumor diagnosis using deep residual u-net segmentation model. Computers, Materials & Continua. 2023;74(1):2179-94.
CrossRef - Shil SK, Polly FP, Hossain MA, Ifthekhar MS, Uddin MN, Jang YM. An improved brain tumor detection and classification mechanism. IEEE International Conference on Information and Communication Technology Convergence. 2017:54-57.
CrossRef - Varuna Shree N, Kumar TN. Identification and classification of brain tumor MRI images with feature extraction using DWT and probabilistic neural network. Brain informatics. 2018;5(1):23-30.
CrossRef - Abiwinanda N, Hanif M, Hesaputra ST, Handayani A, Mengko TR. Brain tumor classification using convolutional neural network. In World Congress on Medical Physics and Biomedical Engineering Prague, Czech Republic Springer. 2019;1:183-189.
CrossRef - Huang Z, Du X, Chen L, Li Y, Liu M, Chou Y, Jin L. Convolutional neural network based on complex networks for brain tumor image classification with a modified activation function. IEEE Access. 2020;8:89281-89290.
CrossRef - Sabour S, Frosst N, Hinton GE. Dynamic routing between capsules. Advances in neural information processing systems. 2017;30.
- Afshar P, Mohammadi A, Plataniotis KN. Brain tumor type classification via capsule networks. In 25th IEEE international conference on image processing (ICIP). 2018:3129-3133.
CrossRef - Cheng J, Huang W, Cao S, Yang R, Yang W, Yun Z, Wang Z, Feng Q. Enhanced performance of brain tumor classification via tumor region augmentation and partition. PloS one. 2015;10(10):e0140381.
CrossRef - Rajput IS, Gupta A, Jain V, Tyagi S. A transfer learning-based brain tumor classification using magnetic resonance images. Multimedia Tools and Applications. 2024;83(7):20487-20506.
CrossRef - Paul JS, Plassard AJ, Landman BA, Fabbri D. Deep learning for brain tumor classification. In Medical Imaging 2017: Biomedical Applications in Molecular, Structural, and Functional Imaging. 2017;10137:253-268.
CrossRef - Ghassemi N, Shoeibi A, Rouhani M. Deep neural network with generative adversarial networks pre-training for brain tumor classification based on MR images. Biomedical Signal Processing and Control. 2020;57:101678.
CrossRef - Cheng, Jun (2017). brain tumor dataset. figshare. https://figshare.com/articles/dataset/ brain_tumor_ dataset/ 1512427/5. April, 2017. Accessed May 28, 2024.
- Panambur AB, Madhu P, Maier A. Effect of random histogram equalization on breast calcification analysis using deep learning. InBildverarbeitung für die Medizin 2022: Proceedings, German Workshop on Medical Image Computing, Heidelberg, June 26-28, 2022. 2022:173-178.
CrossRef - Selvaraj J, Jayanthy AK. Design and development of artificial intelligence‐based application programming interface for early detection and diagnosis of colorectal cancer from wireless capsule endoscopy images. International Journal of Imaging Systems and Technology. 2024;34(2):e23034.
CrossRef - Selvaraj J, Umapathy S, Rajesh NA. Artificial intelligence based real time colorectal cancer screening study: Polyp segmentation and classification using multi-house database. Biomedical Signal Processing and Control. 2025;99:106928.
CrossRef - Goodfellow, I., Bengio, Y., & Courville, A. Deep Learning. MIT Press. 2016.
- Selvaraj J, Jayanthy AK. Automatic polyp semantic segmentation using wireless capsule endoscopy images with various convolutional neural network and optimization techniques: A comparison and performance evaluation. Biomedical Engineering: Applications, Basis and Communications. 2023;35(06):2350026.
CrossRef

