
Manuscript accepted on :13-01-2025
Published online on: 10-02-2025
Plagiarism Check: Yes
Reviewed by: Dr. Anjaneyulu Konuri
Second Review by: Dr. Ilya Nikolayevich Medvedev
Final Approval by: Dr. Prabhishek Singh
Suman Rani1,2* , Minakshi Memoria3, Kapil Joshi4and Anil Kumar Lamba5
1Department of Computer Science, Uttaranchal University, Dehradun, Uttarakhand, India.
2Department of Information Technology, IIMT College of Engineering, Greater Noida, India.
3Department of Computer Science, King Khalid University, Saudi Arabia
4 Department of Computer Science, Uttaranchal University, Dehradun, Uttarakhand, India.
5 Department of Computer Science, MMEC, Maharishi Markandeshwar (Deemed to be University), Mullana, Ambala, Haryana, India.
Corresponding Author E-mail: sumanaggrawal@gmail.com
DOI : https://dx.doi.org/10.13005/bpj/3083
Abstract
Knee arthritis is the most frequent ailment among the senior population. This illness affects a large number of people worldwide. The biggest issue is with the joints. The higher joints are the femur, the lower joints are the tibia, and the patella is the kneecap. There is cartilage loss, which causes a difficulty with mobility. To diagnose this condition manually, knee scans are analysed and divided into five groups using the Kellgren-Lawrence (KL) approach. This process requires extensive healthcare expertise, significant experience, and considerable time, yet it remains susceptible to errors. Consequently, the era of artificial intelligence has arrived. AI is making a profound impact on the healthcare sector.This work classified the KOA using the publicly accessible OAI (Osteoarthritis Initiative) dataset. This work primarily uses deep learning, a specialisation of AI, for the categorisation and severity detection of the Knee Osteoarthritis. This study primarily uses the VGG-16 DNN model for binary classification as well as multiclassification. Using this model results in optimised efficiency and higher accuracy than previous models. In the future, we will work with genuine data collected from numerous hospitals.
Keywords
CNN; Deep Neural Networks; KOA; VGG-16; X-Ray; OAI
Download this article as:| Copy the following to cite this article: Rani S, Memoria M, Joshi K, Lamba A. K. Automated Knee Osteoarthritis Classification from X-ray Images Using the VGG-16 Model. Biomed Pharmacol J 2025;18(March Spl Edition). |
| Copy the following to cite this URL: Rani S, Memoria M, Joshi K, Lamba A. K. Automated Knee Osteoarthritis Classification from X-ray Images Using the VGG-16 Model. Biomed Pharmacol J 2025;18(March Spl Edition). Available from: https://bit.ly/4hQerSz |
Introduction
The cartilage that lies between the knee joints deteriorates with time, leading to knee osteoarthritis (KOA), A health issue that mainly impacts older individuals. 1In the United States, it is the most prevalent joint condition, affecting 10% of male and 13% of female over 60. Knee osteoarthritis (KOA) is caused by cartilage loss in the knees and can cause years of disability. 2An arthroplasty is the final choice for healing from this condition, but it is prohibitively costly and not accessible to all. The purpose of this study is to automatically detect early stages arthritis in the knee. Using the wealth of available data, this study attempts to examine hitherto unknown aspects of healthcare decision-making and precise diagnosis in the field of KOA. 3 The Kellgren and Lawrence (KL) grading scheme is a widely used method in knee osteoarthritis (KOA) research. 4It assigns ordinal grades to radiographs according to the degree of osteoarthritis, with Grade 0 showing no evidence of KOA and Grade 4 indicating substantial joint degradation. 5 This semiquantitative technique enables researchers and doctors to assess the severity of knee osteoarthritis (KOA) using particular radiographic signs such as subchondral bone alterations, osteophyte formation, and joint space narrowing.6 Furthermore, X-rays, which are readily available and reasonably cheap, can be used to detect bone spur growth, articular cartilage degeneration, and an increase in the space between bones. The KL scale is a popular radiographic classification approach that was created to measure the amount of osteoarthritis in the KOA knee using X-rays. The severity of osteophyte and joint space narrowing (JSN) symptoms divides KOA into five categories. Figure 1 depicts the knee with and without KOA.
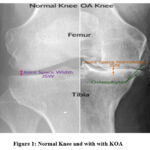 |
Figure 1: Normal Knee and with with KOAClick here to view Figure |
As it demonstrates7, the creation of osteophytes and the loss of cartilage between the joint of the knee and the bony spur are among the many symptoms of KOA. These symptoms are primarily brought on by ageing or any specific illness.8 These symptoms are primarily present in females. The main causes of KOA are shown in fig. 2.
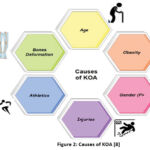 |
Figure 2: Causes of KOA [8]Click here to view Figure |
KL grade system is shown in table 1. There are four categories of KL Grade.
Table 1: KL Grading Levels
| Phase 0: Healthy | No signs of osteoarthritis (OA) are visible. |
| Phase 1: Doubtful | X-rays may not show clear damage, but small bone growths might indicate early OA. Pain or discomfort is generally absent, and the joint appears normal on X-ray. |
| Phase 2: Mild | X-rays may show bone spurs and joint space narrowing. Mild joint stiffness and pain might begin. Bone and tissue junctions become denser, and bones thicken. A thin bone layer grows beneath cartilage, and interstitial fluid helps reduce resistance, improving mobility |
| Phase 3: Moderate | X-rays reveal more joint space narrowing, bone spur growth, and potential bone deformities. Activities like walking or bending may cause soreness. Tissues thin, and bones start developing outgrowths as OA progresses |
| Phase 3: Severe | X-rays show significant joint space reduction, causing bones to grind against each other. Tissue damage is extensive, with cartilage erosion and visible bone deformities. |
we have studied various papers based on healthcare solution using the DL. This study applies the VGG-16 model. The main contribution of the study is
Understanding the symptoms and causes of osteoarthritis in the knee is the primary contribution of this study. This study primarily uses X-ray pictures from the OAI collection.
In this study, the VGG-16 model, a deep learning method, is employed for binary classification to assess whether an individual has the condition or not.
Using the VGG-16 model, we performed multiclassification at the next level.
The paper’s format is as follows: Part 1 presents the introduction, Section 2 consists of a literature review, and Section 3 displays the methodology section. Section 4 presents the experimental results, Section 5 examines and analyses them, and Section 6 concludes.
Review of literature
Several studies have examined sophisticated machine learning and deep neural network models for the diagnosing and classifying knee osteoarthritis (KOA).9According to the Kellgren and Lawrence (KL) scale, one study’s 95.1% accuracy rate in detecting and rating KOA using an ensemble model and InceptionResNetV2, which has the potential to be a trustworthy tool for radiologists. For binary and severe classification, a 12-layer Convolutional Neural Network (CNN) was constructed using Osteoarthritis Initiative (OAI) data.10 It proved highly effective in detecting and grading KOA, achieving an accuracy of 78.4% in multiclassification and 92.3% in binary classification. In another work, many machine learning models—including Random Forest, Support Vector Machine, and Bayesian classifiers—has been contrasted using several imaging modalities. The model showed promise in predicting the pain level by identifying cartilage loss and synovitis/effusion as significant pain-related indicators, despite the fact that there were no appreciable differences in model performance. 11 An extra study created a two-stage Balanced Random Forest model with a balanced accuracy of 65.9% and an F1 score of 79.0%, which classified KOA severity into three stages. This strategy performed better than previous single-stage methods, indicating that it might be used to predict the severity of KOA accurately.12 With a multi-class accuracy of 71.74% and a Mean Absolute Error (MAE) of 0.311, the OsteoHRNet model—which is based on the Excellent quality Network (HRNet) architecture and incorporates a focus mechanism and Gradient-based Class Activation Maps (Grad-CAMs)—proved its efficacy in automatic KOA inspection. For interpretable KOA classification, another study used GradCAM in conjunction with five state-of-the-art deep learning models.13 It achieved 99.13% accuracy in differentiating between normal and severe cases but only 67% for intermediate cases, highlighting the need for further model improvement. Finally, research using transfer learning with the Inception V3 model compared it to other deep learning architectures, reaching 91% training accuracy and 67% testing accuracy. 14 This model showed potential in predicting KOA severity and assessing knee replacement demands, highlighting its utility in assisting radiologists with KOA diagnosis and treatment. 15 Table -2 Provide a detailed description of the literature review.
Table 2: Literature Review of various studies
| Schemens | Alogorithims/Methods | Discovery | Cobnclusion |
| [9] | Ensemble Model (Xception + InceptionResNetV2) | Combined Xception and InceptionResNetV2 architectures for enhanced predictive accuracy,· 95.1% accuracy | · The ensemble model demonstrated strong potential for accurate early-stage knee OA detection· offering a reliable tool for radiologists.· contributing significantly to medical image analysis in osteoarthritis diagnosis. |
| [10] | 12-layer Convolutional Neural Network (CNN) | · Utilized CNN on Osteoarthritis Initiative (OAI) data for binary classification of KOA and severity classification using the Kellgren-Lawrence (KL) grading scale.· Achieved 92.3% accuracy in binary classification and 78.4% in multiclassification.· | · The model demonstrated high accuracy for KOA detection and severity.· Grading suggests the potential for wider application and reduced need for radiologist intervention.· Future work aims to improve performance through diverse datasets. |
| [11] | Random Forests (RF), Support Vector Machines (SVM), Logistic Regression (LR), Decision Tree (DT), Bayesian (Bayes), Convolutional Neural Network (CNN) with Class Activation Mapping (CAM) | · Utilized semi-quantitative knee radiograph assessments, MRI assessments.· Tested various machine learning models, finding no significant performance difference across imaging data.· CAM identified cartilage loss (30.6%) and synovitis/effusion (30.9%) as key factors related to pain severity. | · Machine learning models, particularly CNN with CAM, effectively identify structural factors associated with pain severity in knee osteoarthritis.· Cartilage loss and synovitis/effusion were highlighted as key factors, suggesting machine learning’s potential in pain assessment and severity prediction from radiographic data. |
| [12] | Two-stage Balanced Random Forest model | · Classified future KOA severity into three grades (KL01, KL2, KL34) using two binary classifications.· The model, trained with demographic and quantitative knee morphology data from 8-year longitudinal data of 1213 knees, identified baseline KL grade and weight as key features.· Achieved a weighted F1 score of 79.0%, balanced accuracy of 65.9%, and AUC of 83.0% and 86.6% for the two stages. | · The two-stage classification model significantly outperformed traditional single-stage models in KOA severity classification.· showing potential for future application in clinical settings for more accurate severity prediction and early intervention. |
| [13] | High-Resolution Network (HRNet) with Attention Mechanism, Gradient-based Class Activation Maps (Grad-CAMs) | Developed OsteoHRNet, a deep learning model based on HRNet to classify Knee OA severity according to the Kellgren and Lawrence (KL) grading system from X-ray images.· The model achieved a multi-class accuracy of 71.74% and Mean Absolute Error (MAE) of 0.311 on the OAI dataset, surpassing prior methods. | · OsteoHRNet’s multi-scale feature extraction and attention mechanism enhanced KL grade classification accuracy.· Demonstrating its potential as an effective tool for automated Knee OA severity assessment. Grad-CAMs provided interpretability.· helping to validate the network’s learning process. |
| [14] | Five fine-tuned state-of-the-art (SOTA) DL models with Gradient-weighted Class Activation Mapping (GradCAM) | · Applied divide-and-conquer approach to classify knee OA using both multi-class and binary-class methods.· enhancing interpretability through GradCAM. EfficientNetb7 model achieved 99.13% accuracy for distinguishing normal and severe cases, but only 67% for intermediate cases. | · The study highlights the potential of XAI in knee OA classification. EfficientNetb7 showed high accuracy for extreme cases but struggled with intermediate classifications.· suggesting a need for further model refinement to match clinician accuracy. |
| [15] | Transfer learning with Inception V3, compared with Xception, VGG16, VGG19, ResNet (various versions), DenseNet (various versions) | · Inception V3 achieved the highest performance, with 91% training accuracy and 67% testing accuracy.· effectively identifying OA severity based on the Kellgren–Lawrence scale and predicting knee replacement needs. | · The Inception V3 model demonstrates strong potential for supporting radiologists in knee OA diagnosis.· Treatment planning, facilitating accurate, timely healthcare decisions for OA patients. |
Materials and Methods
The four primary phases of this methodology are data collection, dataset preparation, model training, and classification. First, we obtained the KOA X-ray imaging dataset from the Osteoarthritis Initiative (OAI), which is available on Kaggle.15 This dataset has five different picture classifications labelled as 0 (healthy), 1 (doubtful), 2 (mild), 3 (moderate), and 4 (severe). The dataset’s knee joint X-ray pictures lack the quality and localization required to be directly fed into deep learning models. To improve the images a data preprocessing stage is required, with an emphasis on the joint area where useful KOA information is most likely to be detected. Initially, image segmentation included cropping each image to isolate the desired knee region and efficiently deleting any superfluous elements.
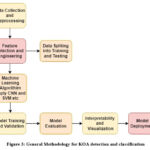 |
Figure 3: General Methodology for KOA detection and classificationClick here to view Figure |
Fig. 3 depicts a methodical approach to designing and implementing a machine learning model in healthcare, specifically for medical imaging activities. The procedure begins with data collection and preprocessing, which involves gathering and cleaning medical pictures. The next step is feature selection and engineering, which identifies critical data features for improved accuracy. The dataset is then divided into training and test sets. 16 In the Machine Learning Algorithm stage, algorithms such as CNN and SVM are employed to extract patterns from data. Training and validation improve the model’s parameters. Model evaluation evaluates accuracy using test data. Once the model has performed successfully, Interpretability .
Dataset Description
The knee X-ray images used to train the model in this work came from the Knee Osteoarthritis Severity Grading dataset, which is accessible on Kaggle and organised by the Osteoarthritis Initiative (OAI). The dataset includes 9,786 knee pictures classified into five severity levels using the Kellgren-Lawrence (KL) grading system: 0 (healthy), 1 (doubtful), 2 (minimum), 3 (moderate), and 4 (severe). Each picture has a resolution of 224 × 224 pixels. The distribution of images across categories is as follows: approximately 40% are categorized as healthy, 18% as dubious, 26% as minimal, 13% as moderate, and just over 3% as severe. Fig. 4 describe the OAI dataset.
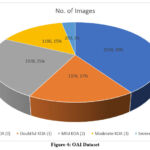 |
Figure 4: OAI DatasetClick here to view Figure |
Dataset images are given in Fig.5. These images are based on the classes of KL grade system.
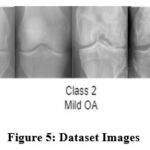 |
Figure 5: Dataset Images.Click here to view Figure |
The distribution is significantly skewed, with the majority of photos in the “No KOA” and “Mild KOA” categories and only a handful in the “Severe KOA” category. This imbalance may have an influence on the model’s performance, particularly in properly recognising severe KOA instances.
Convolution Neural Network Architecture
Artificial intelligence (AI) has advanced rapidly in recent years, with applications in a variety of industries, including computer vision. The primary aim of computer vision is to make it possible for computers to understand visual information much like people do. The goal is to digitally capture, collect, and process pertinent environmental data. Many techniques have been developed to do this, with convolutional neural networks (CNNs) showing the most promise. In the context of image processing, a CNN is a deep learning algorithm that analyses a picture and assigns weights to various attributes to differentiate it from previous images processed by the same method. 17 CNN architecture uses the VGG-16 model. We can say that the VGG-16 model is subpart of CNN as there is a difference in the number of layers. The VGG-16 model is a deep convolutional neural network (CNN) architecture developed by Oxford University’s Visual Geometry Group, and it is well-known for its simplicity and efficacy in image categorisation.18 “VGG-16” refers to the network’s depth, which consists of 16 learnable weight layers (13 convolutional layers and 3 fully connected layers). Architecture of CNN is described in Fig. 6.
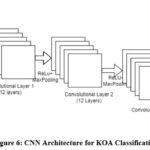 |
Figure 6: CNN Architecture for KOA ClassificationClick here to view Figure |
The convolution operation, which is a critical component of the technique, may be stated as shown in Eq. [1] below :
![]()
Equation 1: CNN’s convolution layer
Where S(i,j) represents the value at location (i,j) in the output feature map, I is the input image, and K is the convolution kernel.
Performance Metrics
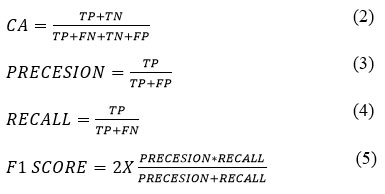
This section briefly describes the performance indicators we utilised to evaluate our classifiers. Before deploying machine learning models, it is critical to assess their efficacy. The F1 score and classification accuracy are two common measures for classifier assessment.
Classification Accuracy is calculated as the number of accurately predicted samples divided by the total number of samples in the dataset. 17 For accuracy to be useful, the dataset should be balanced; otherwise, high accuracy might be deceptive. In imbalanced datasets, models can show high accuracy by focusing on the majority class, yet they tend to underperform on minority classes, which contribute less to the overall accuracy.
The F1 Score, another important statistic, finds a balance between Precision and Recall by computing their harmonic mean. Precision measures the model’s ability to classify a sample as positive only when it actually belongs to the positive class (the ratio of true positives to projected positives). High precision means that favourable forecasts are likely to be accurate. Recall measures the ability of a model to identify all accurate positive samples. High recall indicates the model’s ability to correctly identify samples with positive results. 18
Equations (2)-(5) include the equations for these metrics, with TP (True Positive), TN (True Negative), FP (False Positive), and FN (False Negative) reflecting different types of categorisation outcomes. CA refers to the accuracy of classification in this case.
Results
This section discusses the use of the VGG-16 model to solve binary and multi-class classification problems. The dataset is divided into three subgroups for this study using a 7:2:1 split ratio: 70% for training, 20% for testing, and 10% for validation. This method ensures that the model has sufficient data for training while retaining enough data for hyperparameter tuning and generalization testing.The depth and efficacy of the VGG-16 model, a prominent convolutional neural network architecture, in recognising characteristics in pictures influenced its adoption. In order to meet the computational needs of training a deep network like VGG-16, we placed the model on Google Colab and used its powerful GPUs. In addition, we created, trained, and evaluated the model on Tensor Flow, a widely used deep learning platform. Tensor Flow offers the required characteristics to interact with VGG-16, such as previously trained weights for transfer learning, which can increase performance and speed up training, particularly when there is limited input. The model learns to differentiate between many classes for multi-class classification, although it was taught to discriminate between two distinct groups for binary categorisation. The model’s architecture was modified for each categorisation type by changing the output layer to correspond to the number of categories in each scenario. This implementation strategy guaranteed that VGG-16 was optimised for both binary and multi-class classification tasks, giving it versatility in its application to a variety of image classification issues.
Table 3: Binary Classification Results
| F1 Score | Recall | Precision | Accuracy | Loss |
| 89.8 | 95.6 | 84.6 | 88.8 | 24.9 |
Classification Report:Table 4 represent the classification report of the binary classification.
Table 4: Classification report of Binary classification using VGG-16
| Class | Precision | Recall | F1-Score | Support |
| 0 | 0.95 | 0.81 | 0.88 | 151 |
| 1 | 0.85 | 0.96 | 0.90 | 161 |
| Macro Avg. | 0.90 | 0.89 | 0.89 | 312 |
| Weighted Avg. | 0.89 | 0.89 | 0.89 | 312 |
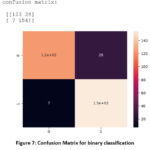 |
Figure 7: Confusion Matrix for binary classificationClick here to view Figure |
Table 5: VGG-16 model config.
| Layer (type) | Output Shape | Param # |
| vgg16 (Functional)flatten (Flatten)dropout (Dropout)dense (Dense)dense_1 (Dense) | (None, 7, 7, 512)(None, 25088)(None, 25088)(None, 64)(None, 3) | 14714688001605696195 |
Total params: 16320579 (62.26 MB)
Training parameters: 1605891 (6.13 MB)
Non-training parameters: 14714688 (56.13 MB)
Multiclassification Results
In multiclassification and severity detection using KL grade system. In this study we used three classes.
0 ,1 and 2 i.e 0 is healthy knee,1 is mild and 2 is severe.
accuracy: 0.7957 that means 79.6 and loss is 0.772 i.e 77.2. It indicated that as the accuracy Increase then the loss decreases.
Confusion matrix is shown in fig.7 for multiclassification.
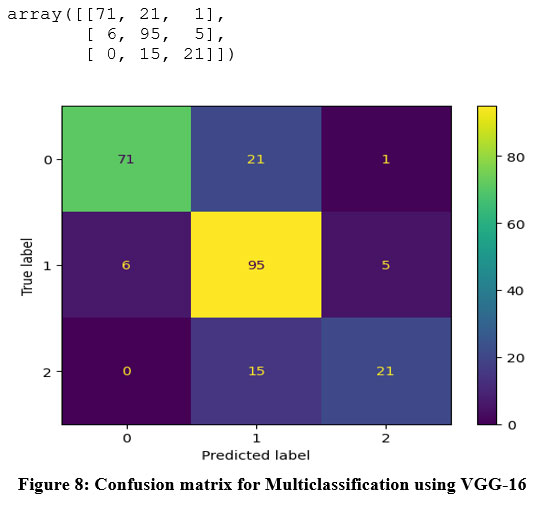 |
Figure 8. Confusion matrix for Multiclassification using VGG-16Click here to view Figure |
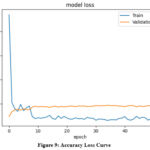 |
Figure 9: Accuracy Loss CurveClick here to view Figure |
The model’s validation and training losses across 50 epochs are shown in the figure.
The orange line indicates the validation loss, while the blue line corresponds to the training loss.
Initially, both losses are significant, with the training loss rapidly decreasing during the first few epochs, showing efficient learning from the training data. Around the tenth epoch, the training loss stabilises and stays low, indicating that the model is successfully learning the patterns in the training data.
On the other hand, the validation loss initially decreases but then levels off, with minor volatility as training progresses. The considerable difference in training and validation loss suggests probable overfitting, since the model performs better on the training data than on the validation set. Despite this, the rather steady validation loss indicates that overfitting is insignificant. Further reducing this gap might assist improve the model’s generalisability.
Table 6: Multi-Classification report
| Class | Precision | Recall | F1-Score | Support |
| 0 | 0.92 | 0.76 | 0.84 | 93 |
| 1 | 0.73 | 0.90 | 0.80 | 106 |
| 2 | 0.85 | 0.96 | 0.90 | 36 |
| Macro Avg. | 0.81 | 0.75 | 0.77 | 235 |
| Weighted Avg. | 0.81 | 0.80 | 0.79 | 235 |
Discussion
The Binary classification using the VGG-16 model F1-score is 89.8%, Recall is 95.7%, Precision is 84.6 % and the accuracy is 89%. The high recall of 95.7% indicates that the model successfully identifies most positive samples, which is valuable when false negatives are costly. However, the precision is slightly lower, at 84.6%, meaning there are some false positives where the model incorrectly classifies negative samples as positive. The F1-score of 89.8% reflects a balanced performance, capturing both precision and recall. The confusion matrix shows that:
Class 0 (negative class) had a recall of 81%, suggesting the model missed some negative cases.
Class 1 (positive class) had a recall of 96%, reflecting strong performance in correctly identifying positive cases.
In case of Multiclassfication the accuracy of 80% is reasonable; nevertheless, performance varies by class. Class 0 has the highest accuracy (92%), indicating that the model can reliably identify instances of Class 0. However, the reduced recall (76%) indicates that some real Class 0 samples were misclassified. Class 1 has a high recall (90%) but a lower accuracy (73%), indicating that the model is more likely to categorise samples as Class 1, which might lead to more false positives. Class 2 has the lowest performance, with a recall of 58%, suggesting that it is the most challenging class for the model to recognise correctly.
The approach works well in both binary and multiclass scenarios, although there is potential for improvement, particularly in managing minority classes in multiclass classification. The model’s efficacy may be enhanced by addressing class imbalance, improving recall for difficult courses, and balancing accuracy and recall levels. By putting these ideas into reality, the model may become more resilient and efficient in real-world applications by enhancing its consistency and reliability in binary and multiclass categories.
Conclusion
The illness known as KOA has propagated throughout the world. AI is being used effectively in the healthcare business. KOA is a joint condition, as is generally understood. Our bodies depend on joints for movement. The VGG-16 algorithm is being used in deep learning to identify and categorise KOA. Both the binary and multiclass classification tests performed well with this model.The model obtained a strong F1-score and a high accuracy of 89% for binary classification, indicating a reasonable trade-off between recall and precision. This reveals that the model is good at discriminating between positive and negative instances of knee osteoarthritis (KOA), which is especially useful in situations where positive cases must be precisely identified. In multiclass classification, the model performed well with Class 0 (No KOA) and Class 1 (Mild KOA), achieving 80% overall precision. Fortunately, Class 2 (Moderate KOA) had a lower recall. This divergence indicates that the model struggles to discriminate between certain KOA stages, most likely because to disparity in class or visually trait overlap. Class 2 is very difficult to recognise accurately due to the small sample size, and accuracy and memory levels vary throughout classes. Despite these challenges, the VGG-16 model’s effectiveness as a diagnostic tool for KOA categorisation in medical imaging is promising, particularly in binary classification tasks where it excels. Future studies will use huge, real-life data sets for validation as well as training to increase the model’s capacity to generalise across different patient demographics and clinical conditions. Furthermore, using interpretability tools such as Grad-CAM or saliency maps would clarify the model’s decision-making process, boosting its credibility and usefulness in healthcare contexts.
Acknowledgement
I want to express my sincere thanks to everyone who helped with our study on the automatic classification of osteoarthritis in the knee using X-ray images. The VGG-16 Model is used. The study team deserves special recognition for their hard work and insightful contributions. Our work relied heavily on the Osteoarthritis Initiative (OAI) dataset, which we are grateful for using. This effort would not have been feasible without the constant direction and assistance of our mentor, Supervisor Dr. Minakshi Memoria, Co-Supervisor Dr. Kapil Josi, and our Uttaranchal University.
Funding Sources
The author(s) received no financial support for the research, authorship, and/or publication of this article.
Conflict of Interest
The author(s) do not have any conflict of interest.
Data Availability Statement
This statement does not apply to this article.
Ethics Statement
This research did not involve human participants, animal subjects, or any material that requires ethical approval.
Informed Consent Statement
This study did not involve human participants, and therefore, informed consent was not required.
Clinical Trial Registration
This research does not involve any clinical trials
Author Contributions
- Ms. Suman Rani drafted the original manuscript.
- Dr. Meenakshi Memoria Supervisior help me in writing,review and editing.
- Dr. Kapil Joshi provide contious support in data collection and methodology implementation.
- Dr. Anil Lamba help me in cleaning and processing of data.
References
- Mohammed AS, Hasanaath AA, Latif G, Bashar A. Knee osteoarthritis detection and severity classification using residual neural networks on preprocessed x-ray images. Diagnostics. 2023;13(8):1380.
CrossRef - Rani S, Memoria M. Deep learning to combat knee osteoarthritis and severity assessment by using CNN-based classification. BMC Musculoskelet Disord. 2024;25(1):817.
CrossRef - Rani S, Memoria M, Choudhury T, Sar A. A comprehensive review of machine learning’s role within KOA. EAI Endorsed Trans Internet Things. 2024;10.
CrossRef - Roy S, Meena T, Lim SJ. Demystifying supervised learning in healthcare 4.0: A new reality of transforming diagnostic medicine. Diagnostics. 2022;12(10):2549.
CrossRef - Mohammed AS, Hasanaath AA, Latif G, Bashar A. Knee osteoarthritis detection and severity classification using residual neural networks on preprocessed x-ray images. Diagnostics. 2023;13(8):1380.
CrossRef - Wahyuningrum RT, Anifah L, Purnama IKE, Purnomo MH. A new approach to classify knee osteoarthritis severity from radiographic images based on CNN-LSTM method. In: 2019 IEEE 10th International Conference on Awareness Science and Technology (iCAST). IEEE; 2019:1-6.
CrossRef - Tri Wahyuningrum R, Yasid A, Jacob Verkerke G. Deep neural networks for automatic classification of knee osteoarthritis severity based on X-ray images. In: Proceedings of the 2020 8th International Conference on Information Technology: IoT and Smart City. 2020:110-114.
CrossRef - Qadir A, Mahum R, Aladhadh S. A robust approach for detection and classification of KOA based on BILSTM network. Comput Syst Sci Eng. 2023;47(2).
CrossRef - Reddy TR, Lakshmi KV, Nikhila L, Koneru S. Knee osteoarthritis detection and classification using ensemble model of Xception and Inception ResNetV2. In: 2024 2nd International Conference on Advancement in Computation & Computer Technologies (InCACCT). IEEE; 2024:607-612.
CrossRef - Yunus U, Amin J, Sharif M, Yasmin M, Kadry S, Krishnamoorthy S. Recognition of knee osteoarthritis (KOA) using YOLOv2 and classification based on convolutional neural network. Life. 2022;12(8):1126.
CrossRef - Zhao Z, Zhao M, Yang T. Identifying significant structural factors associated with knee pain severity in patients with osteoarthritis using machine learning. Sci Rep. 2024;14(1):14705.
CrossRef - Nurmirinta TA, Turunen MJ, Korhonen RK. Two-stage classification of future knee osteoarthritis severity after 8 years using MRI: data from the osteoarthritis initiative. Ann Biomed Eng. 2024:1-12.
CrossRef - Jain RK, Sharma PK, Gaj S, Sur A, Ghosh P. Knee osteoarthritis severity prediction using an attentive multi-scale deep convolutional neural network. Multimed Tools Appl. 2024;83(3):6925-6942.
CrossRef - Ahmed R, Imran AS. Knee osteoarthritis analysis using deep learning and XAI on X-rays. IEEE Access. 2024.
CrossRef - Kinger S. Deep learning for automatic knee osteoarthritis severity grading and classification. Indian J Orthop. 2024:1-16.
CrossRef - Goswami AD. Automatic classification of the severity of knee osteoarthritis using enhanced image sharpening and CNN. Appl Sci. 2023;13(3):1658.
CrossRef - Rani S, Memoria M, Rani M, Kumar R. Breast cancer detection using mammographic images over convolutional neural network. In: 2023 13th International Conference on Cloud Computing, Data Science & Engineering (Confluence). IEEE; 2023:73-78.
CrossRef - Lee DW, Song DS, Han HS, Ro DH. Accurate, automated classification of radiographic knee osteoarthritis severity using a novel method of deep learning: Plug-in modules. Knee Surg Relat Res. 2024;36(1):24.
CrossRef

