Ankit Singh Negi and Ruchi Yadav*
Amity Institute of Biotechnology, Amity University Uttar Pradesh, Lucknow, UP, India
Corresponding Author E-mail:ryadav@lko.amity.edu
DOI : https://dx.doi.org/10.13005/bpj/3026
Abstract
Non-Hodgkin's lymphoma (NHL) represents approximately 90% of all lymphoma cases in humans. This study aimed to discover novel genes associated with B-cell NHL by employing a machine learning approach using linear regression. Microarray data analysis was conducted using CEL files (12 samples across 6 types of B-cell NHL) obtained from the GEO database (accession ID: GSE132929). Differentially expressed genes (DEGs) were identified through R and Bioconductor packages, with DEG identification carried out using the Limma package (Linear Models for Microarray Data). RNA-seq data were analysed using paired-end sequencing (accession no. SRX4624931), and variant analysis was performed via the Galaxy server. Data enrichment for DEGs was conducted using the DAVID and GO databases. Pathway enrichment analysis of the microarray data revealed 14 pathways, with the most notable results observed in the group5-4 set. Among 10 genes, only KRAS proto-oncogene and cyclin D1 (CCND1) were implicated in these 14 pathways. RNA-Seq analysis identified 15 out of 189 genes involved in cancer-related pathways. Combined analysis of microarray and RNA-Seq data indicated significant differential expression of KRAS, CCND1, and RAF genes in B-cell NHL. Further experimental validation is required to explore these genes' potential in developing targeted therapies for NHL.
Keywords
Differentially Expressed Genes; Linear Model; Microarray Analysis; Non-Hodgkin's Lymphoma; RNA-Seq Analysis; Variant Analysis
Download this article as:| Copy the following to cite this article: Negi A. S, Yadav R. High Throughput Genomics Study for the Identification of Novel Genes Functional in B-Cell Non-Hodgkin Lymphoma. Biomed Pharmacol J 2024;17(4). |
| Copy the following to cite this URL: Negi A. S, Yadav R. High Throughput Genomics Study for the Identification of Novel Genes Functional in B-Cell Non-Hodgkin Lymphoma. Biomed Pharmacol J 2024;17(4). Available from: https://bit.ly/3CJdT1u |
Introduction
Non-Hodgkin’s lymphoma (NHL) the most common type of lymphoma in which typically the cancerous lymphocytes are present at the lymph nodes. Non-Hodgkin’s lymphoma accounts for about approx. 90% of lymphoma in human beings1. There are a number of risk factors recognized which may be accountable for the malignant transformation of non-Hodgkin’s lymphoma such as some sort of immune disorders, some infection, even the lifestyle of an individual, the genetics, having family history and profession all these have a strong impact. According to various studied on the types of non- Hodgkin’s lymphoma, diffuse large B-cell lymphoma (DLBCL) is most common3. It has been seen that in DLBCL there is fast nodal or extra nodal tumour growth, however this could also blowout to the other regions of lymphatic system. These lymphatic systems take in the lymphatic vessels, adenoids, tonsils, thymus, spleen, and even bone marrow. Rarely, non-Hodgkin’s lymphoma may even involve the organs excluding the organs of lymphatic system 4.
Nearly 90% of non-Hodgkin’s lymphomas develop in B cells. One of the types of B-cell non-Hodgkin lymphoma is Burkitt lymphoma, which is most commonly diagnosed in young adults and children. Studies indicate that this lymphoma predominantly affects males. It arises from mature B-lymphocytes and is known to be one of the most aggressive and rapidly proliferating cancers. Despite its severity, Burkitt lymphoma is relatively rare, accounting for only about 2% of all lymphoma cases diagnosed 5.
DLBCL is considered as the most common form of B-cell non-Hodgkin lymphoma. DLBCL represents around 30 % of all the cases. This type of lymphoma is mainly found in old age population. It is an aggressive form of lymphoma and has a high rate of proliferation. Apart from just being diagnosed in the lymph system, this type of lymphoma can be also found in other parts of the body like in breast, brain, testes and even in the gastrointestinal (GI) tract as a primary disease6.
Follicular lymphoma is referred as most lethargic lymphoma, having relatively lower rate of proliferation as compared to other types of lymphoma. Accounting for around 20 % of all the lymphoma cases. This type of lymphoma is mainly expressed in moderate age range population and in older adults also. Bone marrow or the lymph nodes are main site for the development of FL7. Mantle cell lymphoma (MCL) Accounts for around 5% of all lymphoma diagnoses. It is majorly diagnosed in old aged men. The sites for this type of lymphoma includes lymph nodes, bone marrow and spleen. MCL is one of the slow growing lymphomas8. According to various studied, the switching or translocation of position between two chromosomal segments is the genetic behind the cause of MCL. This type of lymphoma led to swelling of the lymph nodes and can spread to other parts of the body through blood. common forms of treatment methods for MCL are chemotherapy and targeted therapy. Apart from these stem cell transplant can also be an effective way for the treatment of MCL9.
Marginal zone lymphomas are a slow-growing type of lymphoma that develops in mature B cells within the spleen. Treatment options for this lymphoma can include chemotherapy and, in some instances, surgery. If the lymphoma is linked to an infection, antibiotics might also be used as part of the treatment 10.
RNA-Seq data Analysis
Transcriptome analysis is increasingly leveraging high-throughput RNA sequencing (RNA-Seq) techniques. These methods surpass microarrays in several key areas, including single base pair resolution, minimal background noise, a broad range for detecting transcript expression levels, greater reproducibility, reduced RNA sample requirements, and the capacity to discover transcripts not yet mapped to a known genome11.
Recent advances in both technology and analytical methods now allow for the simultaneous assessment of thousands of genes through next-generation sequencing. These developments have revolutionized cancer genomics, enabling large-scale and unbiased detection of genomic alterations. High-throughput mRNA sequencing (RNA-Seq) utilizes massively parallel sequencing to deliver a comprehensive and unbiased overview of genome-wide transcription levels and tumor mutation status. During the RNA-Seq process, complementary DNA (cDNA) is generated to create short sequence reads by attaching millions of amplified DNA fragments to a solid surface and conducting the sequencing reaction. The resulting sequences are then aligned with a reference genome or transcript database, providing a thorough description of the transcriptome under investigation.
Hence the aim of this study was to- Identify novel genes involved in B-cell non-Hodgkin lymphoma using linear regression approach., Microarray data analysis using R and Bioconductor packages, Vigorous data analysis to identify variant in paired end RNAseq data on non- Hodgkin lymphoma, In-dept study about genes involved in non-Hodgkin lymphoma.
Materials and Methods
Microarray Data Retrieval
Microarray gene expression data analysis of B- cell non-Hodgkin’s lymphoma was retrieved from GEO database of NCBI. (https://www.ncbi.nlm.nih.gov/) with accession ID: GSE132929 . The raw CEL file and CDF file as mentioned in table 1 were selected and downloaded.
The details related data under study was shown in the table 1. The series consists of gene expression microarray data from non-Hodgkin lymphoma tumour for which MD Anderson Cancer Centre have performed targeted DNA sequencing with the 380 gene LymphoSeq panel by using Affymetrix U133 plus 2.0 microarray (HG-U133_Plus_2). Sample type- RNA, source- biopsy, organism- Homo Sapiens, microarray chip- Affymetrix chip, platform ID- GPL570.
Table 1: list of accession ID, sample name and type of sample lymphoma used under study
|
S.No |
Accession Id |
Sample Name |
Type |
|
1 |
GSM3896454 |
FL_001 |
Follicular Lymphoma |
|
2 |
GSM3896455 |
FL_002 |
Follicular Lymphoma |
|
3 |
GSM3896519 |
MCL_001 |
Mantle Cell Lymphoma |
|
4 |
GSM3896520 |
MCL_002 |
Mantle Cell Lymphoma |
|
5 |
GSM3896563 |
DLBCL_002 |
Diffuse Large B-cell Lymphoma |
|
6 |
GSM3896564 |
DLBCL_003 |
Diffuse Large B-cell Lymphoma |
|
7 |
GSM3896650 |
HGBL-NOS_016 |
High-grade B-cell Lymphoma Not Otherwise Specified |
|
8 |
GSM3896654 |
HGBL-NOS_017 |
High-grade B-cell Lymphoma Not Otherwise Specified |
|
9 |
GSM3896656 |
BL_001 |
Burkitt’s Lymphoma |
|
10 |
GSM3896660 |
BL_002 |
Burkitt’s Lymphoma |
|
11 |
GSM3896721 |
MZL_001 |
Medial Zone Lymphoma |
|
12 |
GSM3896722 |
MZL_002 |
Medial Zone Lymphoma |
Computational software’s and tools were used to identify of novel genes expressed in B-cell non- Hodgkin’s lymphoma. Figure 1 shows the workflow used for microarray data analysis and annotation from reading raw files that is CEL file in R workspace upto functional enrichment.
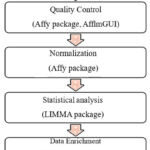 |
Figure 1: Workflow used for the microarray data analysis to identify differentially expressed genes. |
Affy package 12 of R and Bioconductor was used. The quality control plots were generated over the raw data using AffyQCReport 13 and afflmGUI 14 packages. Normalization and background correction of CEL files was done using RMA function for generating expression set matrix expresso function was used.
Statistical Analysis
The gene expression profile was analysed to identify differentially expressed genes (DEGs) in B-cell non-Hodgkin’s lymphoma (NHL). DEGs are characterized by statistically significant differences in expression levels or read counts between experimental groups.
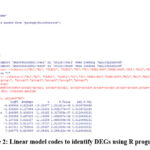 |
Figure 2: Linear model codes to identify DEGs using R programing |
This analysis is crucial for understanding the molecular mechanisms underlying NHL and for identifying potential biomarkers or therapeutic targets.conditions. LIMMA package15 of R and
Bioconductor was used for identification of differentially expressed probe sets. Expression estimation was obtained by the linear regression algorithm. An appropriate design matrix was created, and then linear model fitted to it. A list of top genes differential expressed was retrieved by using top Table function as shown in figure 2.
Gene Set Enrichment Analysis (GSEA)
Differentially expressed genes were annotated for biological significance and analysed for its role in different biological pathways . List of differentially expressed genes from each set of groups was annotated using DAVID and GO database.
RNA-Seq data Retrieval
Further study includes RNAseq analysis paired end RNA-seq sequencing data for non-hodgkin’s lymphoma was retrieved from ENA database with accession no.- SRX4624931. Two FASTQ format files were downloaded as mentioned in table 2.
Table 2: list of FASTQ sequences taken for RNAseq data analysis- study accession ID, sample accession, experiment accession ID, Run accession ID.
|
Study Accession |
Sample Accession |
Experiment Accession |
Run Accession |
FASTQ |
|
PRJNA488595 |
SAMN09936934 |
SRX4624931 |
SRR7769357 |
SRR7769357_1.fastq.gz |
|
PRJNA488595 |
SAMN09936934 |
SRX4624931 |
SRR7769357 |
SRR7769357_2.fastq.gz |
The paired end sequence for non-Hodgkin’s lymphoma sample was taken from ENA database. Instrument model for the sequences was Illumina HiSeq 2000, library strategy: RNA-Seq, library selection: cDNA, organism: Homo sapiens.
RNA-Seq data Analysis
For quality control analysis of FASTQ files, begin by using the FastQC tool available in the Galaxy tools panel 16 you can locate it using the search box. Sequencing errors can skew the analysis and lead to inaccurate data interpretation. Additionally, adapters may be present if the reads are longer than the sequenced fragments, and trimming these adapters can enhance the mapping efficiency17. To trim the data, use the Trimmomatic tool in Galaxy, which performs various trimming tasks for Illumina paired-end and single-end data 18. To compile and review the quality control results, use MultiQC to aggregate the outputs from FastQC 19.Steps used for RNA- Seq data analysis was shown in figure 3.
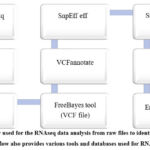 |
Figure 3: workflow used for the RNAseq data analysis from raw files to identification of variants genes. |
Alignment to the Reference (mapping)
To map the reads from the input FASTQ file to the reference genome, the RNA STAR tool in Galaxy was used 18. In the reference genome tab, select the option to use a built-in reference and set it to ‘hg19’. The output will include the STAR log file, splice junctions .bed file, and mapped .bam file. Next, use MultiQC to aggregate the STAR log results. For visual analysis, review the BAM file using the UCSC Genome Browser and IGV viewer.
Genetic Variant Calling with Free Bayes
For variant calling, FreeBayes 20 tool of galaxy was used. Input the BAM file and select the reference genome as ‘hg19’
Variant Analysis
VCFannotate 21 tool is used to intersect VCF records with BED annotations. As an input VCF file from generated from FreeBayes tool and a BED file to intersect with is provided. And then click on execute. SnpEff eff 22 tool is used `to annotate variants. As an input VCF file and a pre- built database for SnpEff build is provided. And the click on execute. SnpSift Annotate 22 is typically used to annotate IDs from dbSnp. Variant input file in VCF format and VCF File with ID field annotated were given as input. And then click on execute. SnpSift GeneSets22 tool is used for annotating GeneSets. As an input VCF file from SnpEff Eff tool was given along with the annotation database i.e. MSigDB – oncogenic signature gene sets. http://www.gseamsigdb.org/gsea/downloads.jsp).
Data Enrichment of RNA-Seq Data
Variant genes were then further annotated for biological intervention and pathway analysis. Annotated list of variants from SnpSift GeneSet was searched against GO database.
Results and Discussions
Microarray Data Analysis and Annotation Results
Quality control analysis of microarray data. The quality control analysis was performed using affylmGUI and AffyQCReport packages of R and Bioconductor. The quality assessment of affymetrix gene chip data of 6 set (i.e. 12 samples) of CEL files for 6 different types of B-cell non- Hodgkin’s lymphoma were analysed by plotting quality control plots.
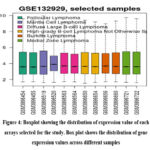 |
Figure 4: Boxplot showing the distribution of expression value of each arrays selected for the study. Box plot shows the distribution of gene expression values across different samples |
In figure 4 shows the comparison of overall probe intensity readings of all arrays considered under study. Any variation in array may suggest a potential issue with this particular array and further it is normalized for statistical analysis.
The figure 5 shows the RNA degradation phots for 12 arrays of 6 different types of B-cell non-Hodgkin’s lymphoma. This RNA degradation plot was computed on normalized data. Each line in the plot represent an array.
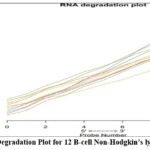 |
Figure 5: RNA Degradation Plot for 12 B-cell Non-Hodgkin’s lymphoma arrays. |
Figure 5 shows that diffuse large B-cell lymphoma (DLBCL_02.CEL) shows the highest slope value i.e. 6.76 where as Mantle cell lymphoma (MCL_02.CEL) has the smallest slope value i.e. 3.33. The slope is within the recommended range, suggesting that all the samples are of high quality. Additionally, there is a strong correlation among the various arrays in the dataset.
Figure 6 shows the image array plot of microarray chip plotted using AffylmGUI package of R and Bioconductor. The plot (a, b) Burkitt’s lymphoma , (c, d) Diffuse large B-cell Lymhoma, (e, f) Follicular Lymphoma, (g, h) high grade B-cell lymphoma, (i, j) mantle cell lymphoma and (k,l) medial zone lymphoma. Chip images shows that overall intensity of probes across chips.
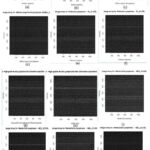 |
Figure 6: image array plot of microarray chip plotted using AffylmGUI package of R and Bioconductor. |
Microarray Data Analysis
Linear regression algorithm was used for microarray data analysis using LIMMA package of R and Bioconductor. LIMMA package provides a platform for the comparative analysis between various RNA targets instantaneously in the complex designed experiment. The Empirical Bayesian methods (i.e. ebayes ()) are very useful in getting a stable set of results even with the small number of arrays. The expression data have log- ratio M for the two-colour array platform.
Firstly, to fit the linear model to the microarray expression data to each sample groups. For this the matrix was designed and 6 set of groups were made according to the type of B-cell non-Hodgkin’s lymphoma that is Group 1-Burkitt’s lymphoma (BL), Group 2- diffuse large B-cell lymphoma (DLBCL), Group 3- follicular lymphoma, Group 4 – High- grade B-cell Lymphoma (HGBL-NOS), Group 5- Mantle Cell Lymphoma (MCL) and Group 6- Medial Zone Lymphoma (MZL). The contrast matrix was created between the pair of groups: Group 2-1, Group 3-2, Group 4-3, Group 5-4, Group 6-5 and Group 6-1. The contrasts Fit method was linear model was applied over the contrast matrix. Finally, Empirical Bayes method was applied for computing the logFC value, average log2- expression, moderated t-statistics, adjusted p-value and B-statistic. Then the top Table method was used to execute the top 10 ranked differentially expressed genes from the two datasets
Table 3: top 5 Differentially Expressed Genes between Group 1-Burkitt’s lymphoma (BL) and Group 2- diffuse large B-cell lymphoma (DLBCL).
|
gene ID |
Gene name |
logFC |
AveExpr |
t |
P. Value |
adj.P.Val |
B |
|
205000_at |
DDX3Y |
-5.88593 |
6.157944 |
-13.0315 |
3.83E-07 |
0.010476 |
5.243563 |
|
212489_at |
COL5A1 |
-3.25426 |
3.667428 |
-11.141 |
1.46E-06 |
0.012645 |
4.522844 |
|
224590_at |
XIST |
5.197332 |
3.602337 |
11.10209 |
1.50E-06 |
0.012645 |
4.505694 |
|
202311_s_at |
COL1A1 |
-4.59185 |
3.52187 |
-10.7873 |
1.91E-06 |
0.012645 |
4.362945 |
|
1552787_at |
HELB |
2.641911 |
3.789506 |
10.59467 |
2.22E-06 |
0.012645 |
4.272042 |
Table 4: top 5 Differentially Expressed Genes Group 2- diffuse large B-cell lymphoma (DLBCL) and Group 3- follicular lymphoma,
|
gene ID |
gene name |
logFC |
AveExpr |
t |
P.Value |
adj.P.Val |
B |
|
205000_at |
DDX3Y |
5.929566 |
6.157944 |
13.12814 |
3.60E-07 |
0.019665 |
-2.81698 |
|
236694_at |
TXLNGY |
4.810079 |
5.333022 |
11.63416 |
1.01E-06 |
0.019708 |
-2.84956 |
|
201909_at |
RPS4Y1 |
5.565347 |
9.05931 |
11.3349 |
1.26E-06 |
0.019708 |
-2.85752 |
|
224588_at |
XIST |
-7.67613 |
5.520689 |
-11.1535 |
1.44E-06 |
0.019708 |
-2.86262 |
|
224590_at |
XIST |
-5.06838 |
3.602337 |
-10.8266 |
1.85E-06 |
0.020256 |
-2.8724 |
Table 5: top 5 Differentially Expressed Genes between Group 3- follicular lymphoma and Group 4 – High- grade B-cell Lymphoma (HGBL-NOS)
|
gene ID |
gene name |
logFC |
AveExpr |
t |
P.Value |
adj.P.Val |
B |
|
236694_at |
TXLNGY |
5.478579 |
5.333022 |
13.25107 |
3.32E-07 |
0.015375 |
3.576298 |
|
205000_at |
DDX3Y |
5.628086 |
6.157944 |
12.46066 |
5.62E-07 |
0.015375 |
3.408812 |
|
201909_at |
RPS4Y1 |
5.545314 |
9.05931 |
11.2941 |
1.30E-06 |
0.023638 |
3.114081 |
|
207245_at |
UGT2B17 |
3.912282 |
2.877049 |
10.50753 |
2.38E-06 |
0.032547 |
2.876181 |
|
236302_at |
PPM1E |
-3.56836 |
3.611297 |
-9.52999 |
5.36E-06 |
0.058296 |
2.525727 |
Table 6: top 5 Differentially Expressed Genes between Group 4 – High- grade B-cell Lymphoma (HGBL-NOS) and Group 5- Mantle Cell Lymphoma (MCL)
|
gene ID |
gene name |
logFC |
AveExpr |
t |
P.Value |
adj.P.Val |
B |
|
205000_at |
DDX3Y |
-5.31837 |
6.157944 |
-11.775 |
9.11E-07 |
0.034027 |
5.194026 |
|
208711_s_at |
CCND1 |
-4.94661 |
5.602951 |
-10.8168 |
1.87E-06 |
0.034027 |
4.733261 |
|
203509_at |
SORL1 |
4.687515 |
8.648969 |
10.47631 |
2.44E-06 |
0.034027 |
4.553245 |
|
201909_at |
RPS4Y1 |
-4.96028 |
9.05931 |
-10.1026 |
3.31E-06 |
0.034027 |
4.344845 |
|
225046_at |
LOC102724951 |
-3.11704 |
4.842963 |
-10.0359 |
3.49E-06 |
0.034027 |
4.306405 |
Table 7: top 5 Differentially Expressed Genes between Group 5- Mantle Cell Lymphoma (MCL) and Group 6- Medial Zone Lymphoma (MZL).
|
gene ID |
gene name |
logFC |
AveExpr |
t |
P.Value |
adj.P.Val |
B |
|
1558697_a_at |
KIAA0430 |
-2.52147 |
3.380706 |
-10.2835 |
2.85E-06 |
0.142036 |
2.919754 |
|
208711_s_at |
CCND1 |
4.221763 |
5.602951 |
9.231765 |
6.97E-06 |
0.142036 |
2.509209 |
|
235643_at |
SAMD9L |
-2.97355 |
5.655163 |
-8.51194 |
1.35E-05 |
0.142036 |
2.175097 |
|
223185_s_at |
BHLHE41 |
-3.07238 |
3.202969 |
-8.48091 |
1.39E-05 |
0.142036 |
2.159586 |
|
235802_at |
PLD4 |
-2.81842 |
3.997129 |
-8.24667 |
1.74E-05 |
0.142036 |
2.03932 |
Table 8: top 5 Differentially Expressed Genes between Group 6- Medial Zone Lymphoma (MZL) and Group 1-Burkitt’s lymphoma (BL)
|
gene ID |
Gene Name |
logFC |
AveExpr |
t |
P.Value |
adj.P.Val |
B |
|
201710_at |
MYBL2 |
-3.60436 |
7.591107 |
-12.7644 |
4.58E-07 |
0.00988 |
5.859247 |
|
202729_s_at |
LTBP1 |
-3.2543 |
6.373022 |
-12.3197 |
6.20E-07 |
0.00988 |
5.667491 |
|
212489_at |
COL5A1 |
-3.53426 |
3.667428 |
-12.0996 |
7.23E-07 |
0.00988 |
5.568211 |
|
203589_s_at |
TFDP2 |
-2.9582 |
4.952128 |
-11.4574 |
1.15E-06 |
0.01256 |
5.260737 |
|
202311_s_at |
COL1A1 |
-4.70515 |
3.52187 |
-11.0534 |
1.56E-06 |
0.014176 |
5.05276 |
The table-3,4,5,6,7,8 are the result of the top 10 differentially expressed gene in group 2-1, group 3-2, group 4-3, group 5-4, group 6-5 and group 6-1 respectively. Each table gives the list of geneID of the differentially expressed genes, the logFC , AveExpr, t value, pvalue, adj. pvalue, B value for each gene. LogFC is the estimation of the log2 fold change corresponding to the contrasts. AveExpr is the average log2 expression for probes. t is the moderated t-statistic, pvalue is the cutoff value for adjusted p-values , the genes having lower p-values are listed. B is the log-odds that gene is differentially expressed.
Functional Annotation and Enrichment Analysis of DEGs
The functional annotation and data enrichment were done over each set of top10 differentially expressed genes enlisted by using limma package as shown in table- 3,4,5,6,7,8. The gene IDs were annotated using the DAVID database to obtain the corresponding gene symbols. These gene symbols were then further annotated with the Gene Ontology database.
Pathway Enrichment
Pathway enrichment was done to annotated which gene was involved in the cancer causing pathways, so that such information can be used in designing target specific drugs. Pathway analysis was done over each set of differentially expressed gene. Out of which the most effective result was seen in the group 5-4 (table-6). The genes expressed in this group were DDX3Y, CCND1, SORL1, RPS4Y1, LOC102724951, KRAS, FGD6, DNMT3A, KNL1, TXLNGY. All gene were identified in GO database for the pathway enrichment analysis table 9 shows the list of Gene Ontology pathways along with gene names that are annotated.
Table 9: List of genes and the pathway involved annotated using GO database
|
S.No |
GO Pathway |
Gene name |
|
1 |
Angiogenesis (P00005) |
KRAS |
|
2 |
EGF receptor signaling pathway (P00018) |
KRAS |
|
3 |
FGF signaling pathway (P00021) |
KRAS |
|
4 |
Integrin signaling pathway (P00034) |
KRAS |
|
5 |
PDGF signaling pathway (P00047) |
KRAS |
|
6 |
PI3 kinase pathway (P00048) |
KRAS, CCDN1 |
|
7 |
Ras Pathway (P04393) |
KRAS |
|
8 |
TGF-beta signaling pathway (P00052) |
KRAS |
|
9 |
VEGF signaling pathway (P00056) |
KRAS |
|
10 |
p53 pathway (P04398) |
KRAS |
|
11 |
CCKR signaling map (P06959) |
CCDN1 |
|
12 |
Cell cycle (P00013) |
CCDN1 |
|
13 |
Wnt signaling pathway (P00057) |
CCDN1 |
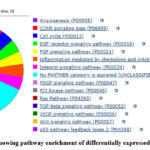 |
Figure 7: Pie chart showing pathway enrichment of differentially expressed genes of group 5-4 |
As shown in the table 9, all total 14 pathways were found during pathway enrichment using GO database. These pathways were Angiogenesis (P00005), EGF receptor signalling pathway (P00018), FGF signalling pathway (P00021), Integrin signalling pathway (P00034), PDGF signalling pathway (P00047), PI3 kinase pathway (P00048), Ras Pathway (P04393), TGF-beta signalling pathway (P00052), VEGF signalling pathway (P00056), p53 pathway feedback loops 2 (P04398), CCKR signalling map (P06959), Cell cycle (P00013), Wnt signalling pathway (P00057) as shown in figure-7. Out of 10 genes which were annotated only 2 genes were found involved in these 14 pathways. These genes were KRAS proto-oncogene, GTPase (KRAS) and cyclin D1(CCND1). KRAS gene was involved in 11 out of 14 pathways where as CCDN1 gene was involved in 4 out of 14 pathways. It was seen that KRAS gene was involved in most of the cancer-causing pathways like PI3 kinase pathway (P00048), EGF receptor signalling pathway (P00018), p53 pathway (P04398), TGF-beta signalling pathway (P00052), Ras Pathway (P04393).
RNA-Seq Data Analysis and Annotation Results
The quality control analysis of the RNA-Seq data was conducted on two raw paired-end Fastq files of non-Hodgkin’s lymphoma obtained from the ENA database. The FastQC tool from Galaxy was employed for assessing the quality of the RNA-Seq data. FastQC generates basic text and HTML reports that include quality control plots covering various metrics such as basic statistics, per base sequence quality, per sequence quality scores, per base sequence content, per base GC content, per sequence GC content, per base N content, sequence length distribution, sequence duplication levels, overrepresented sequences, and kmer content. Subsequently, MultiQC was used to consolidate the results from the two FastQC analyses into a single report FastQC result was shown in Figure 8.
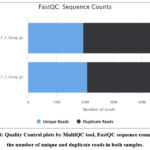 |
Figure 8: Quality Control plots by MultiQC tool, FastQC sequence counts shows the number of unique and duplicate reads in both samples. |
Variant Data Analysis and Annotation
The variant data analysis was done using Galaxy tools. Firstly, FreeBayes tool was used to generate VCF file over the raw Fastq data. Then VCFannotat tool was used to intersect VCF records with BED annotation. Further annotation was done using SnpEff eff tool. And finally, SnpSift Geneset tool was used to add annotation from oncogenic signature gene sets of MSigDB. As shown in the table 10, the number variants in SNP were 216,177 and 212,767 in seq1 and seq2 respectively.
Table 10: Number variants in seq1 and seq2 by type of mutations
|
Type |
Total (seq1) |
Total (seq2) |
|
SNP |
216,177 |
212,767 |
|
MNP |
16,969 |
17,025 |
|
INS |
6,881 |
7,531 |
|
DEL |
7,585 |
7,439 |
|
MIXED |
548 |
542 |
|
INV |
0 |
0 |
|
DUP |
0 |
0 |
|
BND |
0 |
0 |
|
INTERVAL |
0 |
0 |
|
Total |
248,160 |
245,304 |
It was seen that there were more MNP number variants in seq2 than seq1 that is MNP for seq2 was 17,025 whereas that for seq1 was 16,969. Insertion variants accounts 6,881 for seq1 and 7,531 foe seq2. Deletion variants in seq1 was 7,585 and for seq2 it was 7,439. Mixed variants were 548 and 542 for seq1 and seq2 respectively. Therefore, the total number variants in seq1 were 248,160 and that for seq2 it was 245,304. Table 11 shows the number of variants by functional class that is missense, nonsense and silent genes count along with their percentage for each sequence is shown in the table 11.
Table 11: Number of effects by functional class Missense, Nonsense and Silent mutation along with count and percentage values
|
Type |
Count1 |
Percent1 |
Count2 |
Percent2 |
|
MISSENSE |
14,581 |
49.546% |
10,664 |
44.884% |
|
NONSENSE |
193 |
0.656% |
143 |
0.602% |
|
SILENT |
14,655 |
49.798% |
12,952 |
54.514% |
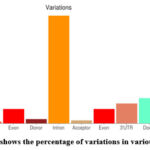 |
Figure 9: bar plot shows the percentage of variations in various genomic regions. |
By the analysis of figure 9, it was seen that there is maximum variation that is above 50% was seen in the intron region of the sequence. About 6-8% variation was in exon regions of the sequence. There were relatively lesser number of variations in the up regulated genes than the down-regulating genes. There were lesser number of variations in untranslated region (UTR) at the 5’ end than at the 3’ end.
The SnpSift GeneSets tool is used to add annotations from MSigDB, a collection of annotated gene sets from different sources including Gene Ontology (GO), KEGG, Reactome. Table 12 shows the result of Snpsift Geneset result, list of up and down regulated genes, the Geneset size and the variation in them with respect to the reference oncogenic signature gene sets of MSigDB. Result shows that there were 189 gene sets and 10913 genes.
Table 12: List of UP and Down regulated variant genes along with count value of Geneset size and the variation.
|
Gene_Set |
Gene_Set_Size |
Variants |
|
AKT_UP.V1_DN |
187 |
1906 |
|
AKT_UP.V1_UP |
169 |
2014 |
|
ATF2_S_UP.V1_DN |
187 |
2035 |
|
ATF2_S_UP.V1_UP |
192 |
1656 |
|
KRAS.300_UP.V1_DN |
140 |
905 |
|
KRAS.300_UP.V1_UP |
142 |
1134 |
|
PTEN_DN.V1_DN |
184 |
1300 |
|
PTEN_DN.V1_UP |
186 |
1205 |
|
P53_DN.V1_DN |
194 |
1890 |
|
P53_DN.V1_UP |
194 |
1935 |
|
RAF_UP.V1_DN |
193 |
2578 |
|
RAF_UP.V1_UP |
193 |
2154 |
|
E2F3_UP.V1_DN |
161 |
1787 |
|
E2F3_UP.V1_UP |
191 |
2696 |
|
MYC_UP.V1_DN |
172 |
1538 |
|
MYC_UP.V1_UP |
181 |
2607 |
|
MTOR_UP.V1_DN |
181 |
1878 |
|
MTOR_UP.V1_UP |
169 |
2625 |
|
CYCLIN_D1_UP.V1_DN |
190 |
2021 |
|
CYCLIN_D1_UP.V1_UP |
187 |
1650 |
|
RB_DN.V1_DN |
123 |
1578 |
|
RB_DN.V1_UP ATK PTEN |
117 |
1655 |
|
ATM_DN.V1_DN |
146 |
930 |
|
ATM_DN.V1_UP |
146 |
1136 |
|
ERBB2_UP.V1_DN |
197 |
4182 |
|
ERBB2_UP.V1_UP |
190 |
1896 |
|
RELA_DN.V1_DN |
139 |
1018 |
|
RELA_DN.V1_UP |
149 |
1302 |
Visualisation of Variants
Visual analysis of the variants (VCF file) was done using Vcf.iobio, UCSC browser, which is integrated with the galaxy, which enable the user to analysis large set of datasets.
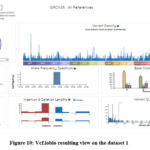 |
Figure 10: Vcf.iobio resulting view on the dataset 1 |
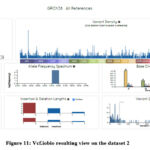 |
Figure 11: Vcf.iobio resulting view on the dataset 2 |
As shown in the figure- 10 and 11, vcf.iobio shows high level variant calling (VCF) metrics in real time. The above figures show the variant density plot, Ts/Tv ratio plots, base changes plots, variant types, insertion & deletion length plot and variant quality plots.
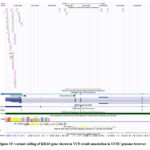 |
Figure 12: variant calling of KRAS gene shown in VCF result annotation in UCSC genome browser |
As shown in figure- 12, variant alignment of KRAS gene was viewed on the VCF results from the SnpSift GeneSet tool at UCSC genome browser. This alignment shows that the variation of KRAS gene located on chromosome number 12 (ch12). 22 set of variation was shown. Out of which 6 variation were in UTR between T-C, A-C and G-C. In the intronic region 3 variants were show between C-T. while there were 5 missense variant between G-A. These variants were analysed using the dbSNP database.
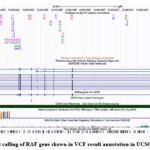 |
Figure 13: variant calling of RAF gene shown in VCF result annotation in UCSC genome browser |
As shown in figure- 13, variant alignment of RAF gene was viewed on the VCF results from the SnpSift GeneSet tool at UCSC genome browser. This alignment shows that the variation of RAF gene located on chromosome number 3 (chr 3). 29 set of variants were shown(figure-10). Out of which 6 variation were in 3’UTR between T-C, C-T and GAAA-CAAT. About 3 synonymous variants were show between ACT-GCC. These variants were analysed using the dbSNP database.
Functional annotation and Pathway Enrichment of variant genes
The functional annotation and data enrichment were done over the annotated list of variant genes enlisted in table 12 by using SnpSift GeneSets tool of galaxy. The geneID were annotated in the GO database. Pathway enrichment was done to annotated which gene was involved in the cancer-causing pathways, so that such information can be used in designing target specific drugs. Pathway enrichment was performed over 189 variant gene. Out of these 189 genes 13 genes were found involved in the cancer-causing pathways. These 15 genes were MTOR, PKCA, JAK2, CCND1, ATF2, KRAS, RAF, RB, E2F3, PTEN, P53, ATM, MYC, ERBB2, RELA. The table below shows the list of various pathways in which these genes are involved.
Table 13: List of variant genes and the pathway involved annotated using GO database.
|
S.No |
Pathways |
Genes |
|
1 |
Apoptosis signaling pathway (P00006) |
ATF2, PKCA, P53, RELA |
|
2 |
EGF receptor signaling pathway (P00018) |
PKCA, RAF, ERBB2, KRAS |
|
3 |
FGF signaling pathway (P00021) |
PKCA, KRAS, RAF |
|
4 |
Inflammation mediated by chemokine and cytokine signaling pathway (P00031) |
JAK2, PTEN, KRAS, RELA, RAF |
|
5 |
Integrin signalling pathway (P00034) |
SRC, KRAS, RAF |
|
6 |
P53 pathway feedback loops 1 (P04392) |
P53 |
|
7 |
PDGF signaling pathway (P00047) |
JAK2, PKCA, KRAS, MYC, RAF, MTOR, |
|
8 |
PI3 kinase pathway (P00048) |
JAK2, PTEN, KRAS, CCND1 |
|
9 |
Ras Pathway (P04393) |
ATF2, KRAS, RAF |
|
10 |
p53 pathway feedback loops 2 (P04398) |
RB, E2F3, PTEN, KRAS, P53, ATM, MYC |
Table 13 shows the pathway enrichment analysis using the GO database identified a total of 45 pathways, with 10 of these associated with cancer. These cancer-related pathways include the Apoptosis signalling pathway (P00006), EGF receptor signalling pathway (P00018), FGF signaling pathway (P00021), Inflammation mediated by chemokine and cytokine signaling pathway (P00031), Integrin signalling pathway (P00034), P53 pathway feedback loops 1 (P04392), PDGF signaling pathway (P00047), PI3 kinase pathway (P00048), Ras Pathway (P04393), and p53 pathway feedback loops 2 (P04398).
The KRAS gene 23 was involved in eight pathways: EGF receptor signalling pathway (P00018), FGF signaling pathway (P00021), Inflammation mediated by chemokine and cytokine signaling pathway (P00031), Integrin signalling pathway (P00034), PDGF signaling pathway (P00047), PI3 kinase pathway (P00048), Ras Pathway (P04393), and p53 pathway feedback loops 2 (P04398). The ATF2 gene was associated with two pathways: Apoptosis signaling pathway (P00006) and Ras Pathway (P04393). The PKCA gene participated in four pathways: Apoptosis signaling pathway (P00006), EGF receptor signaling pathway (P00018), FGF signaling pathway (P00021), and PDGF signaling pathway (P00047). The P53 gene was involved in three pathways: Apoptosis signaling pathway (P00006), P53 pathway feedback loops 1 (P04392), and p53 pathway feedback loops 2 (P04398). The RELA gene was associated with two pathways: Apoptosis signaling pathway (P00006) and Inflammation mediated by chemokine and cytokine signaling pathway (P00031). The RAF gene24 was present in five pathways: EGF receptor signaling pathway (P00018), FGF signaling pathway (P00021), Inflammation mediated by chemokine and cytokine signaling pathway (P00031), Integrin signaling pathway (P00034), and Ras Pathway (P04393). The ERBB2 gene25 was linked to the EGF receptor signaling pathway (P00018), and the JAK2 gene was associated with three pathways.
Conclusion
Non-Hodgkin’s lymphoma (NHL) is the most prevalent type of lymphoma, typically characterized by cancerous lymphocytes in the lymph nodes. NHL accounts for approximately 90% of all lymphoma cases in humans. Gene expression analysis has significantly advanced our understanding of various biological processes, enhancing target-specific drug design. This study involved microarray data analysis to identify differentially expressed genes using a linear regression algorithm on raw CEL files with R and Bioconductor packages. Functional annotation and enrichment of these genes were performed using the DAVID and GO databases. The final analysis revealed that two genes, KRAS and CCND1, were involved in cancer-related pathways.
Further investigation into variant gene expression and their involvement in NHL was conducted through RNA-Seq data analysis using Galaxy tools. The RNA-Seq results indicated that out of 189 variant gene sets and 10,913 genes, around 15 genes were implicated in 10 cancer-causing pathways. Among these 15 genes, KRAS, RAF, and PKCA were found in multiple cancer pathways. Visualization using the UCSC Genome Browser showed significant variations in these genes compared to the reference genome. KRAS, CCND1, and RAF exhibited notable differences in gene expression in B-cell NHL.
Research indicates that the KRAS gene encodes the K-ras protein, which is part of the RAS/MAPK signaling pathway and is classified as an oncogene with the potential to cause cancer. KRAS is also implicated in NHL. CCND1 (Cyclin D1) encodes a protein involved in regulating CDK kinases in the cell cycle, and mutations in this gene can lead to various cancers, including intestinal and stomach cancer. The RAF gene provides instructions for a protein involved in the RAS/MAPK signaling pathway, transmitting chemical signals from outside the cell to the nucleus. Further wet lab analysis is recommended for these genes due to their potential role in targeted drug design for NHL.
Acknowledgement
I would like to acknowledge Amity Institute of biotechnology, Amity University Uttar Pradesh, Lucknow campus for providing us facilities to conducting this study. This research project is not funded by any specific grant from funding agencies in the public, commercial, or non-profit sectors.
Funding Sources
The author received no financial support for the research, authorship, and/or publication of this article
Conflicts of Interest
The author do not have any conflict of interest.
Data Availability Statement
The manuscript incorporates all datasets produced or examined throughout this research study.
Ethics Statement
This research did not involve human participants, animal subjects, or any material that requires ethical approval
Informed Consent Statement
This study did not involve human participants, and therefore, informed consent was not required
Clinical Trial Registration
This research does not involve any clinical trials
Authors’ Contribution
Ankit Singh Negi: Data Collection, Methodology, Writing – Original Draft.
Ruchi Yadav: Conceptualization, Analysis, Writing – Review & Editing
References
- Elenitoba-Johnson KS, Lim MS. New insights into lymphoma pathogenesis. Annu Rev Pathol. 2018;13:193-217.
CrossRef - Maurie M. Non-Hodgkin lymphoma types. Medicine & Science at CTCA. Published November 5, 2020.
- Yadav R, Srivastava P. Clustering, Pathway Enrichment, and Protein-Protein Interaction Analysis of Gene Expression in Neuro-developmental Disorders. Adv Pharmacol Sci. 2018;2018:1-10.
CrossRef - Zhao B, Erwin A, Xue B. How many differentially expressed genes: A perspective from the comparison of genotypic and phenotypic distances. Genomics. 2018;110(1):67-73.
CrossRef - McClure R, Balasubramanian D, Sun Y. Computational analysis of bacterial RNA-Seq data. Nucleic Acids Res. 2013;41(14).
CrossRef - Bai J, Luo Y, Zhang S. Microarray data analysis reveals gene expression changes in response to ionizing radiation in MCF7 human breast cancer cells. Hereditas. 2020;157(1):1-8.
CrossRef - Gibcus JH, Tan LP, Harms G. Hodgkin lymphoma cell lines are characterized by a specific miRNA expression profile. Neoplasia. 2009;11(2):167-176.
CrossRef - Alizadeh AA, Eisen MB, Davis RE. Distinct types of diffuse large B-cell lymphoma identified by gene expression profiling. Nature. 2000;403(6769):503-511.
CrossRef - Zekri AR, Hassan ZK, Bahnassy AA. Gene expression profiling of non-Hodgkin lymphomas. Asian Pac J Cancer Prev. 2013;14(7):4393-4398.
CrossRef - Bende RJ, Smit LA, van Noesel CJ. Molecular pathways in follicular lymphoma. Leukemia. 2007;21(1):18-29.
CrossRef - Gressin L, Sánchez-Bernabé B, Collins B. Beyond benchmarking and towards predictive models of dataset-specific single-cell RNA-seq pipeline performance. Genome Biol. 2023;24(1):57.
- Gautier L, Cope L, Bolstad BM, Irizarry RA. affy—analysis of Affymetrix GeneChip data at the probe level. Bioinformatics. 2004;20(3):307-315.
CrossRef - Wettenhall J, Simpson K, Satterley K, Smyth G. affylmGUI: a graphical user interface for linear modeling of single channel microarray data. Bioinformatics. 2006;22(8):897-899.
CrossRef - Huber W, Carey VJ, Gentleman R. Bioinformatics for high-throughput sequencing data. Nature Rev Genet. 2010;11(8):487-497.
- Ritchie ME, Phipson B, Wu D. limma powers differential expression analyses for RNA-sequencing and microarray studies. Nucleic Acids Res. 2015;43(7).
CrossRef - Ewels P, Magnusson M, Lundin S, Käller M. MultiQC: summarize analysis results for multiple tools and samples in a single report. Bioinformatics. 2016;32(19):3047-3048.
CrossRef - Bolger AM, Lohse M, Usadel B. Trimmomatic: a flexible trimmer for Illumina sequence data. Bioinformatics. 2014;30(15):2114-2120.
CrossRef - Dobin A, Davis CA, Schlesinger F. STAR: ultrafast universal RNA-seq aligner. Bioinformatics. 2013;29(1):15-21.
CrossRef - Ewels P, Magnusson M, Lundin S, Käller M. MultiQC: summarize analysis results for multiple tools and samples in a single report. Bioinformatics. 2016;32(19):3047-3048.
CrossRef - Tange O. GNU Parallel – The Command-Line Power Tool. Usenix Magazine. 2011;36(1):42-47.
- Garrison E, Marth G. Haplotype-based variant detection from short-read sequencing. Genome Res. 2012;22(2):235-245.
- Cingolani P, Platts A, Wang LL. A program for annotating and predicting the effects of single nucleotide polymorphisms, SnpEff. Fly (Austin). 2012;6(2):80-92.
CrossRef - Wong K, Zhang H, Paddon A. KRAS oncogene: from discovery to therapeutic targeting. Cancer Treat Rev. 2023;108:102399.
- Pérez-Mancera PA, Tuveson DA. Physiological analysis of oncogenic K-ras. Methods Enzymol. 2006;407:676-690.
CrossRef - McPhillips F, Mullen P, MacLeod KG. Raf-1 is the predominant Raf isoform that mediates growth factor-stimulated growth in ovarian cancer cells. Carcinogenesis. 2006;27(4):729-739.
CrossRef


