
Manuscript accepted on :11-06-2024
Published online on: 05-09-2024
Plagiarism Check: Yes
Reviewed by: Dr. Anjaneyulu V
Second Review by: Dr. Ankur Kumar Arya
Final Approval by: Dr. Patorn Promchai
Thabiso Katlego Teffo1* , Shalini Dukhan1, Phillemon Ramalepe2 and Ida Risenga1
1School of Animal, Plant and Environmental Sciences, University of the Witwatersrand, Johannesburg, South Africa
2WITS School of Education, University of the Witwatersrand, Johannesburg, South Africa
Corresponding author email:katlegoteffo6@gmail.com
DOI : https://dx.doi.org/10.13005/bpj/2975
Abstract
The secondary metabolism in medicinal plants are responsible for their protection against environmental factors and the health-promoting benefits they provide to users. The purpose of this study was to assess the responses of the secondary metabolic system of B. natalensis and its influence on the antioxidant and antibacterial activities. The phytochemical analyses, antioxidant and antibacterial assays were conducted from using harvested leaves, underground stems and roots from whole plants exposed to simultaneous elevated CO2 and temperatures over eight days in a heatwave simulation. Most of the phytochemical groups were present in the leaves, however majority of the tested compounds had consistent presence throughout the plants in all treatments. The underground stems possessed a greater total phenolic, tannin and proanthocyanidin contents than the leaves and roots under elevated CO2 and temperatures. The leaves had a comparatively better antioxidant activity from the treatment than control. Overall, there was consistency in the antibacterial activity in both control and experimental conditions. The tannins and phenolics had greater concentrations throughout the plants under elevated conditions overall, which could indicate their leading role in plant defence and the improvement and maintenance of the medicinal activity of B. natalensis. The responses of the plant parts of B. natalensis under elevated CO2 and temperatures provides newfound insights on the physiological roles plant organs play on the overall productivity and medicinal activity of the species.
Keywords
Antibacterial; Antioxidant; Bulbine; Climate change: Physiology; Secondary metabolites
Download this article as:| Copy the following to cite this article: Teffo T. K, Dukhan S, Ramalepe P, Risenga I. Evaluation of the Secondary Metabolites and Bioactivity of South African Bulbine Natalensis Under Simultaneous Elevated Carbon Dioxide and Temperatures. Biomed Pharmacol J 2024;17(3). |
| Copy the following to cite this URL: Teffo T. K, Dukhan S, Ramalepe P, Risenga I. Evaluation of the Secondary Metabolites and Bioactivity of South African Bulbine Natalensis Under Simultaneous Elevated Carbon Dioxide and Temperatures. Biomed Pharmacol J 2024;17(3). Available from: https://bit.ly/3ATN89W |
Introduction
Increased atmospheric CO2 drives the increase in temperature, which could have adverse effects on plant growth and productivity.1 The latest recorded concentration of atmospheric CO2 was just above 410 parts per million (ppm).2 Temperatures, particularly in South Africa, are predicted to increase between 3 and 6 ˚C over the next seven decades, with some parts of the country experiencing summer temperatures above 45 ˚C.3 Environmental changes like this could negatively impact the bioactivity of medicinal plants. Bulbine natalensis is a broad-leaved succulent medicinal plant indigenous to South Africa, and is commonly used for the treating skin ailments such as wounds, scars and ringworms, blood related disorders, diabetes and aids in fertility issues.4 These properties owe to the presence of secondary metabolite compounds, which are derivatives of primary metabolites. They play an important physiological role in all plants, such as their involvement as defence mechanisms against both abiotic and biotic environmental factors.5, 6 Secondary metabolites are also responsible for their pharmaceutical properties, hence why medicinal plants have been used for the treatments of a variety of illnesses and diseases.6, 7 The phyto-pharmacological properties of B. natalensis has been reported in previous studies, however, the focus was mainly on the leaves, with limited studies reported on the underground stems and roots.8, 9 In addition, there is an increasing trend in the research on climate change impacts on medicinal plants, which can provide valuable information on how these plants would adapt to the evolving climate, and how their medicinal properties would be affected as a result. Currently, the inclusion of abiotic stress impacts in medicinal plant research in South Africa is limited. Hence the aim of this study was to evaluate the secondary metabolic responses of B. natalensis and their effect on the species’ antioxidant and antibacterial activities under simultaneous exposure to elevated CO2 and high temperatures.
Materials and Methods
Experimental design
Matured B. natalensis plants (n = 85) were purchased from the Witkoppen Nursery in Randburg, Gauteng Province in February (summer). All of the plants were left to acclimatize for one month, and maintained in the rooftop greenhouse at the University of the Witwatersrand, Johannesburg. The plants were then transferred into three climate simulation chambers (Conviron®), each with different simulations as follows: control chamber (400 ppm CO₂ and 27/25 °C day/night temperatures- ambient) and experiment chambers (600 ppm and 800 ppm, each paired with temperature ranges of 40/30 °C and 45/35 °C day/night temperatures respectively). In addition, all plants were exposed to these conditions for up to 192 hours (eight days), to simulate the predicted average duration of a heat wave in South Africa. Five pots of B. natalensis were harvested at 48-hour intervals: 48, 96, 144, and 192 hours respectively. Following each harvest, the plant parts were taken to the laboratory, where they were rinsed with distilled water, and placed in a hot-air drier for up to four days at set at 40 ˚C. The dried samples were ground into fine powder using an electric grinder. The powdered samples were then stored at room temperature in a dark cabinet awaiting extraction.
Preparation of methanol extracts
Powdered samples of B. natalensis plant parts (3 g) were each added into autoclave bottles containing 25 ml of 80% methanol (MeOH). Once mixed, the extracts were sonicated for 25 minutes in a water bath set at 50 ˚C, in which 20 ml of 80% acetone was added. Following sonication, the extracts were centrifuged for 10 minutes at 3500 rotations per minute (rpm).10, 11
Qualitative screening of phytocompounds
Preliminary screening of phytochemical compound groups were investigated using several test methods. 12-17 The phytocompounds of interest for this study were phenolics, saponins, volatile oils, terpenoids, steroids, tannins, flavonoids, glycosides, coumarins and phlobatannins.
Quantification of phytochemical content
The quantification of the phytochemical content was determined using ultraviolet spectrophotometry technique.
Total phenolic content (TPC)
A Folin-Ciocalteu solution (750 μL- 1:10) mixed with a volume of 2.5 ml saturated sodium carbonate (Na2CO3) and 0.3 ml of the plant extracts were prepared in volumetric flasks, followed by 7 ml of distilled water to dilute the mixtures.11 All vials were incubated in a dark cabinet for a period of two hours at ambient temperature, and the absorbance of the mixtures were recorded at a wavelength of 765 nm, following incubation. A gallic acid calibration curve equation (y = 0.0495 – 0.0259, r2= 0.9994) was used to determine the total phenolic content of all extracts.
Total flavonoid content (TFC)
Methanol extracts (300 μL) of B. natalensis were added into 10 ml volumetric flasks, followed by 4 ml of distilled water and 300 μL of sodium nitrate (NaNO3) solution. The mixtures in the flasks were left to settle for five minutes before aluminium chloride solution (3 ml) was added, followed by another six minute waiting period before adding 1 M of sodium chloride (NaOH- 2 ml). All mixtures were then made up to 10 ml with distilled water.10, 11 Each flask was vortexed for 15 minutes before recording the absorbance at a wavelength of 510 nm.18 The total flavonoid content of the extracts were then quantified using the quercetin calibration curve equation, y = 0.2388 – 0.0019, r2 = 0.9997.
Total tannin content (TTC)
B. natalensis extracts (100 μL) were mixed with 7.5 ml of distilled water and 0.5 ml of Folin-Ciocalteu reagent in glass vials. A solution of 35% Na2CO3 was then added into each vial before filling them up to 10 ml with distilled water. The mixtures were vortexed and incubated for 30 minutes at ambient temperature, and then the absorbance of the extracts were recorded at a wavelength of 725 nm. The gallic acid calibration curve equation (y = 0.046x – 0.0264, r2 = 0.9833) was used to quantify the total tannin content of the extracts.19
Total proanthocyanidin content (TPAC)
Methanol extracts (500 μL) mixed with 3 ml of 4% vanillin-methanol solution and 1.5 ml of HCl were added into vials, and then vortexed before incubating for 15 minutes at ambient temperature. A wavelength of 500 nm was used to record the absorbance of the extracts, and the standard catechin calibration curve equation (y = 0.9554x + 0.0003, r2 = 0.9927) was used to calculate the total proanthocyanidin content.20
Ultra-violet spectrophotometry assessment of the in-vitro antioxidant activity
DPPH radical quenching assay
The 2, 2 diphenylpicryhydrazyl antioxidant assay was followed for this experiment, with some alterations to the adopted methodology.21 A stock solution of DPPH was prepared from 50 mg of DPPH powder and 80% methanol (100 ml), from which a work solution (1:5) was made using the stock solution and 80% methanol. Reaction mixtures consisting of 10-50 μL of the methanol extracts were mixed with 0.7 ml of the work solution and filled up to 1 ml using 80% methanol. The solutions were incubated in a cabinet for 45 minutes to avoid any interference with light before measuring the absorbance at a wavelength of 517 nm. A blank solution (80% methanol) as well as a control solution (work solution and 80% methanol) were used, and a % inhibition was obtained using the equation: scavenging (%) = [(Absample – Abblank)/Abcontrol] × 100.
Hydrogen peroxide scavenging assay
The assessment of the hydrogen peroxide scavenging potential of B. natalensis under elevated CO2 and temperatures was performed for this study.22 A hydrogen peroxide solution (40 mM) containing phosphate buffer (pH 7.4) and 30% hydrogen peroxide was prepared. The extracts (10-50 μL) were mixed with 0.6 ml of hydrogen peroxide solution (40 mM), and then incubated for 10 minutes in a dark cabinet. The absorbance of the solutions were measured at a wavelength of 230 nm. Blank (phosphate buffer) and positive control (phosphate buffer and 40 mM hydrogen peroxide) solutions were used for the analysis of the scavenging activity using the equation % scavenged H2O2 = [(Ac – As)/Ac] × 100, where Ac represents the positive control solution, and As represents the plant extract solution mixed with hydrogen peroxide.
Iron chelating assay
Few alterations were made to the method used for the investigation of the iron chelating activity of B. natalensis.23 Solution mixtures were prepared using plant extracts (10-50 μL) and a solution of 2 mM ferric (II) chloride (50 μL). A volume of 0.2 ml of ferrozine (5 mM) was then added to initiate a reaction. The solution mixtures were vortexed and left to stand for 10 minutes at room temperature. A blank solution consisting of 80% methanol and a positive control containing ferric (II) chloride and ferrozine were used as part of the analysis. The absorbance of the solutions were measured at 562 nm, and the % chelation was obtained using the equation: % chelation = [(A0 – A1)/A0] × 100, with A0 being the absorbance value of the positive control solution and A1 representing the extract samples.
Qualitative antibacterial activity assay
Culture preparations
Gram-positive Staphylococcus aureus (ATCC 25923) and Gram-negative Escherichia coli (ATCC 25922) were grown in Baird-Parker and Muller-Hinton agar, respectively. Both microbial cultures and agar were purchased from Thermo-Fisher Laboratory Specialties (Pty) Ltd.
Agar-well diffusion assay
A slightly modified method for the agar-well diffusion assay was followed to assess the qualitative antibacterial activity of B. natalensis.24, 25 Culture plates were placed in an incubator for 24 hours at 37 ˚C to allow the microbes to grow successfully. Following the incubation, a sterile borer was used to make wells (six millimetres in diameter) in the agar, and then the plant extracts, as well as a negative control (dimethyl sulfoxide) were added into the wells. The agar plates were refrigerated for one hour for sufficient diffusion of the extracts and the negative control into the agar. The plates were incubated once again for another 24 hours in order to determine the growth inhibitory activity of the extracts. A zone of inhibition, which is a value indicating the extract’s antibacterial activity, was obtained using Vernier callipers and measured in millimetres.
Data analysis
Three replicates were performed for the quantitative phytochemical, antioxidant, and antibacterial activity analyses, and all values were expressed as mean ± standard error (SE). A one-way analysis of variance (ANOVA) and Tukey HSD post-hoc tests were performed to determine the overall significance across all plant parts (p < 0.05) and where the difference lies amongst the plant parts using R Studio® statistical software.
Results
Phytochemical analysis
Qualitative screening of phytocompounds
Leaves
Eight out of 10 compound groups were detected in the control leaf extract of B. natalensis, from which phenolics, tannins, and coumarins had the highest presence. In selective elevated CO2 and high temperature treatments, coumarins, tannins, steroids and phenolics showed a higher presence of the respective compounds, although there was no difference when compared to the control with regards to phenolics, tannins and coumarins. About 70% of the phytochemical compounds were present in all treatments, including the control, whereas saponins were only present at 800ppm & 40/30 ˚C after the 48-hour harvest.
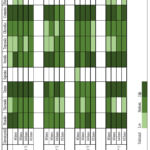 |
Figure 1: Qualitative screening of phytocompounds in B. natalensis leaves under simultaneous elevated CO2 and temperatures. |
Underground stems
Four compound groups, namely saponins, steroids, terpenoids and glycosides, were noted in the control underground stem extract. Phlobatannins were the only phytochemical group to show a high presence at 600ppm & 45/35 ˚C (192 hours), 800ppm & 40/30 ˚C (144 hours and 192 hours) and 800ppm & 45/35 ˚C (48 hours) treatments, respectively. Saponins and terpenoids were the only compounds to maintain consistency in all treatments. Contrastingly, both coumarins and volatile oils were undetected in the underground stems.
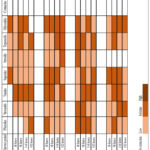 |
Figure 2: Qualitative screening of phytocompounds in B. natalensis underground stems under simultaneous elevated CO2 and temperatures. |
Roots
In the control root extract of B. natalensis, half of the tested phytochemical groups were present. Similar to the underground stems, only one group was reported to have a higher presence. However, in the case of the roots, it was saponins, in three separate treatments: 600ppm & 45/35 ˚C (48 hours), 800ppm & 40/30 ˚C (192 hours) and 800ppm & 45/35 ˚C (48 hours and 96 hours) respectively. Five compound groups retained a consistent presence whereas coumarins and volatile oils were not detected.
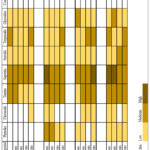 |
Figure 3: Qualitative screening of phytocompounds in B. natalensis roots under simultaneous elevated CO2 and temperatures. |
Quantitative analysis
Total phenolic content
The TPC of B. natalensis leaves showed a progressive increase between the control (867.0 ± 64.50 mg/100g GAE) and 96 hours (1883.1 ± 102.43 mg/100g GAE). A decrease was noted at 144 hours, which then slightly increased at 192 hours. The control had a significantly lower (p < 0.05) TPC than the leaves harvested under 600ppm & 40/30 ˚C (Figure 4A). The concentration of total phenolics in the underground stems decreased from the control (1909.2 ± 4.80 mg/100g GAE) up to 144 hours (p < 0.05), followed by an increase, with the highest recorded concentration under 600ppm & 40/30 ˚C at 192 hours (1833.3 ± 35.16 mg/100g GAE). The highest TPC from the root samples under elevated conditions was reported at 48 hours (3718.9 ± 42.49 mg/100g GAE), which was almost quadruple the concentration of the control (1002.8 ± 24.7 mg/100g GAE). In decreasing order follows the 144-hour, 96-hour and 192-hour harvest periods, and lastly, the control (p < 0.05). The roots had greater TPC than the leaves and underground stems under 600ppm & 40/30 ˚C.
The greatest significance was noted at 144 hours, with a TPC of 1960.8 ± 6.74 mg/100g GAE (p < 0.05) in the leaves harvested under 600ppm & 45/35 ˚C, which was followed by 192 hours, 48 hours, 96 hours, and the control (Figure 4B). The TPC in the underground stems had doubled at 48 hours (3910.4 ± 6.73 mg/100g GAE) from the control. The highest content was recorded at 144 hours (4725.3 ± 23.33 mg/100g GAE; p < 0.05), following a decrease at 96 hours. The TPC then decreased from 144 hours to 192 hours. The same pattern was observed from the TPC in the leaves. The greatest decrease in TPC in the roots was reported at 96 hours (1896.9 ± 11.66 mg/100g GAE), which was three times lower in concentration compared to 48 hours (3668.0 ± 26.94 mg/100g GAE). The TPC slightly decreased at 192 hours following a gradual increase between 96 and 144 hours. Overall, the control was significantly different to all samples harvested under elevated conditions (p < 0.05). All three plant parts had greater concentrations under 600ppm & 45/35 ˚C compared to their respective controls.
A concentration of 2314.4 ± 17.75 mg/100g GAE was the highest recorded at 48 hours from the leaves harvested under 800pm & 40/30 ˚C (p < 0.05), which decreased at 96 hours (Figure 4C). The TPC increased again at 144 hours before decreasing at 192 hours. The greatest significance was recorded after 96 hours, with a TPC of 6294.3 ± 26.94 mg/100g GAE (p < 0.05) from the underground stems. This was followed by 48 hours, 144 hours, 192 hours, and the control, which had the lowest TPC by comparison. In the roots, the TPC had doubled from the control to 48 hours, with a concentration of 2442.4 ± 151.63 mg/100g GAE, which then decreased from 96 hours to 144 hours. The highest TPC came from the roots harvested at 192 hours (3890.2 ± 84.38 mg/100g GAE; p < 0.05). The underground stems had higher TPC between 48 and 144 hours, compared to the leaves and roots. The roots contained a comparatively higher concentration of total phenolics, followed by the underground stems and the leaves at 192 hours.
The TPC in the leaves saw a noticeable increase from the control to 144 hours (1312.9 ± 32.04 mg/100g GAE; p < 0.05), and then decreased at 192 hours (Figure 4D). A huge increase in total phenolics in the underground stems was reported at 48 hours (5499.7 ± 6.73 mg/100g GAE) with the next highest value at 144 hours, followed by 192 hours, 96 hours and the control (p < 0.05). The TPC in the roots under 800ppm & 45/35 ˚C, at first, increased from 48 to 96 hours (2422.2 ± 23.33 mg/100g GAE; p < 0.05), then decreased from 144 hours to 192 hours. The underground stems possessed greater TPC than the leaves and roots in all harvest periods under 800ppm & 45/35 ˚C. Although the leaves and roots were the only plant parts to have higher TPC in each concurrent elevated CO2 and high temperature treatment in contrast to their controls, the underground stems had an overall higher TPC.
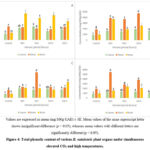 |
Figure 4: Total phenolic content of various B. natalensis plant organs under simultaneous elevated CO2 and high temperatures. |
Total flavonoid content
An increase in the TFC was noticed at 48 hours (358.9 ± 51.17 mg/100g QE) from the control (134.4 ± 21.40 mg/100g QE). The concentration slightly decreased at 96 hours, and then increased again at 144 hours, before doubling down at 192 hours (172.8 ± 15.17 mg/100g QE). An overall significant difference was noted for the leaves under 600ppm & 40/30 ˚C against the control (p < 0.05; Figure 5A). The TFC in the underground stems at 192 hours was slightly higher (265.0 ± 3.33 mg/100g QE) in comparison to the control (259.7 ± 8.18 mg/100g QE). The three preceding harvest periods under 600ppm & 40/30 ˚C were lower in TFC by comparison. Only the stems harvested at 48 and 144 hours were significantly different to the control (p < 0.05). The concentration of total flavonoids in the roots increased between the control (238.3 ± 43.40 mg/100g QE) and 96 hours (897.5 ± 24.75 mg/100g QE; p < 0.05). At 144 hours, the TFC took a great fall (285.6 ± 5.37 mg/100g QE; p < 0.05) which then increased at 192 hours. The leaves and roots alternated in terms of the TFC, with the leaves having a greater content at 48 and 144 hours, and the roots at 96 and 192 hours respectively. They were also the only plant parts to contain higher TFC than their respective controls.
The leaves had a slight decrease in TFC at 48 hours (130.8 ± 5.83 mg/100g QE) from the control, before increasing at 96 hours (268.3 ± 23.12 mg/100g QE; p < 0.05; Figure 5B). A moderate decrease was noted at 144 hours (p < 0.05), which was followed by another increase at 192 hours. A similar trend was observed in the underground stems, where a fluctuation in the TFC was reported. A drop in concentration from the control to 48 hours was noted (p < 0.05), which increased to its highest content at 96 hours (232.2 ± 1.11 mg/100g QE). The TFC decreased at 144 hours before increasing, however indifferently, at 192 hours. The greatest difference in the TFC of the roots was recorded at 144 hours, with a concentration of 423.9 ± 3.13 mg/100g QE, (p < 0.05) followed by the control, 192 hours, 48 hours, and 96 hours. Under 600ppm & 45/35 ˚C, the leaves showed comparatively higher TFC at 96 and 192 hours. The underground stems and roots each had higher concentrations at 48 and 144 hours respectively.
A significant increase in total flavonoids under 800ppm & 40/30 ˚C at 48 hours was reported in the leaves, which gradually increased all the way to 192 hours, with the highest recorded concentration of 501.3 ± 40.29 mg/100g QE in the leaves (Figure 5C). The control was significantly different to the harvested samples under treatment (p < 0.05). Compared to the leaves, B. natalensis underground stems displayed an inverse pattern in TFC. The greatest concentration was reported at 48 hours (607.8 ± 12.75 mg/100g QE), showing a great increase from the control. The TFC then took a downturn from 96 hours to 192 hours (356.7 ± 26.94 mg/100g QE). The control had the lowest TFC compared to each harvested sample from this treatment. Furthermore, a significant difference was reported between 48 and 144 hours against the control (p < 0.05). The highest concentration of total flavonoids in the roots was reported at 96 hours (232.9 ± 24.29 mg/100g QE) followed by 48 hours, 192 hours and 144 hours, under 800ppm & 40/30 ˚C. All the above mentioned concentrations had lower TFC than the control. In the last three harvest periods (96 to 192 hours), the leaves contained greater TFC than the underground stems and roots.
About 75% of the methanol leaf extracts of B. natalensis were reported to have higher TFC under elevated CO2 and high temperatures (800ppm & 45/35 ˚C; p < 0.05), in contrast to the control, namely at 48 hours, 96 hours, and the highest at 192 hours (462.2 ± 15.76 ng/100g QE; Figure 5D). The TFC in the underground stems showed a recurrent increase form the control to 96 hours (533.9 ± 5.47 mg/100g QE; p < 0.05). The concentration moderately decreased at 144 hours and elevated again at 192 hours (p < 0.05). The roots recorded the most significant increase in the concentration of total flavonoids at 48 hours (388.1 ± 6.46 mg/100g QE; p < 0.05) followed by 192 hours, 144 hours and 96 hours. Similar to the underground stems, the control had the lowest TFC compared to the samples harvested under 800ppm & 45/35 ˚C. The plants exposed to 800ppm & 45/35 ˚C showed the underground stems to have the highest TFC between 96 and 192 hours, compared to the leaves and roots. The leaves, however, yielded a higher TFC at 48 hours.
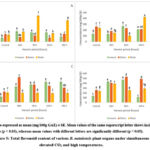 |
Figure 5: Total flavonoid content of various B. natalensis plant organs under simultaneous elevated CO2 and high temperatures. |
Total tannin content
The highest concentration of total tannins in the leaves was recorded at 48 hours under 600ppm & 40/30 ˚C (3228.62 ± 1.81 mg/100g GAE; p < 0.05). This was followed by the control, with a slightly lower concentration (3008.3 ± 38.50 mg/100g GAE), 192 hours, 144 hours, and 96 hours (Figure 6A). B. natalensis underground stems showed an increasing pattern in the TTC from the control (2890.0 ± 53.10 mg/100g GAE) to 192 hours (6958.69 ± 21.97 mg/100g GAE). Each of the samples harvested under elevated conditions were significantly different against the control (p < 0.05). Overall, the roots showed consistency in TTC, with slight increases and decreases under elevated CO2 and high temperatures. The concentration was highest at 96 hours (5480.43 ± 6.27 mg/100g GAE; p < 0.05), followed by 48 hours, 192 hours, 144 hours, and the control (1645.0 ± 34.50 mg/100g GAE). The underground stems and roots were higher in TTC under elevated conditions compared to the leaves. Contrastingly, the leaves did have a greater content in the control.
A steady increase was noted in the TTC in the leaves between 48 and 144 hours, with the latter having the greatest concentration (2808.33 ± 9.06 mg/100g GAE). The control, however, was significantly higher (p < 0.05; Figure 6B) in TTC than every sample that was exposed to 600ppm & 45/35 ˚C. The TTC in the underground stems continued to increase from the control to 192 hours, where a concentration of 7199.64 ± 17.28 mg/100g GAE was recorded (p < 0.05). The concentration of TTC in the roots nearly quadrupled in concentration at 48 hours (5946.02 ± 4.79 mg/100g GAE; p < 0.05) from the control. Some consistency was noted between 96 and 192 hours, as the concentrations slightly differed between 100 and 250 mg/100g GAE (ANOVA; Tukey). B. natalensis underground stems had greater TTC in 75% of the harvest periods (96 to 192 hours) than the roots and leaves.
A concentration of 2672.46 ± 172.13 mg/100g GAE of total tannins was recorded after the 96-hour harvest of B. natalensis leaves. All of the samples harvested under 800ppm & 40/30 ˚C had significantly lower TTC than the control (p < 0.05; Figure 6C). The TTC in the underground stems gradually declined from 48 hours (6647.10 ± 7.89 mg/100g GAE) to 192 hours. The concentrations between 48 and 144 hours had at least twice the concentration of the control (p < 0.05). A similar pattern as in the underground stems was observed from the TTC in the roots. The concentration steadily decreased from 48 hours (5686.67 ± 6.03 mg/100g GAE) to 192 hours (p < 0.05). Overall, B. natalensis underground stems and roots both had greater TTC compared to the leaves.
The highest concentration recorded, compared to all other elevated CO2 and high temperature treatments was reported in the leaves at 48 hours, under 800ppm & 45/35 ˚C (4642.03 ± 38.34 mg/100g GAE; p < 0.05; Figure 6D). The TTC decreased from 96 to 192 hours. Only the first two harvest periods showed greater tannin content than the control. Following each harvest period, there was an increase in the TTC in the underground stems (p < 0.05), with the highest concentration recorded at 192 hours (8333.69 ± 3.14 mg/100g GAE). There were slight differences in the TTC in the roots, showing consistency in the concentrations throughout this treatment. The roots had higher content at 96 hours (3313.77 ± 26.68 mg/100g GAE) followed by 48 hours, 144 hours, and 192 hours. In comparison to the control, the roots under treatment had greater TTC (p < 0.05). The underground stems contained greater concentrations of total tannins than the other plant organs.
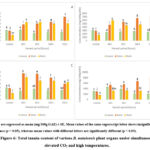 |
Figure 6: Total tannin content of various B. natalensis plant organs under simultaneous elevated CO2 and high temperatures. |
Total proanthocyanidin content
The concentration of total proanthocyanidins in B. natalensis leaves had increased from 48 hours to 96 hours (294.9 ± 0.32 mg/100g CE), which then decreased in the last two harvest periods (Figure 7A). The control (362. 3 ± 9.50 mg/100g CE) was significantly higher (p < 0.05) in TPAC than the leaves under 600ppm & 40/30 ˚C. A significantly higher concentration of total proanthocyanidins in the underground stems was reported at 192 hours (864.1 ± 34.27 mg/100g CE, p < 0.05) in comparison to the control (858.3 ± 1.70 mg/100g CE). The underground stems harvested between 48 and 144 hours were lower in TPAC than the control. The TPAC in the roots at 48 hours (462.2 ± 0.23 mg/100g CE) was the only harvest period that showed higher content than the control (373.3 ± 9.50 mg/100g CE) (p < 0.05). Overall, the results showed that the underground plant parts contained greater TPAC than the leaves.
A continual decrease in the concentration of total proanthocyanidins was observed in the leaves under 600ppm & 45/35 ˚C from 48 hours to 192 hours (Figure 7B). The control was significantly higher in TPAC compared to the leaves exposed to elevated CO2 and high temperatures (p < 0.05). The TPAC increased between 48 and 144 hours (940.4 ± 2.48 mg/100g CE) in the underground stems. The control was higher in content in contrast to 48 hours, 96 hours, and 192 hours (p < 0.05). The roots displayed greater concentrations of total proanthocyanidins at 192 hours (573.3 ± 0.85 mg/100g CE; p < 0.05), followed by the 48 hours, 96 hours, the control, and 144 hours. The leaves were lower in TPAC in this treatment compared to the species’ underground plant parts.
Although a concentration of 307.9 ± 0.76 mg/100g CE was reported at 144 hours and was subsequently the highest TPAC in the leaves under 800ppm & 40/30 ˚C, the control was still significantly higher in content overall (p < 0.05; Figure 7C). The TPAC in the underground stems continued to increase from 48 to 144 hours (776.1 ± 0.78 mg/100g CE) until it decreased at 192 hours, by almost half the concentration of the previous harvest period. The control, however, remained the highest in TPAC by comparison (p < 0.05). At least 75% of the harvested roots showed greater TPAC, at 192 hours (870.6 ± 1.13 mg/100g CE), 96 hours and 144 hours, than the control (p < 0.05). The subterranean plant parts of B. natalensis contained higher concentrations of total proanthocyanidins than the leaves.
A higher TPAC was reported at 48 hours (367.1 ± 0.23 mg/100g CE; p < 0.05) with the control sample trailing closely behind, and 144 hours (Figure 7D). These were the only leaf extracts to have a concentration above 300 mg/100g CE. There was a slight decrease in the TPAC in the underground stems between the control (p < 0.05) and 48 hours (849.5 ± 0.91 mg/100g CE), which continued to 96 hours. It was from here where the concentration increased until 192 hours. The roots contained a greater TPAC at 144 hours (430.5 ± 0.46 mg/100g CE; p < 0.05), which was by comparison, higher than the control. B. natalensis underground stems displayed the highest concentration of total proanthocyanidins, followed by the roots and leaves, under 800ppm & 45/35 ˚C.
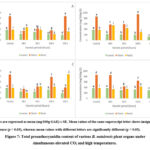 |
Figure 7: Total proanthocyanidin content of various B. natalensis plant organs under simultaneous elevated CO2 and high temperatures. |
Antioxidant activity (AA)
DPPH
B. natalensis leaves fairly reduced the production of DPPH radicals at 48, 144 and 192 hours, and a weaker activity reported at 96 hours (Table 1). All the harvested leaves under 600ppm & 40/30 ˚C had slightly higher IC50 concentrations than the control (3.88 ± 0.16 mg/ml). About half of the underground stems showed a good AA at 96 hours (3.00 ± 0.32 mg/ml) and 144 hours (3.49 ± 0.31 mg/ml) respectively. The poorest activity was reported at 48 hours, 192 hours, and the control, of which the latter displayed the weakest DPPH scavenging activity (35.86 ± 0.29 mg/ml). Most of the roots harvested under elevated CO2 and high temperatures had weaker scavenging activities, in comparison to the control, which had excellent AA (0.36 ± 0.02 mg/ml). The leaves and underground stems each had better DPPH radical quenching at 48 and 192 hours, as well as 96 and 144 hours respectively, compared to the roots. However, all three plant parts under 600ppm & 40/30 ˚C were significantly different to their respective controls (p < 0.05).
Three of the harvest periods (48, 96 and 192 hours) had lower IC50 concentrations from the leaf extracts than the control (p < 0.05; Table 1). Each of the values indicated an excellent potential to reduce DPPH radicals, especially at 48 hours (0.27 ± 0.05 mg/ml). All the underground stem extracts showed significantly greater DPPH scavenging activity than the control (p < 0.05), with values ranging between 0.24 to 0.67 mg/ml. An adequate radical quenching activity was reported from the roots. Although a good AA was recorded at 48 and 96 hours respectively, the control still exceeded their potential. Overall, the underground stems, followed by the leaves, greatly outperformed the roots in reducing DPPH radicals under 600ppm & 45/35 ˚C.
The leaves harvested at 96 and 192 hours under 800ppm & 40/30 ˚C showed excellent AA (1.64 ± 0.11 mg/ml and 0.61 ± 0.09 mg/ml respectively) compared to 48 and 144 hours, which displayed a good DPPH scavenging activity (Table 1). The control, however, was slightly weaker in activity than the leaves harvested under 800ppm & 40/30 ˚C (p < 0.05). The IC50 values of the underground stems significantly decreased from the control to 144 hours where the greatest activity was recorded (0.76 ± 0.09 mg/ml). Similar to the leaves, all of the underground stems under this treatment scavenged DPPH radicals much better than the control (p < 0.05). The strongest AA from the roots harvested under 800ppm & 40/30 ˚C, was reported at 192 hours (0.51 ± 0.05 mg/ml) which was indifferently higher in concentration than the control. A good activity was observed at 48 and 144 hours, and the weakest activity was reported at 96 hours.
The IC50 concentrations of the leaf extracts had decreased from 9.78 ± 0.44 mg/ml at 48 hours (good AA) to 1.30 ± 0.12 mg/ml at 96 hours (excellent AA) and the lowest concentration at 144 hours (0.49 ± 0.04 mg/ml; Table 1). Only the latter two harvest periods had a higher scavenging potential than the control (p < 0.05). A positive activity was observed in the underground stems, with 50% of the harvest periods exhibiting an excellent radical quenching activity (96 hours – 0.82 ± 0.07 mg/ml and 192 hours – 1.58 ± 0.17 mg/ml, respectively) while the other half had a good AA (48 and 144 hours). The roots displayed a polarizing DPPH radical scavenging activity, with a good AA reported at 48 and 144 hours, and a weak AA noted at 96 and 192 hours. All the recorded IC50 concentrations of the roots under 800ppm & 45/35 ˚C were significantly higher than the control (p < 0.05). The greatest radical scavenging activity was found to come from the underground stems, specifically at 48, 96 and 192 hours.
Table 1: The DPPH scavenging potential of B. natalensis exposed to simultaneous elevated CO2 and temperatures.
|
Treatment |
Harvest period |
Leaves |
Underground stems |
Roots |
|
Control |
3.87d ± 0.16 |
35.86a ± 0.29 |
0.36e ± 0.02 |
|
|
600ppm & 40/30 ˚C |
48 h |
5.50c ± 0.27 |
22.4b ± 0.23 |
11.41c ± 0.32 |
|
96 h |
13.74a ± 0.32 |
3.00c ± 0.33 |
8.65d ± 0.17 |
|
|
144 h |
9.11b ± 0.20 |
3.49c ± 0.31 |
38.15a ± 0.40 |
|
|
192 h |
6.18c ± 0.21 |
22.89b ± 0.44 |
13.49b ± 0.49 |
|
|
Control |
3.87b ± 0.16 |
35.86a ± 0.29 |
0.36e ± 0.02 |
|
|
600ppm & 45/35 ˚C |
48 h |
0.27b ± 0.05 |
0.51b ± 0.06 |
2.89d ± 0.42 |
|
96 h |
1.77c ± 0.13 |
0.67b ± 0.06 |
7.09c ± 0.35 |
|
|
144 h |
25.42a ± 0.06 |
0.42b ± 0.03 |
16.5b ± 0.37 |
|
|
192 h |
1.91c ± 0.29 |
0.24b ± 0.01 |
20.5a ± 0.42 |
|
|
Control |
3.87a ± 0.16 |
35.86a ± 0.29 |
0.36d ± 0.02 |
|
|
800ppm & 40/30 ˚C |
48 h |
2.39b ± 0.12 |
11.95b ± 0.41 |
3.77b ± 0.55 |
|
96 h |
1.64c ± 0.11 |
3.13d ± 0.44 |
29.99a ± 0.19 |
|
|
144 h |
2.55b ± 0.12 |
0.76e ± 0.09 |
2.29c ± 0.33 |
|
|
192 h |
0.61d ± 0.09 |
5.17c ± 0.85 |
0.51cd ± 0.05 |
|
|
Control |
3.87c ± 0.16 |
35.86a ± 0.29 |
0.36e ± 0.02 |
|
|
800ppm & 45/35 ˚C |
48 h |
9.78b ± 0.44 |
2.86c ± 0.44 |
3.13d ± 0.35 |
|
96 h |
1.30d ± 0.12 |
0.82d ± 0.07 |
20.14b ± 0.24 |
|
|
144 h |
0.49d ± 0.04 |
7.24b ± 0.22 |
8.35c ± 0.23 |
|
|
192 h |
27.14a ± 0.35 |
1.58cd ± 0.17 |
24.55a ± 0.20 |
Values are expressed as mean (mg/ml) ± SE. Mean values of different superscript letters in the same column indicates significance (p < 0.05).
Hydrogen peroxide
Of the three harvest periods where an excellent H2O2reducing power was reported in the leaves under 600ppm & 40/30 ˚C (IC50 values lower than 1 mg/ml) namely at 48, 96 and 192 hours, the latter two had the strongest activity (0.19 ± 0.04 mg/ml and 0.18 ± 0.04 mg/ml respectively; Table 2). The control, however, had the greatest scavenging power (p < 0.05). A gradual decrease in the IC50 concentrations of the underground stems was observed from the control (0.61 ± 0.05 mg/ml) to 144 hours (0.22 ± 0.03 mg/ml; p < 0.05), indicating greater AA compared to the stems harvested at 192 hours. The roots showed an excellent (96 and 192 hours) to good (48 and 144 hours) H2O2scavenging activity under 600ppm & 40/30 ˚C, however, none of these were stronger at hydroxyl ion reduction than the control (0.24 ± 0.04 mg/ml). The leaves and underground stems both had scavenged H2O2ions much better than the roots.
Although each of the harvested leaves under 600ppm & 45/35 ˚C had excellent activity, with the greatest H2O2quenching reported at 48 hours (0.46 ± 0.14 mg/ml), the control still showed a slight but significantly stronger AA (Table 2). The underground stems had a fairly good AA. The scavenging potential was better at 96 and 192 hours, where IC50 values were lower (0.36 ± 0.02 mg/ml and 1.17 mg/ml respectively). All the root extracts displayed excellent H2O2radical scavenging activity, with the IC50 values being lower than 1 mg/ml. The roots harvested after 144 hours had the strongest AA with an IC50 concentration of 0.15 ± 0.03 mg/ml.
A slightly stronger AA in the leaves was discovered at 96 hours (0.25 ± 0.03 mg/ml), followed by 192 hours and 48 hours under 800ppm 40/30 ˚C, of which both had higher IC50 concentrations than the control (Table 2). A comparatively weaker, but good AA was reported at 144 hours. The AA in the underground stems greatly improved from 48 hours to 192 hours under elevated CO2 and high temperature conditions. This was evident from the continual decrease in the IC50 concentrations, with a better scavenging power recorded at 144 hours (0.41 ± 0.02 mg/ml) and 192 hours (0.17 ± 0.04 mg/ml) respectively. An excellent H2O2 radical scavenging activity was reported in all root extracts. The greatest activity was noted at 96 hours (0.44 ± 0.03 mg/ml), which is approximately double the concentration of the control. All plant parts had excellent H2O2scavenging activity at 96 and 192 hours. The ANOVA results showed that only the leaves showed an overall significant difference (p < 0.05), whereas the underground stems and roots were insignificant.
The leaves had a great H2O2 reducing power in all harvest periods from the 800ppm & 45/35 ˚C, with the IC50 concentrations being lower than 1 mg/ml (Table 2). Although there was no significant difference between the concentrations recorded for each harvest period and the control, the latter had the lowest concentration. A much better scavenging activity from the underground stems was reported at 96 (0.10 ± 0.02 mg/ml) and 144 hours (0.15 ± 0.01 mg/ml) in comparison to the control (p < 0.05), 48 hours and 192 hours, which the latter had a good activity. The roots showed a similar trend in the excellent scavenging potential against H2O2 radicals as leaves, however in contrast, the roots slightly reduced the production of radicals better than the leaves. Only two harvest periods had lower IC50 concentrations, particularly at 144 hours (0.18 ± 0.04 mg/ml) and 192 hours (0.21 ± 0.03 mg/ml) than the control. Both the underground stems and roots showed stronger H2O2scavenging activity than the leaves at 96 and 144 hours, as well as 48 and 192 hours respectively.
Table 2: The hydrogen peroxide radical scavenging potential of B. natalensis exposed to simultaneous elevated CO2 and temperatures.
|
Treatment |
Harvest period |
Leaves |
Underground stems |
Roots |
|
|
Control |
0.29b ± 0.05 |
0.61b ± 0.05 |
0.24b ± 0.04 |
||
|
600ppm & 40/30 ˚C |
48 h |
0.71s ± 0.05 |
0.38ab ± 0.06 |
3.24a ± 0.30 |
|
|
96 h |
0.19s ± 0.04 |
0.27b ± 0.02 |
1.36ab ± 0.10 |
||
|
144 h |
2.31s ± 0.32 |
0.22b ± 0.03 |
4.64a ± 0.65 |
||
|
192 h |
0.18s ± 0.04 |
2.94a ± 0.41 |
1.94ab ± 0.08 |
||
|
Control |
0.29b ± 0.05 |
0.61b ± 0.05 |
0.24a ± 0.04 |
||
|
600ppm & 45/35 ˚C |
48 h |
0.46ab ± 0.14 |
7.06a ± 1.08 |
0.45a ± 0.09 |
|
|
96 h |
1.16a ± 0.34 |
0.36b ± 0.02 |
0.51a ± 0.04 |
||
|
144 h |
0.62ab ± 0.06 |
2.51b ± 0.24 |
0.15a ± 0.03 |
||
|
192 h |
0.83a ± 0.07 |
1.17b ± 0.09 |
0.82a ± 0.08 |
||
|
Control |
0.29b ± 0.05 |
0.61a ± 0.05 |
0.24a ± 0.04 |
||
|
800ppm & 40/30 ˚C |
48 h |
0.78b ± 0.07 |
2.67a ± 1.92 |
1.20a ± 0.12 |
|
|
96 h |
0.25b ± 0.03 |
0.68a ± 0.05 |
0.44a ± 0.03 |
||
|
144 h |
6.94a ± 0.31 |
0.41a ± 0.02 |
0.85a ± 0.07 |
||
|
192 h |
0.77b ± 0.07 |
0.17a ± 0.04 |
0.86a ± 0.06 |
||
|
Control |
0.29a ± 0.05 |
0.61b ± 0.05 |
0.24a ± 0.04 |
||
|
800ppm & 45/35 ˚C |
48 h |
0.73a ± 0.10 |
0.72a ± 0.08 |
0.56a ± 0.09 |
|
|
96 h |
0.35a ± 0.07 |
0.10a ± 0.02 |
0.59a ± 0.06 |
||
|
144 h |
0.83a ± 0.08 |
0.15a ± 0.01 |
0.18a ± 0.04 |
||
|
192 h |
0.57d ± 0.04 |
2.82a ± 0.26 |
0.21a ± 0.03 |
||
Values are expressed as mean (mg/ml) ± SE. Mean values of different superscript letters in the same column indicates significance (p < 0.05).
Iron chelating activity
The leaves displayed a good iron chelating activity under 600ppm & 40/30 ˚C, however, the control excellently quenched the radicals in comparison (0.19 ± 0.01 mg/ml; Table 3). All the underground stem extracts yielded great iron quenching activity, with the 48 hour (0.69 ± 0.04 mg/ml) and 144 hour (0.71 ± 0.05 mg/ml) harvest periods having comparatively lower IC50 values than the control (0.89 ± 0.02 mg/ml). The roots showed the best iron radical scavenging activity compared to the underground stems and leaves. All of the IC50 values recorded under 600ppm & 40/30 ˚C were lower than 1 mg/ml. The control however, was significantly stronger (0.33 ± 0.01 mg/ml).
The lowest IC50 concentrations from the methanolic leaf extracts were reported at 96 hours (0.40 ± 0.09 mg/ml) and 144 hours (0.41 ± 0.09 mg/ml) respectively (Table 3). Overall, the leaves showed an excellent iron reducing activity. The underground stems showed the strongest reducing power at 144 hours (0.07 ± 0.02 mg/ml), followed by the 48 hours and the control. A good AA was reported at 96 and 192 hours. An overall good AA was observed for the roots, showing significantly higher IC50 concentrations than the control. Of the three plant parts, the leaves had stronger iron radical scavenging activity under 600ppm & 45/35 ˚C, followed by the underground stems and the roots.
The iron chelating activity of the leaves slowly decreased at each of the harvest periods, with the lowest IC50 concentration at 48 hours (0.36 ± 0.02 mg/ml) to the highest at 192 hours (1.63 ± 0.18 mg/ml; Table 3). At least 75% of the harvest periods showed greater iron chelating power at 48 hours (0.99 ± 0.03 mg/ml), 144 hours (1.99 ± 0.07 mg/ml) and 192 hours (0.87 ± 0.20 mg/ml) respectively for the underground stems. The roots exhibited an excellent scavenging activity between 48 hours and 144 hours. The greatest activity was reported at 96 hours (0.66 ± 0.06 mg/ml), which was moderately stronger than the control. All the plant organs displayed excellent iron chelating activity at 48 hours and 144 hours, with the harvested material from the latter period having a stronger antioxidant power.
The leaves showed the greatest iron radical reducing power at 96 hours (0.14 ± 0.02 mg/ml), followed by the control, 144 hours, 192 hours and 48 hours. Half of the underground stem extracts had more powerful iron radical quenching than the control, particularly at 48 hours (0.07 ± 0.01 mg/ml) and 144 hours (0.07 ± 0.02 mg/ml). The IC50 concentrations recorded from the root extracts decreased continually, indicating a stronger AA with each harvest period. The roots harvested at 144 and 192 hours had the best scavenging activity (0.80 ± 0.36 mg/ml and 0.80 ± 0.11 mg/ml respectively). B. natalensis was overall, significantly different (p < 0.05; ANOVA) in the metal chelating activity, however, the control was found to be significantly different to each of the harvest periods in several treatments (600ppm & 40/30 ˚C- leaves and underground stems and 600ppm & 45/35 ˚C- roots) respectively.
Table 3: The iron chelating potential of B. natalensis exposed to simultaneous elevated CO2 and temperatures.
|
Treatment |
Harvest period |
Leaves |
Underground stems |
Roots |
|
Control |
|
0.19b ± 0.01 |
0.89b ± 0.02 |
0.33b ± 0.01 |
|
600ppm & 40/30 ˚C |
48 h |
1.54a ± 0.14 |
0.69c ± 0.04 |
0.84a ± 0.10 |
|
96 h |
1.95a ± 0.17 |
1.07a ± 0.01 |
0.58ab ± 0.02 |
|
|
144 h |
2.62a ± 0.37 |
0.71c ± 0.05 |
0.74a ± 0.03 |
|
|
192 h |
2.39a ± 0.33 |
1.19a ± 0.05 |
0.83a ± 0.09 |
|
|
Control |
|
0.19b ± 0.01 |
0.89c ± 0.02 |
0.33b ± 0.01 |
|
600ppm & 45/35 ˚C |
48 h |
0.57a ± 0.03 |
0.80c ± 0.07 |
3.08a ± 0.13 |
|
96 h |
0.40ab ± 0.09 |
2.48b ± 0.21 |
3.42a ± 0.43 |
|
|
144 h |
0.41ab ± 0.09 |
0.07c ± 0.02 |
3.81a ± 0.47 |
|
|
192 h |
0.57a ± 0.02 |
4.96a ± 0.46 |
3.19a ± 0.09 |
|
|
Control |
|
0.19b ± 0.01 |
0.89b ± 0.02 |
0.33b ± 0.01 |
|
800ppm & 40/30 ˚C |
48 h |
0.36b ± 0.02 |
0.99b ± 0.03 |
1.19b ± 0.06 |
|
96 h |
0.57b ± 0.07 |
2.18a ± 0.38 |
0.66b ± 0.06 |
|
|
144 h |
1.57a ± 0.23 |
1.99a ± 0.07 |
1.36b ± 0.08 |
|
|
192 h |
1.63a ± 0.18 |
0.87b ± 0.20 |
4.69a ± 0.44 |
|
|
Control |
|
0.19b ± 0.01 |
0.89b ± 0.02 |
0.33b ± 0.01 |
|
800ppm & 45/35 ˚C |
48 h |
0.57a ± 0.02 |
0.07b ± 0.01 |
2.10a ± 0.30 |
|
96 h |
0.14b ± 0.02 |
3.62a ± 0.16 |
1.21ab ± 0.08 |
|
|
144 h |
0.50a ± 0.03 |
0.07b ± 0.02 |
0.80b ± 0.36 |
|
|
192 h |
0.55a ± 0.04 |
3.96a ± 0.37 |
0.80b ± 0.11 |
Values are expressed as mean (mg/ml) ± SE. Mean values of different superscript letters in the same column indicates significance (p < 0.05).
Antibacterial activity
600ppm and 40/30 ˚C
The harvested leaves from this treatment all displayed an intermediate antibacterial activity against S. aureus, with a range between 13 and 17 mm (Table 4). Surprisingly, the control sample did not show any inhibitory activity, indicating bacterial resistance. The underground stems also had the same activity as the leaves, but with slightly lower zones of inhibition (10-13 mm) under 600ppm & 40/30 ˚C, even with the control having a larger zone of inhibition (15.33 ± 0.67 mm; Table 4). The roots also had the same intermediate activity as the leaves and underground stems. Only the roots had insignificant under 600ppm & 40/30 ˚C against the control (p > 0.05). The control leaf extract had a greater zone of inhibition value against E. coli (18.33 ± 0.88 mm), and all harvested samples under 600ppm & 40/30 ˚C had zones of inhibition between 11 and 12 mm, also showing significance against the control (p < 0.05; Table 5). The underground stems and roots also had an intermediate activity in both control (15.33 ± 0.88 mm- underground stems; 13.33 ± 0.88 mm- roots) and 600ppm & 40/30 ˚C samples (p < 0.05; Table 5).
600ppm and 45/35 ˚C
All of the harvested plant samples under 600ppm & 45/35 ˚C showed a good antibacterial activity against S. aureus (Table 4). The leaves had stronger activity under treatment than the control, while the underground stem and root extracts had slightly larger zones of inhibition under treatment compared to the control (p < 0.05; ANOVA). An interesting pattern was noted in the antibacterial activity of the leaves under 600ppm & 45/35 ˚C against E. coli (Table 5). The activity greatly decreased between the control and 48 hours (6.00 ± 3.00 mm; p < 0.05) indicating bacterial resistance. The leaves then increased in their activity, from intermediate at 96 hours to susceptible at 144 hours (20.33 ± 1.20 mm; p < 0.05). Slight variations in the zones of inhibition of the underground stem and root extracts were reported, but both plant parts maintained a good antibacterial activity from all harvest periods under elevated CO2 and high temperatures (p < 0.05).
800ppm and 40/30 ˚C
A similar pattern was as the previous two treatments was observed in 800ppm & 40/30 ˚C, where all plant parts showed a moderate growth inhibitory effect against S. aureus (Table 4). The leaves and underground stems both displayed significance (p < 0.05), while the harvested roots were not significant to the control (p > 0.05). Each plant part showed a consistent zone of inhibition between 48 and 192 hours under 800ppm & 40/30 ˚C, showing overall significance against E. coli (p < 0.05; Table 5). The leaves had a range between 12 and 16 mm, the underground stems, being the most consistent, around 16-17 mm, and the roots, between 15-16 mm.
800ppm and 45/35 ˚C
The leaves and underground stems had small variations in the zones of inhibition. Though the leaves harvested under 800ppm & 45/35 ˚C had shown an increase in activity compared to the control, the underground stems displayed significantly smaller diameters than the control (p < 0.05). The root extracts from samples harvested at 96 (18.00 ± 0.58 mm) and 192 hours (17.67 ± 0.33 mm; p < 0.05) had greater zones of inhibition than the control. Overall, a good antibacterial activity was reported from the plant extracts (Table 4). The leaves, underground stems, and roots all displayed an intermediate antibacterial activity against E. coli under 800ppm & 45/35 ˚C (p < 0.05). The control leaf extract was found to be stronger in activity, as the zone of inhibition was higher than all the extracts from the elevated conditions. The underground stems and roots had greater zones of inhibition at 96 hours (16.67 ± 0.67 mm) and 48 hours (16.33 ± 0.33 mm) compared to their respective control (Table 5).
Table 4: The effect of simultaneous elevated CO2 and temperatures on the inhibitory activity of B. natalensis against S. aureus.
|
Treatment |
Harvest period |
Leaves |
Underground stems |
Roots |
|
Control |
N/A |
15.33a ± 0.67 |
15.67a ± 0.33 |
|
|
600ppm & 40/30 ˚C |
48 h |
13.00b ± 0.58 |
12.33b ± 0.33 |
14.33a ± 0.33 |
|
96 h |
13.33b ± 0.67 |
11.33b ± 0.88 |
13.00a ± 0.58 |
|
|
144 h |
17.33a ± 0.88 |
10.33b ± 0.33 |
11.00a ± 0.58 |
|
|
192 h |
15.33ab ± 0.33 |
12.67b ± 0.33 |
12.67a ± 1.20 |
|
|
Control |
|
N/A |
15.33a ± 0.67 |
15.67a ± 0.33 |
|
600ppm & 45/35 ˚C |
48 h |
15.67a ± 0.67 |
12.33bc ± 0.33 |
15.00a ± 0.58 |
|
96 h |
17.33a ± 0.88 |
10.67c ± 0.67 |
14.33a ± 0.33 |
|
|
144 h |
12.33b ± 0.33 |
11.67bc ± 0.33 |
12.67a ± 0.33 |
|
|
192 h |
16.33a ± 0.88 |
13.33ab ± 0.33 |
14.67a ± 0.67 |
|
|
Control |
N/A |
15.33a ± 0.67 |
15.67a ± 0.33 |
|
|
800ppm & 40/30 ˚C |
48 h |
12.00a ± 0.58 |
12.00b ± 0.58 |
13.00a ± 1.00 |
|
96 h |
11.33a ± 0.33 |
13.67a ± 0.67 |
11.67a ± 1.67 |
|
|
144 h |
10.67a ± 0.33 |
15.00a ± 0.58 |
13.33a ± 1.20 |
|
|
192 h |
10.67a ± 0.67 |
13.67a ± 0.67 |
12.00a ± 0.58 |
|
|
Control |
|
N/A |
15.33a ± 0.67 |
15.67b ± 0.33 |
|
800ppm & 45/35 ˚C |
48 h |
11.33a ± 0.67 |
10.67c ± 0.33 |
13.33b ± 0.33 |
|
96 h |
11.33a ± 0.88 |
13.33ab ± 0.88 |
18.00a ± 0.58 |
|
|
144 h |
11.33a ± 0.33 |
11.67bc ± 0.33 |
12.33b ± 0.33 |
|
|
192 h |
12.67a ± 0.88 |
11.33bc ± 0.33 |
17.67a ± 0.33 |
Values are expressed as mean (mg/ml) ± SE. Mean values of different superscript letters in the same column indicates significance (p < 0.05).
Table 5: The effect of simultaneous elevated CO2 and temperatures on the inhibitory activity of B. natalensis against E. coli.
|
Treatment |
Harvest period |
Leaves |
Underground stems |
Roots |
|
Control |
|
18.33a ± 0.88 |
15.33a ± 0.88 |
13.33ac ± 0.88 |
|
600ppm & 40/30 ˚C |
48 h |
11.67b ± 0.67 |
14.00a ± 0.58 |
12.33a ± 0.33 |
|
96 h |
11.00b ± 0.58 |
13.33a ± 0.33 |
10.33b ± 0.33 |
|
|
144 h |
11.67b ± 0.67 |
12.33a ± 0.88 |
11.33bc ± 0.33 |
|
|
192 h |
11.00b ± 0.58 |
15.33a ± 0.33 |
15.67a ± 0.33 |
|
|
Control |
|
18.33ab ± 0.88 |
15.33ab ± 0.88 |
13.33a ± 0.88 |
|
600ppm & 45/35 ˚C |
48 h |
6.00c ± 3.00 |
13.33b ± 0.33 |
12.33a ± 0.67 |
|
96 h |
16.33ab ± 0.33 |
14.33ab ± 1.20 |
15.33a ± 0.88 |
|
|
144 h |
20.33a ± 1.20 |
15.33ab ± 0.33 |
13.00a ± 0.58 |
|
|
192 h |
11.33bc ± 0.33 |
17.00a ± 0.58 |
13.33a ± 0.33 |
|
|
Control |
|
18.33a ± 0.88 |
15.33ac ± 0.88 |
13.33a ± 0.88 |
|
800ppm & 40/30 ˚C |
48 h |
14.67bc ± 0.67 |
16.33bc ± 0.33 |
16.33a ± 0.33 |
|
96 h |
16.33ab ± 0.33 |
16.67a ± 0.33 |
15.33a ± 0.67 |
|
|
144 h |
15.33ac ± 0.88 |
16.33b ± 0.33 |
15.67a ± 1.20 |
|
|
192 h |
12.67c ± 0.88 |
16.67bc ± 0.88 |
15.67a ± 0.67 |
|
|
Control |
|
18.33a ± 0.88 |
15.33ac ± 0.88 |
13.33ac ± 0.88 |
|
800ppm & 45/35 ˚C |
48 h |
14.00ab ± 0.58 |
13.33bc ± 0.33 |
16.33a ± 0.33 |
|
96 h |
15.00ab ± 1.00 |
16.67a ± 0.67 |
15.33a ± 0.67 |
|
|
144 h |
12.67b ± 0.67 |
12.33b ± 0.33 |
15.00ac ± 1.15 |
|
|
192 h |
14.00ab ± 1.53 |
13.67bc ± 0.33 |
12.33bc ± 0.88 |
Values are expressed as mean (mg/ml) ± SE. Mean values of different superscript letters in the same column indicates significance (p < 0.05).
Discussion
South Africa’s geographical location makes it extremely vulnerable to climate change due to its warm, arid conditions. It has been predicted that these conditions could worsen in coming years.26 Subsequently, the increase in CO2 could affect phytochemical biosynthesis, further impacting medicinal plant bioactivity.27 The current study aimed to assess the implications of simultaneous elevated CO2 and high temperatures on the phytochemical profile and bioactivity of B. natalensis. The qualitative screening of phytochemical compounds revealed that majority of the compounds in both control and samples from the experimental conditions were present in the leaves followed by the roots and the underground stems. The occurrence of phytocompounds having a higher presence was also the same (leaves > roots > underground stems). One possible explanation could be a result of the functional morphology of the leaves, which serve as the primary organ for photosynthesis, but also temporarily stores secondary metabolites.28 The duration of exposure to the elevated conditions could have also influenced the accumulation of phytochemicals.29, 30 It is important to note that qualitative screening of phytochemicals is merely indication of the presence of compounds, and further quantitative analyses are recommended to assess their quantity.
The concentrations of total phenolics, flavonoids, tannins and proanthocyanidins mostly increased after 48 hours when B. natalensis was exposed to various treatments of elevated CO2 and high temperatures. This response could be an adaptive strategy to the changing environmental conditions, as secondary metabolism is favoured over primary metabolism.31 An interesting discovery was that the underground stems contained the highest overall concentrations of the quantified phytochemical groups, followed by the roots. B. natalensis is a geophyte succulent, meaning it possesses a large stem or corm underground that is mainly used as a storage organ and comes in handy in situations of environmental stress.32 This reason could explain why a higher phytochemical content was reported from the underground stems. Apart from their anchoring function, roots also play a storage role in plants.33 The concentration of total tannins in B. natalensis in both control and experimental treatments was comparatively higher than the TPC, TPAC and TFC. Secondary metabolites are generally involved in plant defense against abiotic and biotic factors which in turn induces oxidative stress.34 Tannins are said to have a comparatively greater antioxidant activity than other phytochemical compounds because of their higher polymerization and molecular weight.35 Tannins also have an affinity for chelating metal ions such as iron, lead, and copper, which contributes to their pharmacological applications, especially antimicrobial activity.35-38 This possibly indicates that tannins could be the greatest contributor to the species’ adaptive strategies as well as their antioxidant and antimicrobial properties, considering their higher content under elevated CO2 and high temperatures. Tannins are further classified into two groups, namely hydrolysable tannins and condensed tannins or proanthocyanidins.39 Since the total proanthocyanidin content of B. natalensis was assessed, and results showed that their concentration was lower compared to the total tannins, this accumulation could allude that hydrolysable tannins such as ellagitannins and gallotannins are produced in greater concentrations than proanthocyanidins. Furthermore, the hydrolysable tannins could be the driving force in the defense mechanism of B. natalensis under concurrent elevated CO2 and high temperatures.
The plant antioxidant system, which consists of enzymatic and non-enzymatic antioxidants, plays a crucial role in the protection against environmental stress. Phytochemicals, which make up the non-enzymatic antioxidants, would normally accumulate as an adaptive response to environmental factors. Under various elevated CO2 and high temperature treatments, B. natalensis showed a comparatively stronger scavenging activity against hydrogen peroxide and iron radicals than DPPH. The underground stems greatly improved their DPPH scavenging activity compared to the control, whereas the leaves and roots managed to balance their potential between an excellent and a good activity. All three plant parts mostly exhibited an excellent H2O2 scavenging activity from each treatment, although, the IC50 concentrations were slightly higher than their respective controls. A similar response was noted from the iron chelating assay. Overall, the leaves were fairly better at quenching the radicals than the underground plant organs. Several reports have mentioned that the antioxidant activity varies when plants are exposed to elevated CO2 and high temperatures. Alia (2019)40 reported that the DPPH activity of Hibiscus sabdariffa var. UKMR-2 significantly increased under 800 μmol/mol compared to 400 μmol/mol. One study discovered that the ferric reducing potential (FRAP) of basil (Ocimum basilicum L.) and peppermint (Mentha piperita L.) increased under 620 ppm in comparison to the plants under 360 ppm respectively.41 Another experiment focusing on the influence of temperatures on Houttuynia cordata, found that the increase in temperature showed an increase in the total phenolic and total flavonoid contents at 35 ˚C compared to 30/25 ˚C, 25/20 ˚C, 20/15 ˚C and 15/10 ˚C respectively.42 A longer exposure to high temperatures was reported to decrease the antioxidant capacity of Heracleum sosnowskyi.43 The results showed the lowest DPPH and ABTS activities when the plants were exposed to 30 ˚C for seven days compared to a shorter period of exposure at the same temperature and 35 ˚C for two days respectively. This indicates that the variation of the antioxidant activity of B. natalensis under elevated CO2 and high temperatures could also be influenced by the period of exposure. This further shows that the species could be well prepared for the changing climate in the near future, as the antioxidant system seems to be in optimal condition. The improvement of the antioxidant activity could also result in a positive change in the medicinal properties of B. natalensis.
The underground stems and roots had a consistent antibacterial activity against S. aureus and E. coli under combined elevated CO2 and high temperatures, exhibiting a moderate activity (10-19 mm). The leaves showed a significant improvement under the experimental treatments against S. aureus, with each of the harvested material having an intermediate inhibitory activity compared to the control, which showed complete bacterial resistance. It would seem as though neither elevated CO2 and temperatures nor the duration of exposure, greatly influences the antibacterial activity of B. natalensis, except for the inhibitory activity of the leaves against S. aureus. However, the changes in the phytochemical profile and the antioxidant activity could be responsible for the consistency of the species’ antibacterial activity.
Conclusion
Climate change seems to induce unprecedented effects on the adaptability of medicinal plants. Future conditions could greatly alter the biochemical and physiological responses to elevated CO2 and temperatures, which further raises the importance of conducting environmental stress research on one of the most vulnerable classes of plants on Earth. The combined effects of elevated CO2 and temperatures on B. natalensis for this study revealed that the short-term exposure to these conditions greatly determined the overall medicinal activity at any given harvest period, from all treatments. The changes in the phytochemical profile and the antioxidant activity also provides an idea on how the species respond the harsh conditions, which further explains how their defence mechanisms react with the aim of acclimatisation and sustainability. In some of the harvest periods of the various treatments, the bioactivity showed promising improvement from the species’ antioxidative and antibacterial analyses, which gives insight on the possibility of the species to treat other conditions which have yet to be assessed. From a pharmaceutical standpoint, these results could lead to the introduction of the cultivation of the species in controlled-growth environments, where the bioactive compounds can be manipulated based on the interests of quantity in order to develop a multitude of health-promoting products that are naturally sourced, reducing the amount of synthetic products.
Acknowledgement
The authors would like to thank the University of the Witwatersrand, Johannesburg’s School of Animal, Plant and Environmental Sciences Laboratory of Medicinal Plants, for providing facilities to perform this study.
Conflict of Interest
The author(s) declares no conflict of interest.
Funding Source
Gratitude is extended to the National Research Foundation (NRF- Grant number: MND210614614611021) for their financial support in this study.
References
- Jamloki A., Bhattacharyya M., Nautiyal M. C., & Patni, B. Elucidating the relevance of high temperature and elevated CO2 in plant secondary metabolites (PSMs) production. Heliyon. 2021; 7(8).
CrossRef - Zhongming Z., Linong L., Xiaona Y., Wangqiang Z., & Wei L. COVID peaks global carbon emissions. 2020.
- Ziervogel G., New M., Archer van Garderen E., Midgley G., Taylor A., Hamann R., & Warburton M. Climate change impacts and adaptation in South Africa. Wiley Interdiscip Rev Clim. 2014; 5(5): 605-620.
CrossRef - Teffo T. K., Dukhan S., Ramalepe P., & Risenga I. Phytochemical analysis and biological activities of various parts of Bulbine natalensis (Baker): A comparative study. J Herbmed Pharmacol. 2024; 13(1): 52-60.
CrossRef - Kliebenstein D. J. Making new molecules—evolution of structures for novel metabolites in plants. Curr Opin Plant Biol. 2013; 16(1):112-117.
CrossRef - Verma N., & Shukla S. Impact of various factors responsible for fluctuation in plant secondary metabolites. J Appl Res Med Aromat Plants. 2015; 2(4): 105-113.
CrossRef - Akula R., & Ravishankar G. A. Influence of abiotic stress signals on secondary metabolites in plants. Plant Signal & Behav. 2011; 6(11): 1720-1731.
CrossRef - Ghuman S., Ncube B., Finnie J. F., McGaw L. J., Njoya E. M., Coopoosamy R. M., & Van Staden J. Antioxidant, anti-inflammatory and wound healing properties of medicinal plant extracts used to treat wounds and dermatological disorders. S Afr J Bot. 2019; 126: 232-240.
CrossRef - Lazarus G. G. In vitro anti-platelet aggregation activity of the extracts of Bulbine natalensis (Doctoral dissertation). 2011.
- Siddhuraju P., & Becker K. Antioxidant properties of various solvent extracts of total phenolic constituents from three different agroclimatic origins of drumstick tree (Moringa oleifera Lam.) leaves. J Agric Food Chem. 2003; 51(8): 2144-2155.
CrossRef - Pakade V., Cukrowska E., & Chimuka L. Comparison of antioxidant activity of Moringa oleifera and selected vegetables in South Africa. S Afr J Sci. 2013; 109(3): 1-5.
CrossRef - Prabhavathi R. M., Prasad M. P., & Jayaramu M. Studies on qualitative and quantitative phytochemical analysis of Cissus quadrangularis. Adv Appl Sci Res. 2016; 7(4): 11-17.
- Gul R., Jan S. U., Faridullah S., Sherani S., & Jahan N. Preliminary phytochemical screening, quantitative analysis of alkaloids, and antioxidant activity of crude plant extracts from Ephedra intermedia indigenous to Balochistan. Sci World J. 2017.
CrossRef - Ayoade E. T., Akinyemi A. O., & Oyelere F. S. Phytochemical profile of different morphological organs of Moringa oleifera plant. J Phytopharm. 2019; 8(6): 295-8.
CrossRef - Yadav R. N. S., & Agarwala M. Phytochemical analysis of some medicinal plants. J Phytol. 2011; 3(12).
- Roghini R., & Vijayalakshmi K. Phytochemical screening, quantitative analysis of flavonoids and minerals in ethanolic extract of Citrus paradisi. Int J Pharm Sci Res. 2018; 9(11): 4859-4864.
- Tepal P. Phytochemical screening, total flavonoid and phenolic content assays of various solvent extracts of tepal of Musa paradisiaca. Malaysian J Anal Sci. 2016; 20(5): 1181-1190.
CrossRef - Iqbal S., & Bhanger M. I. Effect of season and production location on antioxidant activity of Moringa oleifera leaves grown in Pakistan. J Food Compost Anal. 2006; 19(6-7): 544-551.
CrossRef - Lahare R. P., Yadav H. S., Bisen Y. K., & Dashahre A. K. Estimation of total phenol, flavonoid, tannin and alkaloid content in different extracts of Catharanthus roseus from Durg district, Chhattisgarh, India. Sch Bull. 2021; 7(1): 1-6.
CrossRef - Oyedemi S. O., Bradley G., & Afolayan A. J. In-vitro and-vivo antioxidant activities of aqueous extract of Strychnos henningsii Gilg. Afr J Pharm Pharmacol. 2010; 4(2): 70-78.
- Brand-Williams W., Cuvelier M. E., & Berset C. L. W. T. Use of a free radical method to evaluate antioxidant activity. LWT. 1995; 28(1): 25-30.
CrossRef - Ruch R. J., Cheng S. J., & Klaunig J. E. Prevention of cytotoxicity and inhibition of intercellular communication by antioxidant catechins isolated from Chinese green tea. J Carcinog. 1989; 10(6): 1003-1008.
CrossRef - Dinis T. C., Madeira V. M., & Almeida L. M. Action of phenolic derivatives (acetaminophen, salicylate, and 5-aminosalicylate) as inhibitors of membrane lipid peroxidation and as peroxyl radical scavengers. Arch Biochem Biophys. 1994; 315(1): 161-169.
CrossRef - Jain I., Jain P., Bisht D., Sharma A., Srivastava B., & Gupta N. Comparative evaluation of antibacterial efficacy of six Indian plant extracts against Streptococcus mutans. J Clin Diagn Res. 2015; 9(2): 50-54.
CrossRef - Adeleye O. C., & Risenga I. M. Screening of phytochemical profile and biological activities in the leaves, stems and roots of South African Portulacaria afra using four extraction solvents. BPJ. 2022; 15(3): 1561-1572.
CrossRef - Tshabalala T., Mutanga O., & Abdel-Rahman E. M. Predicting the geographical distribution shift of medicinal plants in South Africa due to climate change. Conserv. 2022; 2(4): 694-708.
CrossRef - Sharma R., & Singh H. Alteration in biochemical constituents and nutrients partitioning of Asparagus racemosus in response to elevated atmospheric CO2 concentration. Environ Sci Pollut Res. 2022; 29(5): 6812-6821.
CrossRef - Li Y., Kong D., Fu Y., Sussman M. R., & Wu H. The effect of developmental and environmental factors on secondary metabolites in medicinal plants. Plant Physiol Biochem. 2020; 148: 80-89.
CrossRef - Cawood M. E., Allemann I., & Allemann J. Impact of temperature stress on secondary metabolite profile and phytotoxicity of Amaranthus cruentus L. leaf extracts. Acta agriculturae Slovenica. 2018; 111(3): 609-620.
CrossRef - Saravanan S. Effect of Elevated CO2 on Growth and Biochemical changes in Catharanthus roseus An Valuable Medicinal Herb. J Stress Physiol Biochem. 2021; 17(3): 70-77
- Raza A., Ashraf F., Zou X., Zhang X., & Tosif H. Plant adaptation and tolerance to environmental stresses: mechanisms and perspectives. Plant Ecophysiology and Adaptation under Climate Change: Mechanisms and Perspectives I: General Consequences and Plant Responses. 2020: 117-145.
CrossRef - Howard C. C., Folk R. A., Beaulieu J. M., & Cellinese N. The monocotyledonous underground: global climatic and phylogenetic patterns of geophyte diversity. Am J Bot. 2019; 106(6): 850-863.
CrossRef - Ryan P. R., Delhaize E., Watt M., & Richardson A. E. Plant roots: understanding structure and function in an ocean of complexity. Ann Bot. 2016; 118(4): 555-559.
CrossRef - Kumar K., Debnath P., Singh S., & Kumar N. An overview of plant phenolics and their involvement in abiotic stress tolerance. Stresses. 2023; 3(3): 570-585.
CrossRef - Peter Constabel C., Yoshida K., & Walker V. Diverse ecological roles of plant tannins: plant defense and beyond. Rec Adv Polyphenol Res. 2014; 115-142.
CrossRef - Chin L., Leung D. W., & Taylor H. H. Lead chelation to immobilised Symphytum officinale L.(comfrey) root tannins. Chemosphere. 2009; 76(5): 711-715.
CrossRef - McDonald M., Mila I., & Scalbert A. Precipitation of metal ions by plant polyphenols: optimal conditions and origin of precipitation. J Agric Food Chem. 1996; 44(2): 599-606.
CrossRef - Scalbert A. Antimicrobial properties of tannins. Phytochemistry. 1991; 30(12): 3875-3883.
CrossRef - Mora J., Pott D. M., Osorio S., & Vallarino J. G. Regulation of plant tannin synthesis in crop species. Front Genet. 2022; 13, 870976.
CrossRef - Alia S. A. M., Zainc C. R. C. M., & Latipa J. Influence of elevated CO2 on the growth and phenolic constituents produced in Hibiscus sabdariffa var. UKMR-2. J Technol. 2019; 1(10): 109-118.
- Al Jaouni S., Saleh A. M., Wadaan M. A., Hozzein W. N., Selim S., & AbdElgawad H. Elevated CO2 induces a global metabolic change in basil (Ocimum basilicum L.) and peppermint (Mentha piperita L.) and improves their biological activity. J Plant Physiol. 2018; 224, 121-131.
CrossRef - Yu-Syuan L. I., Kuan-Hung L. I. N., Chun-Wei W. U., & Yu-Sen C. Effects of temperatures on growth, physiological, and antioxidant characteristics in Houttuynia cordata. Notulae Botanicae Horti Agrobotanici Cluj-Napoca. 2021; 49(4): 12536.
CrossRef - Rysiak A., Dresler S., Hanaka A., Hawrylak-Nowak B., Strzemski M., Kováčik & Wójciak M. High temperature alters secondary metabolites and photosynthetic efficiency in Heracleum sosnowskyi. Intl J Mol Sci. 2021; 22(9), 4756.
CrossRef

