
Manuscript accepted on :30-04-2024
Published online on: 06-06-2024
Plagiarism Check: Yes
Reviewed by: Dr. Anjaneyulu Konuri and Dr. Debasmita Dutta Pramanick
Second Review by: Dr. Belayneh Regasa
Final Approval by: Dr. Mariia Shanaida
Amani Ali Shaman1 , Nahla S. Zidan2,3* , Sharifa Alzahrani4, Laila A. AlBishi5, Hosame El-Beiltage6, Mohamed I. Sakran6,7, Fahad M. Almutairi 8 and Ali A. Keshk 9
1Faculty of Medicine, , University of Tabuk, Tabuk, Kingdom of Saudi Arabia
2Faculty of science, food Science and Nutrition Dept, University of Tabuk, Tabuk, Saudi Arabia
3Department of Nutrition and Food Science Faculty of Specific Education,Kafrelsheikh University, Kafr El-Shaikh,Egypt
4Pharmacology Department, Faculty of Medicine, University of Tabuk, Tabuk, Saudi Arabia
5Pediatric Department, Faculty of Medicine,University of Tabuk, Tabuk,Saudi Arabia
6Biochemistry Department, Faculty of Science, University of Tabuk, Tabuk,Saudi Arabia
7Biochemistry Section, Chemistry Department, Faculty of Science, Tanta University, Tanta, Egypt
8Department of Chemistry, Faculty of s, University of Tabuk, Tabuk 71491, Saudi Arabia
Corresponding Author E-mail: nzidan@ut.edu.sa
DOI : https://dx.doi.org/10.13005/bpj/2911
Abstract
The effects of supplying experimental rats with unicellular green algae Chlorella and tiny filamentous cyanobacteria Spirulina, on type 2 diabetes (T2DM) were examined in the present study. Eight sets of male Sprague-Dawley albino rats, each with six individuals, were used in the investigation. Throughout the trial, Group 1 was the negative control group and was given saline regularly. Group 2 was given alloxan to induce diabetes. Spirulina was given to groups 3, 4, and 5 at dosages of 100, 200, and 300 mg/kg body weight, respectively, after diabetes induction. Similarly, groups 6, 7, and 8 received dosages of 100, 200, and 300 mg/kg body weight of Chlorella, respectively. The findings indicated that the control group had significantly higher levels of triglycerides, low-density lipoprotein (LDL), blood sugar, and very low-density lipoprotein (VLDL) and considerably lower levels of insulin, high-density lipoprotein (HDL), and phospholipids. However, rats given Spirulina (groups 3, 4, and 5) showed notably higher insulin, HDL, and phospholipids levels and significantly lower blood glucose, cholesterol, VLDL, LDL, and triglycerides levels. Rats fed with Chlorella (groups 6, 7, and 8) also showed increased effectiveness of feed ratios, greater final weights, and body weight growth percentages compared to the control group. The present study shows that supplementing with Spirulina and Chlorella improves insulin lipid patterns, blood sugar, and type 2 diabetes in vivo laboratory rats. According to the research, Spirulina and Chlorella may be used as functional meals to help control and cure diabetes.
Keywords
Antioxidants; Chlorella; Feed efficiency, In vivo experimental rats; Spirulina; T2DM
Download this article as:| Copy the following to cite this article: Shaman A. A, Zidan N. S, Alzahrani S, AlBishi L. A, El-Beiltage H, Sakran M. I, Almutairi F. M, Keshk A. A. Anti-diabetic Activity of Spirulina and Chlorella in In vivo Experimental Rats. Biomed Pharmacol J 2024;17(2). |
| Copy the following to cite this URL: Shaman A. A, Zidan N. S, Alzahrani S, AlBishi L. A, El-Beiltage H, Sakran M. I, Almutairi F. M, Keshk A. A. Anti-diabetic Activity of Spirulina and Chlorella in In vivo Experimental Rats. Biomed Pharmacol J 2024;17(2). Available from: https://bit.ly/45aHM4Y |
Introduction
Diabetes is characterized by hyperglycemia, a condition caused by insufficient or absent insulin in the body. Type 1 diabetes, known as insulin-dependent diabetes mellitus, results from autoimmune damage, while type 2 diabetes (T2DM), also called insulin-independent diabetes mellitus, is primarily caused by insulin resistance in tissues such as muscle, liver, and adipose tissue1. In T2DM, the β-cells in the pancreas cannot adequately compensate for insulin resistance. The consumption of increased amounts of refined sugar and saturated fat has often been associated with T2DM and insulin resistance2,3. The International Diabetes Federation reports that approximately 96,000 new cases of diabetes are diagnosed each year4.
Since the beginning of human history, medicinal plants have been utilized to create drugs and have been essential in treating many illnesses. Around 800 plant species are said by Asian Indians, Chinese, and South Americans to have anti-diabetic properties due to their hypoglycemic activity pathways5. Most medicinal plants showed evidence of antioxidant activity because they contained active antioxidant substances like anthocyanins, flavonoids, isoflavones, coumarins, flavones, catechins, isocatechins and lignans, as well as antioxidant vitamins like C and E, b-carotene, and tocopherol6.
Spirulina is a blue-green algae that belongs to the cyanobacterial family. It is rich in proteins, vitamins, carotenoids, other bioactive substances, linoleic acid, and vitamin precursors like carotenoids7.8. An alternative kind of green algae rich in protein, fiber, vital fatty acids, and a variety of vitamins, minerals, and phytonutrients is called Chlorella9. Apart from their health benefits, these algae are also being studied as a potential bioactive source for diabetic treatment. Evidence suggests that Chlorella and Spirulina may enhance insulin sensitivity, increase insulin release from pancreatic cells, and reduce blood glucose levels10,11. They also have anti-inflammatory properties because of their vitamin and antioxidant content12.
This study focused on the hypoglycemic and lipid-lowering effects of Spirulina platensis and Chlorella, both alone and in combination, on anti-inflammatory and blood biochemical parameters in rats with diabetes mellitus.
Materials and methods
Materials
Chemicals and Algae
The Institute of Land, Water, and Environmental Research supplied the algae in Giza, Egypt (Spirulina and Chlorella).
Following the previous study, we purchased alloxan monohydrate from Sigma Corporation and standardized the animal dose to 120 mg/kg body weight.13.
Methodology
Study Animals
This study used 48 mature male Sprague-Dawley strain albino rats divided into eight groups. Each rat had an initial weight ranging from 200 to 250 grams. The rats were obtained from the Agricultural Research Center in Giza, Egypt. Before the four-week study, the rats experienced a seven-day adaption phase during which they were closely monitored. The participants were given a portion of regular food and unrestricted access to water to aid in their environmental adjustment.
Induction of diabetes by Alloxan
Alloxan, a well-used technique, was used to develop diabetes in the experimental rats in this work. The Alloxan, acquired from Sigma Aldrich Chemicals, was kept at -4°C. The test animals had a 12-h period of fasting before being administered alloxan. The experimental groups (Group-II-iV) were then given different dosages of solitary alloxan into the abdominal cavity, commencing at 120 mg/kg. The rats were promptly given freshly produced alloxan solutions at various dosages in each trial.
Mechanism of Action Alloxan
A common experimental model for insulin-dependent diabetic mellitus is alloxan-induced diabetes. Alloxan’s mode of action has been thoroughly investigated and is now mainly understood. Numerous investigations have shown that regardless of glucose, alloxan causes an immediate increase in insulin production 14,15. The release of alloxan-induced insulin occurs briefly before being inhibited, even at high glucose levels16. This effect is preceded by the rapid absorption of alloxan by pancreatic beta cells, which has been proposed as one of the primary mechanisms underlying alloxan’s diabetogenic properties.
Furthermore, various reducing agents, including reduced glutathione (GSH), cysteine, ascorbate, and protein-bound sulfhydryl (-SH) groups, are present when pancreatic beta cells undergo the reduction process17,18. The glucokinase sugar-binding site has two -SH groups that alloxan interacts with to inactivate the enzyme and cause the disulfide bond to form.
After alloxan is reduced to dialuric acid, the latter deoxidizes to return to alloxan, starting a redox cycle that yields reactive oxygen species and superoxide. Ferric ions are liberated from ferritin by superoxide radicals, which then transform it into ferrous and ferric ions19. Furthermore, in the presence of superoxide dismutase, superoxide radicals’ dismutase produces hydrogen peroxide (H2O2). According to the Fenton reaction14, extremely reactive hydroxyl radicals are formed in ferrous and H2O2.
Experimental-Animals-Protocol
Group 1: Negative control group (- ve)
During the trial, this group was the standard control group and was given regular saline.
Group 2: diabetic group took alloxan intraperitoneally (120 mg/kg).
Groups 3, 4, and 5: Spirulina algae treated group
After diabetes, Spirulina was given 100 .200 .300 mg /kg body weight, respectively.
Group 6, 7, and 8: Chlorella alga treated group
After diabetes, Chlorella was given 100 .200 .300 mg /kg body weight, respectively.
Calculation of some Nutritional Parameters
Rats were observed eating every day, and their weight was measured once a week to measure the weight gain (body weight increase). The following formulae were used to calculate the findings at the end of the experiment. Feed efficiency ratio (FER) and body weight rise, as reported by Chapman et al. in 195915.
Body weight gain (BWG):
Body weight gain (BWG) was assessed weekly for each animal, and at the end of the trial, the mean and standard error for each group were calculated based on these measurements.


Food efficiency ratio (FER) = Body-weight gain (g) / Food-intake (g)
Relative organs weight = organ-weight (g) / Final body-weight (g) × 100
Estimation of the gross chemical composition
Following the AACC 2000 guidelines, the moisture content, total carbohydrate, protein, fat, ash, and crude fiber contents were measured16.
Biological analysis.
Collection and preparation of blood samples for analysis
Di-ethyl ether was applied to anesthetize the animals in each group after the trial period. Heparinized capillary tubes were used to draw blood samples taken from the rat’s eye’s inner canthus. The serum was then extracted following ten minutes of centrifugation at 3000 rpm. The samples were kept at -20˚C in a deep freezer until they were needed for different biochemical analyses. Serum samples were used for the determination of:
The glucose was estimated using Trinder’s 1969 methodology17
Insulin was determined according to Burgi et al., 198818.
Lipid pattern fractionation:
Lipid pattern fractionations were evaluated through the utilization kits of spin react enzyme as the following:
Serum of cholesterol (CHO) was calculated following Young 200119
The serum of triglyceride (TG) was calculated by enzymatic method in accordance with Bucolo and David (1973)20
C-Serum of high-density lipoprotein cholesterol (HDLc) was calculated in accordance with Grodon and Amer (1977)21.
Serum total Lipids were calculated in accordance with Tietz 197622.
In compliance with Lee and Nieman 199623, measurements of low-density lipoprotein cholesterol (LDLc) and very low-density lipoprotein cholesterol (VLDLc) were made. as follows:
VLDL = TG / 5
LDL-c = TC – (TG / 5 – HDL-c)
Internationally recognized ethical guidelines for using and caring for laboratory animals were followed when applying all biological experimentation techniques. The Research Ethics Committee of the University of Tabuk’s Faculty of Science also authorized the experiment.
Statistical analysis
Armitage and Berry 1987 [24] stated that all tests were run using the statistical analysis software computer program (SPSS, version 24, 2016). After gathering the data, it was shown as means ± standard deviations or means ± SD. The statistical analysis used a one-way analysis of variance (ANOVA), and a comparison of the group means was performed using the least significant difference (LSD) statistic test.
Results
Table 1 demonstrated no statistically significant variations in feed intake, body weight growth percentage, final weight, or feed efficiency ratio (FER) between diabetes and control groups. The Spirulina Spirulina 100, 200, and 300 and Chlorella 100, 200, and 300 treated groups had substantially greater final weights, weight gain, weight gain percentages, and feed efficiency ratios (FER) than the control (+ve) group.
Table 1: Nutritional markers of rats with T2DM treated with Spirulina 100, 200, and 300, and rats with negative control (-ve) and untreated (+ve) groups.
|
Variables Groups |
Initial weight (gm) |
Final weight (gm) |
Weight gain |
Weight Gain |
Feed intake.(gm) |
FER |
|
Control (+ve) |
162a ±9.67 |
165.66d ±6.87 |
3.66e ± 1.76 |
2.26e ±0.90 |
13.82a ±1.90 |
0.008e ±0.001 |
|
Control (-ve) |
155.33a ±7.54 |
212a ±3.98 |
56.66a ±4.98 |
36.48a ±2.13 |
13.31a ±1.56 |
0.141a ±0.012 |
|
Spirulina 100 |
158.25a ±8.31 |
186.5 c ±7.87 |
28.25c ±3.90 |
17.85bc ±1.07 |
13.31 a ±1.76 |
0.070c ±0.021 |
|
Spirulina 200 |
164.25a ±5.76 |
185c ±6.87 |
20.75d ±3.32 |
12.63d ±1.43 |
14.06 a ±1.45 |
0.049d ±0.011 |
|
Spirulina 300 |
167a ±6.98 |
191bc ±8.90 |
24c ±4.65 |
14.37c ±2.50 |
13.94a ±1.15 |
0.057d ±0.001 |
|
Chlorella 100 |
164.25a ±7.86 |
200.25b ±8.98 |
36b ±2.76 |
21.91b ±2.54 |
13.53a ±2.01 |
0.088b ±0.013 |
|
Chlorella 200 |
166.75a ±6.98 |
200.5b ±7.98 |
33.75b ±3.21 |
20.23b ±2.90 |
13.42a ±1.90 |
0.083b ±0.002 |
|
Chlorella 300 |
162.25a ±6.96 |
197.33bc ±6.87 |
35.08b ±3.71 |
21.62b ±2.15 |
13.76a ±1.90 |
0.084b ±0.001 |
The means in each row, denoted by a distinct subscript (a, b, c, and d), exhibit a significant difference at (P<0.05).
The blood glucose level in the control (+ve) group increased considerably over the course of four weeks as compared to the control (-ve) group, according to the data in Table (2). Over Spirulina ChlorellaChlorellafour weeks, the blood glucose levels of the Spirulina 100, 200, 300 and Chlorella 100, 200, 300 treated groups gradually and significantly decreased compared to the control (+ve) group.
Table 2: Effect of Spirulina 100, 200, 300, Chlorella100, 200, and 300 on Blood glucose level in T2DM rat groups
|
Group |
(mg /dl) |
Control (+) |
Control (-) |
S 100 |
S 200 |
S 300 |
CH 100 |
CH 200 |
CH 300 |
|
First week |
429.33d ±38.99 |
94a ±14.11 |
354.33a ±40.51 |
355.33a ±44.45 |
287.33a ±63.28 |
351a ±69.91 |
328a ±24.87 |
290 a ±46.03 |
|
|
Second week |
456.33c ±29.19 |
95.33a ±10.50 |
293.33ab ±43.82 |
309.33b ±30.52 |
252.66ab ±46.51 |
315.66ab ±64.01 |
260.33b ±37.05 |
243.66ab ±29.83 |
|
|
Third week |
467.66b ±41.05 |
94 a ±9.64 |
264.33b ±56.85 |
270.66c ±31.50 |
221b ±28.84 |
292.33b ±52.70 |
220.66bc ±32.19 |
175.66b ±30.28 |
|
|
Fourth week |
503a ±43.09 |
95.33a ±9.01 |
257.66b ±61.07 |
178d ±18.33 |
163c ±19.07 |
202.66c ±11.06 |
163c ±37.81 |
131bc ±22.27 |
The means in each row, denoted by a distinct subscript (a, b, c, and d), exhibit a significant difference at (P<0.05).
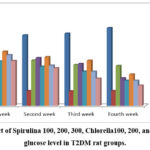 |
Figure 1: Effect of Spirulina 100, 200, 300, Chlorella100, 200, and 300 on Blood glucose level in T2DM rat groups. |
The information in Table (3) demonstrated a very noticeable drop in insulin levels over the course of four weeks in the control (+ve) group as compared to the control (-ve) group. After two and four weeks of insulin levels, the Spirulina 100, 200, 300, Chlorella 100, 200, and 300 treated groups showed a substantial rise. This was the most significant level in favor of Spirulina Spirulina 300 and Chlorella 300 compared with control (+ve).
Table 3: Effect of Spirulina 100, 200, 300, Chlorella100, 200 and 300 on Insulin level in T2DM rat groups.
|
Group |
Control (+) |
Control (-) |
S 100 |
S 200 |
S 300 |
CH 100 |
CH 200 |
CH 300 |
|
After 2 weeks |
105a 12.72± |
273.5b 13.43± |
181ab 10.38± |
210.5b 21.92± |
234b 8.38± |
193.5 b 17.67± |
226.5 b 26.16± |
249 b 2.82± |
|
After 4 weeks |
89b 2.8± |
302.5a 19.09± |
206a 12.72± |
240a 15.55± |
243a 8.48± |
235.5a 7.77± |
266.5a 6.36± |
285.5 a 9.19± |
The means in each row, denoted by a distinct subscript (a, b, c, and d), exhibit a significant difference at (P<0.05).
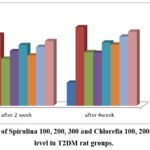 |
Figure 2: Effect of Spirulina 100, 200, 300 and Chlorella 100, 200, 300 on Insulin level in T2DM rat groups. |
Comparing the diabetic rats to the negative control (-ve) group, Table (4) showed a substantial increase in CH, LDL, TG, and VLDL and a significant decrease in HDL. The Spirulina 100, 200, and 300 and Chlorella 100, 200, and 300 treated groups showed a substantial drop in TG, CH, LDL, and VLDL and a considerable rise in HDL compared to the positive control (+ve) group. The diabetic rat groups with the highest response to cholesterol reduction were those given 300 Spirulina and 300 Chlorella.
Table 4: Effect of Spirulina 100, 200, 300 and Chlorella100, 200, 300 on lipid pattern in T2DM rat group.
|
Gp. |
CH (mg/dl) |
HDL (mg/dl) |
LDL (mg/dl) |
TG (mg/dl) |
VLDL (mg/dl) |
|
Control + |
115.5a ±7.77 |
38cd ±5.65 |
51a ±2.82 |
131.5a ±4.94 |
26.3a ±0.98 |
|
Conrtol – |
60.5e ±4.94 |
45b ±2.82 |
2.5f ±0.70 |
65.5e ±4.49 |
13.1e ±0.98 |
|
Spirulina 100 |
103b ±2.82 |
37d ±1.41 |
43.5b ±3.18 |
112.5b ±7.42 |
22.5b ±1.48 |
|
Spirulina 200 |
89cd ±4.24 |
42.5c ±2.12 |
27d ±1.21 |
97.5bc ±9.19 |
19.5bc ±1.83 |
|
Spirulina 300 |
77d ±2.82 |
46.5b ±2.12 |
13de ±4.24 |
86c ±4.24 |
17.2c ±0.84 |
|
Chlorella 100 |
91.5c 4.99± |
39.5cd 2.12 ± |
31c 1.10± |
105b 12.72± |
21b 2.54± |
|
Chlorella 200 |
75d 8.48± |
51a 2.82± |
7.5e 3.53± |
83.5c 12.02± |
16.7c 2.40± |
|
Chlorella 300 |
70.5de ±3.53 |
49.5a 3.12 ± |
7e 1.41 ± |
70.5d 0.70 ± |
14.1d 0.14 ± |
The means in each row, denoted by a distinct subscript (a, b, c, and d), exhibit a significant difference at (P<0.05).
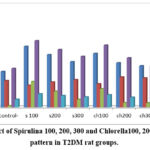 |
Figure 3: Effect of Spirulina 100, 200, 300 and Chlorella100, 200, 300 on lipid pattern in T2DM rat groups. |
Table (5) demonstrated a significant drop in phospholipids and a significant rise in total lipids when comparing the diabetic rats to the negative control group (-ve). Compared to the positive control (+ve) group, the Spirulina 100, 200, and 300, and Chlorella 100, 200, and 300 treated groups had a substantial decrease in total lipids and a considerable increase in phospholipids. Chlorella 300 was determined to have the highest amounts of phospholipid and the lowest concentrations.
Table 5: Effect of Spirulina 100, 200, 300 and Chlorella100, 200, 300 on (Phospholipids and Total lipids) in diabetes rat groups.
|
Gp. |
Phospholipids (mg/dl) |
Total lipids (mg/dl) |
|
Control+ |
39e±2.82 |
401.5a±20.50 |
|
Conrtol – |
85a±5.65 |
205f±15.55 |
|
Spirulina 100 |
45d±4.24 |
340b±16.97 |
|
Spirulina 200 |
56c±4.24 |
288c±2.88 |
|
Spirulina 300 |
65b±4.24 |
263.5d±7.77 |
|
Chlorella 100 |
49d±4.24 |
321bc±19.79 |
|
Chlorella 200 |
68.51b±3.18 |
259.5d±9.54 |
|
Chlorella 300 |
74ab±5.65 |
240.51e±13.43 |
The means in each row, denoted by a distinct subscript (a, b, c, and d), exhibit a significant difference at (P<0.05).
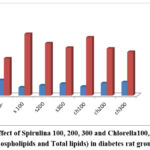 |
Figure 4: Effect of Spirulina 100, 200, 300 and Chlorella100, 200, 300 on (Phospholipids and Total lipids) in diabetes rat groups. |
Discussion
In this work, we examined the effects of Spirulina and Chlorella on the lipid profile, blood glucose, and insulin levels of rats who were given fake diabetes. The combination of Spirulina and Chlorella was shown to be more effective than either one alone, as seen by the significant improvements in all examined parameters (body weight, blood sugar, insulin levels, HDL, LDL, VLDL, CH, TG, and phospholipids). Considering the following important issues:
Effect on Body weight
Compared to rats with diabetes, rats with induced diabetes fed a meal containing 100, 200, and 300 mg/kg of spirulina, and 100, 200, and 300 mg/kg of Chlorella showed a significant increase in body weight. This result aligned with the findings published by Lee et al. (2008)1. In diabetic rats, both SP and CH increased body weight. This might be related to an increase in food intake or an increase in insulin production, both of which are important for diabetes patients to maintain their body weight 2.
Effect of SP and CH on BG level and Insulin level.
At the start of the trial, the BG levels of every rat in the study were comparable. Following a 4-week course of therapy, the rats given SP and CH showed lower BG levels than the diabetic-induced rats. Additionally, BG levels were significantly lower in the SP and CH groups than in the untreated group (p < 0.05). Our findings showed that BG levels were considerably lower in diabetic rat groups treated with increasing dosages of SP and CH than in the diabetic control group. This was consistent with the findings of research conducted by Metwally (2015)3, who found that oral treatment of SP significantly reduced blood glucose. The enhanced skeletal muscle and hepatic glucose absorption caused by these nonspecific microalgae may have a hypoglycemic effect4.
In STZ-induced diabetic mice, the oral treatment of 100 mg/kg Chlorella for 90 days led to a considerable decrease in plasma glucose and a rise in plasma insulin levels5. In addition, Gargouri et al. observed that a meal supplemented with 5% Spirulina for 21 days decreased blood glucose levels. Previous research has indicated that Spirulina and Chlorella alone or in combination can have an antihyperglycemic impact5,6. Chlorella may improve insulin sensitivity by stimulating β cells to secrete more insulin, increasing insulin production7.
Effect on lipid profile.
Patients with diabetes mellitus may have markedly elevated triglyceride (TG) levels, leading to lipid degradation and obesity8,9. Evidence shows that taking Spirulina as a dietary supplement lowers hypercholesterolemia because it has a substantial amount of cysteine in its Cphycocyanin protein10. According to some authors, consuming this alga lowers intestinal absorption of cholesterol and bile acid reabsorption in the ileum. They thus argue that Spirulina is a functional food that can help with weight loss6,11. Chlorella has also been shown to reduce TG levels12 by stopping the liver from forming fatty acids.
Patients with diabetes mellitus may have a marked increase in triglyceride (TG) levels, which can accelerate the breakdown of fat and raise the risk of obesity8,9. Evidence shows that taking Spirulina as a dietary supplement protects against hypercholesterolemia because of the large cysteine in its phycocyanin protein10. Some authors claim that consuming this alga lessens the number of bile acids reabsorbed in the ileum and the quantity of cholesterol absorbed through the intestines. According to them, Spirulina may be considered a functional food that can aid in weight loss6,11. Chlorella also reduces TG levels by blocking the synthesis of hepatic fatty acids12. Furthermore, because Spirulina includes a significant quantity of cysteine in its Cphycocyanin protein, using it as a dietary supplement may help prevent hypercholesterolemia15.
Prior research has examined the impact of Spirulina and Chlorella on diabetes and lipid profile, yielding helpful knowledge on their possible therapeutic advantages. Although I lack access to particular research.
The current research found a significant reduction in blood glucose levels after administering Spirulina and Chlorella therapy. This discovery is consistent with other research that has shown the hypoglycemic properties of these algae. It is worth mentioning that the extent of blood glucose decrease might fluctuate among research owing to variations in dose, treatment duration, and the severity of diabetes in the animal models or human individuals being studied.
The current study
confirms prior research findings that show an increase in insulin levels after
treatment with Spirulina and Chlorella. These data indicate that these algae can
potentially improve insulin sensitivity or promote insulin production.
Nevertheless, discrepancies in the study’s structure and the particular
techniques used to assess insulin levels might influence the divergent results
obtained36.
The current study revealed that Spirulina and Chlorella had favorable impacts
on lipid profile. These benefits include decreases in cholesterol, LDL, TG, and
VLDL levels and an increase in HDL. These findings are in line with prior
studies. Several studies have shown the lipid-lowering properties of these
algae, which may be linked to their abundant levels of polyunsaturated fatty
acids, phytosterols, and antioxidant substances37. Nevertheless,
differences in the characteristics of the groups being studied, the amount of
algae administered, and the length of the treatment period might all have a
role in the inconsistencies reported in the extent of the effects38.
It is essential to mention that while there is an increasing amount of data
supporting the potential advantages of Spirulina and Chlorella in managing
diabetes and improving lipid profiles, the area is still developing, and some
research may provide contradictory findings. Moreover, discrepancies in
research methodology, such as the use of animal models vs human participants
and variability in the quality and composition of algae, pose difficulties in
making direct comparisons.
We can conclude that Spirulina has been indicated as a functional food that can help people lose weight6,11. Chlorella has also been demonstrated to lower TG levels by preventing the formation of fatty acids in the liver12,35.
Conclusion and recommendations
This study demonstrates that administering Spirulina, Chlorella, or a combination of both orally to rats with induced diabetes significantly improves several factors, including body weight, blood glucose, insulin levels, and lipid profile. Both Spirulina and Chlorella showed promising results individually, with even greater efficacy observed when combined. These improvements suggest the potential of Spirulina and Chlorella as dietary supplements for managing diabetes-related issues. However, further research is needed to explore their benefits in diabetic individuals. Clinical studies involving diabetic patients could provide valuable insights into the effectiveness and safety of these algae as adjunct therapies for diabetes and its complications. Additionally, investigating the underlying mechanisms by which Spirulina and Chlorella exert their effects on diabetes control could offer valuable therapeutic insights. Establishing evidence-based guidelines regarding the optimal dosage and duration of treatment with Spirulina and Chlorella is crucial. Moreover, ensuring the quality and integrity of Spirulina and Chlorella products used in research and clinical settings is essential to guarantee their effectiveness and safety.
Conflict of interest
No conflict of interest
Funding Sources
The authors extend their appreciation to the Deanship of Scientific Research at “The University of Tabuk, KSA” for funding this work through Research Group, Grant/Award Number: -S-1441-0091
References
- Eizirik, D.L.; Pasquali, L.; Cnop, M. Pancreatic _-cells in type 1 and T2DM mellitus: Different pathways to failure. Nat. Rev. Endocrinol. 2020, 16, 349–362.
CrossRef - Ormazabal, V., Nair, S., Elfeky, O. et al. Association between insulin resistance and the development of cardiovascular disease. Cardiovasc Diabetol 17, 122 (2018). https://doi.org/10.1186/s12933-018-0762-4.
CrossRef - Ramos-Romero, S.; Hereu, M.; Atienza, L.; Casas, J.; Jáuregui, O.; Amézqueta, S.; DaSilva, G.; Medina, I.; Nogués, M.R.; Romeu, M.; et al. Mechanistically different effects of fat and sugar on insulin resistance, hypertension, and gut microbiota in rats. Am. J. Physiol. Metab. 2018, 314, E552–E563.
CrossRef - Forouhi NG, Wareham NJ. Epidemiology of diabetes. Medicine. 2019;47(1):22–7.
CrossRef - Tejero Pérez A, Kapravelou G, Porres Foulquie JM, López Jurado Romero de la Cruz M, Martínez Martínez R. Potential benefits of microalgae intake against metabolic diseases: beyond spirulina-a systematic review of animal studies. Nutr Rev. 2023 Aug 29:nuad098. doi: 10.1093/nutrit/nuad098. Epub ahead of print. PMID: 37643736.
CrossRef - Gasmi, A.; Mujawdiya, P.K.; Noor, S.; Lysiuk, R.; Darmohray, R.; Piscopo, S.; Lenchyk, L.; Antonyak, H.; Dehtiarova, K.; Shanaida, M.; et al. Polyphenols in Metabolic Diseases. Molecules 2022, 27, 6280. https://doi.org/10.3390/molecules27196280
CrossRef - Hatami E, Ghalishourani SS, Najafgholizadeh A, Pourmasoumi M, Hadi A, Clark CCT, Assaroudi M, Salehi-Sahlabadi A, Joukar F, Mansour-Ghanaei F. The effect of Spirulina on T2DM: a systematic review and meta-analysis. J Diabetes Metab Disord. 2021 Mar 2;20(1):883-892. doi: 10.1007/s40200-021-00760-z. PMID: 34178867; PMCID: PMC8212345.
CrossRef - Olvera-Roldán EO, Cristóbal-Luna JM, García-Martínez Y, Mojica-Villegas MA, Pérez-Pastén-Borja R, Gutiérrez-Salmeán G, Pérez-Gutiérrez S, García-Rodríguez RV, Madrigal-Santillán E, Morales-González JA, Chamorro-Cevallos G. Effects of Spirulina maxima on a Model of Sexual Dysfunction in Streptozotocin-Induced Diabetic Male Rats. Plants (Basel). 2023 Feb 6;12(4):722. doi: 10.3390/plants12040722. PMID: 36840070; PMCID: PMC9959000.
CrossRef - Azzane A, Eddouks M. Antihyperglycemic, Antihyperlipidemic, and Antioxidant Effects of Salvia tingitana in Streptozotocin-Induced Diabetic Rats. Cardiovasc Hematol Disord Drug Targets. 2022;22(2):118-127. doi: 10.2174/1871529X22666220806122012. PMID: 35946102.
CrossRef - Csatlos, N.-I.; Simon, E.; Teleky, B.-E.; Szabo, K.; Diaconeasa, Z.M.; Vodnar, D.-C.; Ciont, C.; Pop, O.-L. Development of a Fermented Beverage with Chlorella vulgaris Powder on Soybean-Based Fermented Beverage. Biomolecules 2023, 13, 245. https://doi.org/10.3390/biom13020245
CrossRef - Lin C-Y, Huang P-J, Chao C-Y. Chlorella protects against hydrogenperoxide-induced pancreatic β-cell damage. J Med Food.2014;17(12):1273–80.
CrossRef - Aissaoui O, Amiali M, Bouzid N, Belkacemi K, Bitam A. Effect ofSpirulina platensis ingestion on the abnormal biochemical and oxidativestress parameters in the pancreas and liver of alloxaninduceddiabetic rats. Pharm Biol. 2017;55(1):1304–12.
CrossRef - Saryono, Nani D, Proverawati A, Sarmoko. Immunomodulatory effects of black solo garlic (Allium sativum L.) on streptozotocin-induced diabetes in Wistar rats. Heliyon. 2021 Nov 27;7(12):e08493. doi: 10.1016/j.heliyon.2021.e08493. PMID: 34926852; PMCID: PMC8646972.
CrossRef - Yin, P.; Wang, Y.; Yang, L.; Sui, J.; Liu, Y. Hypoglycemic Effects in Alloxan-Induced Diabetic Rats of the Phenolic Extract from Mongolian Oak Cups Enriched in Ellagic Acid, Kaempferol and Their Derivatives. Molecules 2018, 23, 1046. https://doi.org/10.3390/molecules23051046
CrossRef - Adhikari S, Schop M, de Boer IJM, Huppertz T. Protein Quality in Perspective: A Review of Protein Quality Metrics and Their Applications. Nutrients. 2022 Feb 23;14(5):947. doi: 10.3390/nu14050947. PMID: 35267922; PMCID: PMC8912699.
CrossRef - Yukinori Sato, A Modified American Association of Cereal Chemists Method for Compressive Force Value Determination of White Bread Crumb Firmness, Food Science and Technology Research, 2016, Volume 22, Issue 4, Pages 443-450, Released on J-STAGE September 15, 2016, Online ISSN 1881-3984, Print ISSN 1344-6606, https://doi.org/ 10.3136/fstr.22.443, https://www.jstage.jst.go.jp/ article/fstr/22/4/22_443/_article/-char/en, Abstract: .
CrossRef - Zavyalova, K.; Gorst, A.; Mironchev, A. Non-Invasive Determination of Blood Glucose Concentration Using a Near-Field Sensor. Proceedings 2020, 60, 1. https://doi.org/10.3390/IECB2020-07022
CrossRef - Sakamoto, S., Putalun, W., Vimolmangkang, S. et al. Enzyme-linked immunosorbent assay for the quantitative/qualitative analysis of plant secondary metabolites. J Nat Med 72, 32–42 (2018). https://doi.org/10.1007/s11418-017-1144-z
CrossRef - Shah, R., Ali, F.M., Finlay, A.Y. et al. Family reported outcomes, an unmet need in the management of a patient’s disease: appraisal of the literature. Health Qual Life Outcomes 19, 194 (2021). https://doi.org/10.1186/s12955-021-01819-4.
CrossRef - Miao CY, Ye XF, Zhang W, Sheng CS, Huang QF, Wang JG. Serum triglycerides concentration in relation to total and cardiovascular mortality in an elderly Chinese population. J Geriatr Cardiol. 2022 Aug 28;19(8):603-609. doi: 10.11909/j.issn.1671-5411.2022.08.007. PMID: 36339465; PMCID: PMC9630003.
- Solnica B, Sygitowicz G, Sitkiewicz D, Cybulska B, Jóźwiak J, Odrowąż-Sypniewska G, Banach M. 2020 Guidelines of the Polish Society of Laboratory Diagnostics (PSLD) and the Polish Lipid Association (PoLA) on laboratory diagnostics of lipid metabolism disorders. Arch Med Sci. 2020 Mar 2;16(2):237-252. doi: 10.5114/aoms.2020.93253.
CrossRef - Gillery P. HbA1c and biomarkers of diabetes mellitus in Clinical Chemistry and Laboratory Medicine: ten years after. Clin Chem Lab Med. 2022 Oct 14;61(5):861-872. doi: 10.1515/cclm-2022-0894. PMID: 36239682.
CrossRef - Montagut-Martínez P, Pérez-Cruzado D, García-Arenas JJ. Nutritional Status Measurement Instruments for Diabetes: A Systematic Psychometric Review. Int J Environ Res Public Health. 2020 Aug 7;17(16):5719. doi: 10.3390/ijerph17165719. PMID: 32784695; PMCID: PMC7460259.
CrossRef - Artimage, G.Y. and Berry, W.G. (1987): Statistical Methods 7th Ed. Ames, Iowa Stata University Press, 39-63
- Naik A, Adeyemi SB, Vyas B, Krishnamurthy R. Effect of co-administration of metformin and extracts of Costus pictus D.Don leaves on alloxan-induced diabetes in rats. J Tradit Complement Med. 2021 Aug 12;12(3):269-280. doi: 10.1016/j.jtcme.2021.08.007.
CrossRef - Inada AC, Figueiredo PS, Santos-Eichler RAD, Freitas KC, Hiane PA, Castro AP, Guimarães RCA. Morinda citrifolia Linn. (Noni) and Its Potential in Obesity-Related Metabolic Dysfunction. Nutrients. 2017 May 25;9(6):540. doi: 10.3390/nu9060540. PMID: 28587078; PMCID: PMC5490519.
CrossRef - Hannan JMA, Ansari P, Azam S, Flatt PR, Abdel Wahab YHA. Effects of Spirulina platensis on insulin secretion, dipeptidyl peptidase IV activity and both carbohydrate digestion and absorption indicate potential as an adjunctive therapy for diabetes. Br J Nutr. 2020 Nov 28;124(10):1021-1034. doi: 10.1017/S0007114520002111.
CrossRef - Abdella, A.; Abou-Elazm, F.I.; El-Far, S.W. Pharmacological Effects of Lactobacillus casei ATCC 7469 Fermented Soybean and Green Microalgae, Chlorella vulgaris, on Diabetic Rats. Microbiol. Res. 2023, 14, 614-626. https://doi.org/10.3390/microbiolres14020043.
CrossRef - Senthilkumar T, Sangeetha N, Ashokkumar N. Antihyperglycemic, antihyperlipidemic, and renoprotective effects of Chlorella pyrenoidosa in diabetic rats exposed to cadmium. Toxicol Mech Methods. 2012;22(8):617–24.
CrossRef - Gargouri M, Magné C, El Feki A. Hyperglycemia, oxidative stress, liver damage and dysfunction in alloxan-induced diabetic rat are prevented by Spirulina supplementation. Nutr Res. 2016;36(11): 1255–68.
CrossRef - Tamel Selvan, K.; Goon, J.A.; Makpol, S.; Tan, J.K. Therapeutic Potentials of Microalgae and Their Bioactive Compounds on Diabetes Mellitus. Mar. Drugs 2023, 21, 462. https://doi.org/10.3390/md21090462
CrossRef - Hoseini SM, Khosravi-Darani K, Mozafari MR. Nutritional and medical applications of Spirulina microalgae. Mini-Rev Med Chem. 2013;13(8):1231–7.
CrossRef - EL-Sabagh MR, Eldaim MAA, Mahboub D, Abdel-Daim M. Effects of Spirulina platensis algae on growth performance, antioxidative status and blood metabolites in fattening lambs. J Agric Sci. 2014;6(3):92.
CrossRef - Cha, Y., Jang, J.Y., Ban, YH. et al. Anti-atherosclerotic effects of perilla oil in rabbits fed a high-cholesterol diet. Lab Anim Res 32, 171–179 (2016). https://doi.org/10.5625/lar.2016.32.3.171
CrossRef - El-Sakhawy, M. A., Iqbal, M. Z., Gabr, G. A., Alqasem, A. A., Ateya, A. A. E.-S., Ahmed, F. A., El-Hashash, S. A., Ibrahim, H. S., & Abu El-Ghiet, U. M. (2023). The mechanism of action of Spirulina as antidiabetic: a narrative review. Italian Journal of Medicine, 17(2). https://doi.org/10.4081/itjm.2023.1639.
CrossRef - Hatami E, Ghalishourani SS, Najafgholizadeh A, Pourmasoumi M, Hadi A, Clark CCT, Assaroudi M, Salehi-Sahlabadi A, Joukar F, Mansour-Ghanaei F. The effect of Spirulina on T2DM: a systematic review and meta-analysis. J Diabetes Metab Disord. 2021 Mar 2;20(1):883-892. doi: 10.1007/s40200-021-00760-z. PMID: 34178867; PMCID: PMC8212345.
CrossRef - Mehdinezhad N, Aryaeian N, Vafa M, Saeedpour A, Ebrahimi A, Mobaderi T, Fahimi R, Sajadi Hezaveh Z. Effect of Spirulina and Chlorella alone and combined on the healing process of diabetic wounds: an experimental model of diabetic rats. J Diabetes Metab Disord. 2021 Jan 19;20(1):161-169. doi: 10.1007/s40200-020-00723-w. PMID: 34222063; PMCID: PMC8212205.
CrossRef - Prete V, Abate AC, Di Pietro P, De Lucia M, Vecchione C, Carrizzo A. Beneficial Effects of Spirulina Supplementation in the Management of Cardiovascular Diseases. Nutrients. 2024; 16(5):642. https://doi.org/10.3390/nu16050642
CrossRef

