
Manuscript accepted on :August 05, 2016
Published online on: --
Plagiarism Check: Yes
Sreeraj R1* and Raju G2
1Research Scholor, Baharathiyar University, Coimbatore, India.
2Department of IT, Kannur University, Kerala, India.
Corresponding Author E-mail: sreerajr@gmail.com
DOI : https://dx.doi.org/10.13005/bpj/1073
Abstract
The paper presents an automatic segmentation and classification of liver tumor segmentation in CT images. Computed Tomography (CT) is a standout amongst the most generous medical imaging modalities. CT images are extensively used for liver tumor diagnosis. The precise identification of liver tumor classification and segmentation is based on the accuracy. The decrease in sensitivity, specificity and positive predictive value (PPV) directly affects the accuracy of classification and segmentation. This paper mainly focuses on improving sensitivity, specificity and PPV using an enhanced gray level co-occurrence matrix (GLCM) method. The proposed method uses LiverCT image as a source which has been preprocessed and segmented using Adaptive Threshold Segmentation method. Using the region of interest selection, 13 texture features has been extracted using GLCM method and classification is achieved using SVM classifier. We have tested our proposed method with 100 images and a comparative analysis has been made with three classifiers such as support vector machine(SVM), KNN and Bayesian in which SVM performs better. The result also shows a promising increase in specificity and sensitivity while using SVM. The proposed method achieves 99.4% sensitivity, 99.6% specificity, 97.03% PPV and hence overall accuracy is 99.5% which shows a commendable identification rate of liver tumor.
Keywords
Computed Tomography (CT); Liver Segmentation; Specificity; Sensitivity; PPV; NPV; GLCM
Download this article as:| Copy the following to cite this article: Sreeraj R, Raju G. Increasing Sensitivity, Specificity and PPV for Liver Tumor Segmentation and Classification Using Enhanced GLCM. Biomed Pharmacol J 2016;9(3). |
| Copy the following to cite this URL: Sreeraj R, Raju G. Increasing Sensitivity, Specificity and PPV for Liver Tumor Segmentation and Classification Using Enhanced GLCM. Biomed Pharmacol J 2016;9(3). Available from: http://biomedpharmajournal.org/?p=9192 |
Introduction
Liver Tumor plays a major cause of death due to cancer. An accurate detection and proper segmentation of liver tumor from CT image is of high significance. Recent analysis and case studies area unit showing that medical image analysis could be a difficult task. In recent years liver segmentation from CT scans has been gained prime importance within the field of medical image processing since it is the primary and fundamental step of any machine-driven technique for the automatic liver tumor diagnosis, liver volume measure, and 2D-3D liver volume rendering[1]. In this paper a study regarding the semi-automatic and fully automatic liver segmentation techniques carried out, which reveals that automatic liver segmentation is still a challenge. A grey level threshold based liver segmentation method has been developed to address these challenges. Disseminated cancer accounts for most deaths due to malignancy. Hence recent research has focused on tumor development and progression at the primary stage. Recently, attention has shifted towards the field of tumor metastasis [2]. Several new and exciting concepts that have emerged in the past few years may shed light on this complex area. The established canonical theory of tumor metastasis, as a process emerging from a stepwise accumulation of genetic events fueled by somatic evolution in cancer, has been challenged. New declarations suggest that malignant cells can disseminate at a much earlier stage than previously recognized in tumor. These findings have direct relevance to clinical practice and shed new light on tumor biology. Gene-profiling studies support this explanation, suggesting that metastatic circulating tumor cells may be an innate property shared by the bulk of cells present early in a developing tumor mass. There is a growing recognition of the importance of host factors outside the primary stage in the development of metastatic disease. Current research has highlighted the important roles played by non-neoplastic host cells within the tumor microenvironment in controlling metastasis. These new concepts have wide-ranging suggestion for the importance of early stage detection of liver tumor.
Hence it is necessary to find out a clinical decision support system for detecting and diagnosing liver tumor. According to the survival statistics of American cancer society in 2015, the studies have shown that the patients having small liver tumor are resectable (Removable tumor ).It does not cause serious health problem or cirrhosis. Detection of early stage liver tumor can be helps to avoid a liver transplant[3].
The system has been planned in such a way that it resolves all the earliest drawback, and introduces an efficient clinical decision support system. The proposed methods includes segmentation, and Region Of Interest(ROI) based on feature extraction.
The major challenge in liver tumor segmentation and classification is to improve the accuracy. Recently there are various methods which are trying to achieve high sensitivity and high specificity. C. Brechbuhler et.al [4] proposes a novel 3D affine invariant shape parameterization who claims automatic liver and tumor segmentation. Even though the method uses support vector machine for classification, it achieves only less sensitivity because of small error and severe error during segmentation. Jian-Wu Xu et.al [5] developed an algorithm to extracts morphological and texture features from the candidate regions of hepatocellular carcinoma (HCC) using sequential forward floating selection method with linear discriminant analysis. This method selects eleven features which was able to eliminate only 48% of the false positive which leads to less specificity. A novel method has been proposed by Santanu Ghorai et.al[6] based on gene expression data using NPPC ensemble for cancer classification. This method achieves an accuracy of 91.82% while testing with liver cancer classification. Voxels classification methods[7] for liver tumor segmentation indicates an accurate efficient and robust results in variety of tumor types. The overlap error of 33.80% reduces heavily the sensitivity and specificity of tumor classification. The overlap error of 10.7% has also occurred in the method proposed by L. Rusko et.al [8]. The cognition network technology combines pixel processing techniques using a symantic knowledge base produces accurate results for fully automatic segmentation of liver[9]. The overlap error of the proposed method is 16.2 % which reduces the sensitivity. The ensemble segmentation algorithm can be applied to a liver lesion extraction problem effectively. The semi-automatic segmentation of liver metastases can be done with the help of spiral scanning, pixel classification and level sets techniques. Another approach of an interactive segmentation method based on watershed and graph cuts to extract liver tumor boundaries in 3D CT images is proposed. Inorder to eliminate erroneous segmentation, a knowledge based constraints is also applied for segmentation.[10],[11],[12],[13].
Proposed Method
The proposed system work on the liver CT images. Figure 1 explain the different sequential steps in the proposed method. For the purpose of processing convenience we first convert the DICOM image into JPEG image file format with lossless compression[14][15]. Preprocessing steps includes denoising by Gaussian filter, Image resizing and Dynamic thresholding for global contrast calculation.
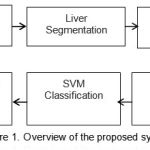 |
Figure 1: Overview of the proposed system |
Liver segmentation
Image segmentation plays an important role in medical image diagnosis. Through segmentation process we assign a label to each pixel in the liver CT image. After the image segmentation we get a different representation of image which is easier to analyze. In medical imaging field the liver segmentation using computer tomography data has gained a lot of importance. In our proposed work we use the adaptive threshold segmentation. It will segment the image based on threshold value. Initially we choose a gray-level T between the two dominant levels, which will serve as a threshold to distinguish the two classes (objects and background). Using this threshold, a new binary image can then be produced, in which objects are painted completely black, and the remaining pixels are white. For the original image f(x, y), the threshold product is achieved by scanning the original image, pixel by pixel, and testing each pixel against the selected threshold: if f(x, y) > T, then the pixel is classified as being a background pixel, otherwise the pixel is classified as an object pixel. This can be summarized in the following definition, where b(x, y) denotes the threshold binary image. In general, a threshold is produced for each pixel in the original image; this threshold is then used to test the pixel against, and produce the desired result (in our case, a binary image).According to this, the general definition of a threshold can be written a follows by refering [17],[18].
![]()
Where f(x, y) is the gray level of point (x, y) in the original image and p(x, y) is some local property of this point (we shall explain this shortly). When T depends only on the gray-level at that point, then it degenerates into a simple global threshold (like the ones described in the previous section). Special attention needs to be given to the factor p(x, y). This was described as a property of the point. In order to take into consideration the influence of noise or illumination, the calculation of this property is usually based on an environment of the point at hand. An example of a property may be the average gray-level in a predefined environment, the center of which is the point at hand. The key feature of this segmentation technique is to select the threshold value.
ROI and NON ROI selection
Currently medical imaging technology such as computer aided diagnosis method is used for diagnosis of the disease and medical operation. The available tool provide biomedical image having noise and fuzz. Diagnosis and analysis of the biomedical image become a challenging task. Only relevant data is considered to account for the processing that efficiently increase the speed.
In the proposed work we use ROI and non ROI selection .Based on the ROI the texture feature analysis takes place. ROI based GLCM feature extraction is better compared with previous methods. The generation of ROI s and non ROIs can used as the preprocessing method for any other segmentation technique. This ROI generation can make the next step image feature extraction faster.
Algorithm for ROI and Non ROI Selection
Read the input image
Resize the input image
Display the image
Get inputs from mouse, select 4 seed points in input image
Select polygonal region of interest from the image
Create Buffer of ROI
Create Buffer of Non ROI
Display ROI and Non ROI from the selected image
Feature extraction
The input image is larger in size and also the redundancy behavior exists dimensionality take place in feature extraction. Hence it is essential to reduce it into a group of feature. ROI based feature extraction using GLCM algorithm become very helpful for this . It is used to obtain the statistical information about the image such as entropy, energy, correlation and sum of the energy for the feature extraction.
A gray level co-occurrence matrix (GLCM) contains information about the positions of pixels having similar gray level values. A co-occurrence matrix is a two-dimensional array, P, in which both the rows and the columns represent a set of possible image values. A GLCM Pd[i, j] is defined by first specifying a displacement vector d=(dx, dy) and counting all pairs of pixels separated by d having gray levels i and j.
In the proposed system the texture features were extracted from the liver CT images using GLCM. Four directions( 0º, 45º, 90º and 135º degrees) has been selected for calculating the co-occurrence matrix. Using the above four directions 12 different statistical features were extracted, which are defined as Haralick texture descriptors, from each co-occurrence matrices. The texture features are Contrast, Correlation, Cluster prominence, Cluster shade, Dissimilarity, Energy, Entropy, Homogeneity, Maximum probability, Sum of squares ,Auto correlation & Inverse different Moment.
An enhanced gray level co-occurrence matrix (GLCM) contains information related to the positions of pixels having same gray level values present in the image. A co-occurrence matrix is a two-dimensional array(P),both the rows and the columns represent a set of possible image intensity values.
We define GLCM according to the following criteria:-
Where n [i,j] is the number of occurrences of the pixel values [i,j] at the distance d in the image.
The grey level co-occurrence matrix Pd has dimension n× n,where n is the number of gray levels present in the image.
From the co-occurrence matrix obtained and extracted 12 different statistical features
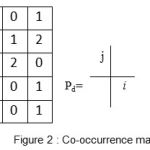 |
Figure 2: Co-occurrence matrix |
There are spatially separated 16 pairs of pixels in the image. Since there are only three gray levels, m[i,j,n] is a 3×3 matrix. where n is the number of GLCMs calculated usually due to the different orientation and displacements used in the algorithm. Usually the values i and j are equal to ‘NumLevels’ parameter of the GLCM computing function graycomatrix(). Note that matlab quantization values belong to the set {1,…, NumLevels} and not from{0,…,(NumLevels-1)}
The process of enhanced GLCM is proposed in the following Algorithm
Count all pairs of pixels in which the first pixel has a value i, and its matching pair displaced from the first pixel by d has a value of j.
This count is entered in the ith row and jth column of the matrix Pd[i,j]
Note that Pd[i,j] is not symmetric, since the number of pairs of pixels having gray levels [i,j] does not necessarily equal the number of pixel pairs having gray levels [j,i].
With the help of a fully vectorized method, a significant enhancement has occurred using the above algorithm.
Figure 3(a) and 3(b) shows the ROI and non ROI of selection in an image.
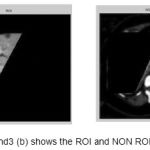 |
Figure 3 (a) and3 (b) shows the ROI and NON ROI image
|
Texture Features
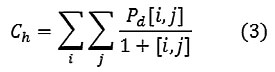
Contrast
Contrast is a measure of the local variations present in an image.
If there is a large amount of variation in an image the P[i, j]’s will be concentrated away from the main diagonal and contrast will be high (typically k=2, n=1).
Homogeneity
A homogeneous image will result in a co-occurrence matrix with a combination of high and low P[i,j]’s.
Where the range of gray levels is small the P[i,j] will tend to be clustered around the main diagonal. A heterogeneous image will result in an even spread of P[i,j]’s.
Entropy
Entropy is a measure of information content. It measures the randomness of intensity distribution.
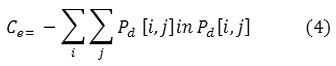
Such a matrix corresponds to an image in which there are no preferred gray level pairs for the distance vector d. Entropy is highest when all entries in P[i,j] are of similar magnitude, and small when the entries in P[i,j] are unequal.
Correlation
Correlation is a measure of image linearity.
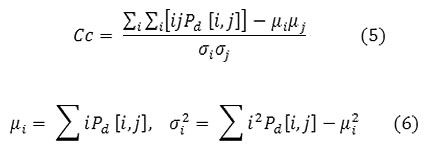
Correlation will be high if an image contains a considerable amount of linear structure.
Energy
One approach of generating texture features is to use local kernels to detect various types of texture [16]. After the convolution with the specified kernel, the texture energy measure (TEM) is computed by summing the absolute values in a local neighborhood
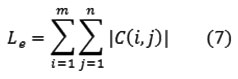
If n kernels are applied, the result is an n-dimensional feature vector at each pixel o the image being analyzed
Maximum Probability
This is simply the largest entry in the matrix, and corresponds to the strongest response. This could be the maximum in any of the matrices or the maximum overall.
![]()
Cluster Shade
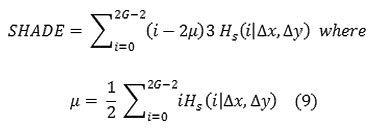
Local Homogeneity, Inverse difference moment(IDM)
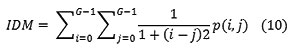
IDM is also influenced by the homogeneity of the image. Because of the weighting factor IDM will get small contributions from inhomogeneous areas. The result is a low IDM value for inhomogeneous images, and a relatively higher value for homogeneous images
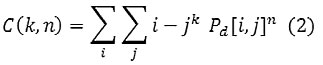
Sum of squares, variance
![]()
This feature puts relatively high weights on the elements that differ from the average value of P(i, j).
Cluster prominence

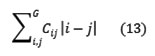
Dissimilarity
Autocorrelation
Other statistical approaches include an autocorrelation function, which has been used for analyzing the regularity and coarseness of texture by Kaizer. This function evaluates the linear spatial relationships between primitives. The set of autocorrelation coefficients shown below are used as texture features
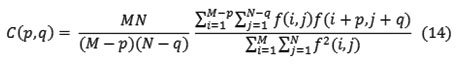
Where p, q is the positional difference in the i, j direction, and M, N are image dimensions.
Classification using SVM
Support Vector Machine, a linear classifier works on the principle of minimizing the bound on the error made by the learning machine over the test data which were not used during training, hence perform accurately for the images that even does not belong to the training sets. In the proposed method, we extract seven haralick texture features for separating the classes using hyper plane. The classification stage has two components, a training phase and testing phase. In the training phase, pixel features and their corresponding manual labels represent the input, and the obtained output is a model that uses the features to predict the corresponding label. This training phase needs to be done only once, since the model can then be used to classify new data. The input to the testing phase is a learned model and pixel features without corresponding classes, and the output of the testing phase is the predicted classes for the pixels based on their features.
Liver tumor segmentation
The purpose of segmentation is to partition the obtained image into meaningful region. A proposed Fuzzy C-Mean (FCM) method is a simple statistical feature comparison of pixel attributes that distinctively characterize the object those pixels constitute. The features employed by the proposed method encompass mean and standard deviation of gray scale measurements of pixel blocks. The values obtained from feature measurement are subject to two basic observations:
Image pixel colors are lighter than those of background in gray scale level, and
Pixels that differ slightly in mean value or standard deviation are considered belonging to the same object.
Using conventional statistical mean described by the following relation.
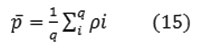
and the standard deviation
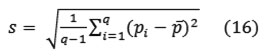
Where q denotes the number of pixels in each block. These statistics were utilized as the feature values of object pixel colors. However, it was found that gray scale feature values offered better discernable results than the RGB counterpart. As such, a color to gray scale conversion scheme was devised according to the following straightforward mapping.
Results and Disscussion
The classification algorithm decides the performance and accuracy which improves specificity, sensitivity and PPV. Hence the result analysis has been classified in to two parts. The first part will be focused on feature extraction and the later part will be focused on the analysis of specificity, sensitivity & PPV.
According to the this Region of Interest the features are extracted.
Results of ROI and Non ROI selection
Selecting the ROI and Non ROI region helps to improve the specificity, sensitivity & PPV. To achieve the same the user has to select four seed points which is the polygon of interest. Figure 3(a) and 3(b) shows the ROI and non ROI of selection in an image.
According to the this Region Of Interest the features are extracted.
Performance Evaluation
Table 1 : Testing features values of an image
| Measures | AC(%) | MCC(-1 to +1) |
| GLCM | 98 | 0.92 |
Results Using Enhanced GLCM
An enhanced Gray Level Co-occurrence Matrix(GLCM) has been used for feature extraction. We extract the information from the image as feature vectors in feature space. Here texture based features are extracted using enhanced GLCM. They are Contrast, Correlation, Clusterprominence, Clustershade, Dissimilarity ,Energy ,Entropy, Homogeneity, Maximum probability, Sum of squares ,Auto correlation and Inverse different Moment. This texture features are statistical information of an image. The Table I shows the testing and training feature of a sample image in the database. The features extracted are fed in to the classification algorithm to identify the abnormality.
To analyze the performance of the proposed system to detect the tumors, the images obtained are compared with its corresponding ground truth images. A number of different measures are used to evaluate the performance. These measures includes classification accuracy (AC) and Mathews Correlation Coefficient (MCC) which are calculated from confusion matrix.
MCC is used to measure the quality of binary classification. The MCC can be calculated from the confusion matrix using the formula. It returns a value from -1(inverse prediction) to +1(perfect prediction)
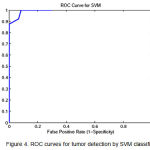 |
Figure 4: ROC curves for tumor detection by SVM classifier
|
To show the overall performance, we plot the ROC curves for all the three classifiers(SVM, KNN, Baysien). From the Figure 4 we can see that SVM classifier performs better which dominates KNN and Bayesian classifier which is shown in Figure 5 & 6.
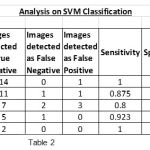 |
Table 2 |
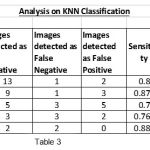 |
Table 3 |
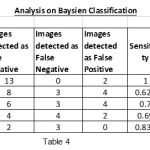 |
Table 4 |
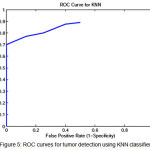 |
Figure 5: ROC curves for tumor detection using KNN classifier |
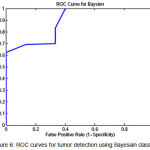 |
Figure 6: ROC curves for tumor detection using Bayesian classifier
|
A set of support vectors can uniquely define the maximum margin hyper plane for the learning problem. Here we concluded that SVM gives the better classification accuracy than KNN and Bayesian. Our resulting SVM performance accuracy is 84.62%. Figure 7(a) and 8(a) are the samples images and Figure 7(b) and 8(b) are the extraction of tumor area using FCM(Fuzzy-C-Means) tumor segmentation.
We have tested our proposed algorithm in the images obtained from two local hospitals in Kerala which achieves 99.4 % sensitivity, 99.6 % specificity and 99.07% PPV. Labelling of ground truth and normal images are marked by radiologist which consists of 100 images.
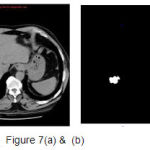 |
Figure 7(a) and (b) |
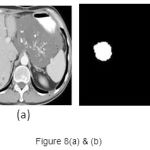 |
Figure 8(a) and (b)
|
Conclusion
In this paper, a new approach for the segmentation and classification of liver tumor has been proposed. It helps the physician and radiologist for liver tumor detection and diagnosis for tumor surgery. The technique improves significantly in the segmentation of large tumor and reduces false tumor detection .The proposed system achieves good performance than manually and automatically measured tumor burdens. This proposed computer aided automation system for liver tumor segmentation and classification achieves 99.4% sensitivity, 99.6% specificity, 97.03% positive predictive value and 99.5% overall accuracy.
References
- Marius George Lingararu, William J Richbourg, “Tumor burden analysis on Computed Tomography by automated liver and tumor segmentation,” IEEE Transaction on Medical Imaging, Vol.31 No 10, October 2012
- Caroline Coghlin, Graeme, “Current and emerging concepts in tumor metastasis”, Journal of Pathology j Pathol 2010;222: 1-15
- Rebecca L. Siegel, MPH,Kimerly D. Miller, “Cancer Statistics-2015” A Cancer Journal for Clinicians”, CA Cancer J CL IN 2015;65:5-29.
- C. Brechbuhler, G. Gerig, and O. Kubler, “Parameterization of closedsurfaces for 3-D shape descriptor,” Comput. Vis. Image Understand.,vol. 61, no. 2, pp. 154–170, 1995
- Jian-Wu Xu, Kenji Suzuki, “Computer Aided Detection of Hepatocellular Cacinoma in Hepatic CT:False Positive Reduction with Feature Selection, 2011 IEEE International Symposium on Biomedical Imaging: From Nano to Macro
- Santanu Ghorai, Anirban Mukherjee “ Cancer Calssification from Gene Expression Data by NPCC Ensemble”, “IEEE Transactions on Computational Biology and Bioinoformatics, Vol 8, No3 May 2011
- Moti Freiman, Ofir Cooper,”Liver Tumors Segmentation from CTA Images using Voxels Classification and Infinity Constraint Propagation”, International Journal of Computer Assisted Radiology and Surgery, March 2011, Vol 6, Issue 2,pp247-255
- Laszlo Rusko, Gyorgy Bekes, ”Fully automatic Liver Segmentation for Contrast-Enhanced CT Images”,3D Segmentation in the Clinic:A Grand Challenge,pp. 143-150, 2007.
- Gunter Schmidt, Maria Athelogou,”Cognition Network Technology for a Fully Automatic 3D Segmentation of Liver”,3D Segmentation in The Clinic:A Grand Challnge, pp. 125-133, 2007
- Akinobu Shimuzu, Takuya Narihira,”Ensemble Segmentation using AdaBoost with application to liver lesion extraction from a CT volume”, Proc. MICCAI Workshop on 3D Segmentation in the Clinic: A Grand Challenge II., NY, USA. 2008.
- Dirk Smeets, Bert Stijnen,”Segmentation of liver metastases using a level set method with spiral scanning techniques and supervised fuzzy pixel classification”, MICCAI Workshop. Vol. 42. 2008
- Jean Stawiaski, Etienne Decenciere,”Interactive Liver Tumor Segmentation Using Graph-cuts and watershed”, Liver Tumor Segmentation Challenge. MICCAI, New York, USA. 2008.
- Nader H, Mohiy M,”A novel fully automatic technique for liver tumor segmentation from CT scans with knowledge-based constraints”, Intelligent Systems Design and Applications (ISDA), 2010 10th International Conference on. IEEE, 2010
- Aaron W. C. Kamauu, Scott L.DuVall, “Using Applet-Servlet Communication for optimizing Window, Level and Crop for DICOM to JPEG Conversion” , Journal of Digital Imaging, Vol 21, No 3(September),2008;pp 348-354
- Dandu Ravi Varma, “Managing DICOM images: Tips and tricks for the radiologist”, Indian J Radiol Imaging, 2012 Jan-Mar 22(1):4-13
- R. M. Haralick, K. Shanmugam, and I. Dinstein, “Texture features for image classification,” IEEE Trans. Syst., Man Cybern., vol. 3, no. 6,pp. 610–621, Nov. 1973.
- Moltz, Jan Hendrik, et al. “Segmentation of liver metastases in CT scans by adaptive thresholding and morphological processing.” MICCAI Workshop. Vol. 41. No. 43. 2008.
- Abdel-massieh, Nader H., Mohiy M. Hadhoud, and Khalid M. Amin. “A novel fully automatic technique for liver tumor segmentation from CT scans with knowledge-based constraints.” 2010 10th International Conference on Intelligent Systems Design and Applications. IEEE, 2010.

