
Manuscript accepted on :April 13, 2016
Published online on: 28-04-2016
Plagiarism Check: Yes
Said Al-Dalaen1, Aiman Al-Qtaitat2*, Mohammad Al-Rawashdeh3, Jihad Alzyoud4 and Aiman Al-Maathadi2
1Department of Pharmacology, Faculty of Medicine, Mutah University, Karak, Jordan. 2Department of Anatomy and Histology, Faculty of Medicine, Mutah University, Karak, Jordan. 3Department of Orthopaedic Surgery, Alkarak Governmental Hospital, Karak, Jordan. 4Department of Medical Laboratory Sciences, Faculty of Allied Health Sciences, Hashimite University, Zarqa, Jordan. Correspondent Author Email : aimanaq2000@yahoo.com
DOI : https://dx.doi.org/10.13005/bpj/903
Abstract
The aim of the present study was to measure the serum concentrations of specific cartilage and bone biomarkers reflecting tissue turnover, particularly hyaluronic acid and cartilage oligomeric matrix protein, to investigate disease activity. The study included 60 patients of rheumatoid arthritis with age range 43-66 years; thirty patients were rapid erosive patients and thirty were slow erosive, compared to twenty matched normal population with age range 46-63 years. All individuals enrolled in the study were subjected to full history taking, clinical examination and necessary laboratory investigation. The study showed significantly (P<0.0001) higher values of hyaluronic acid, cartilage oligomeric matrix protein and erythrocyte sedimentation rate in slow and rapid erosive arthritic patients versus the controls. A significant positive correlation between serum levels of tests, which have been used in this study. Also, there was a significant positive correlation between serum levels of acid and cartilage oligomeric matrix protein (r =0.788, P<0.0001), the test sensitivity was 82.5% and specificity was 100% at a cutoff point (79.5 ng/ml) for serum levels of arthritis in arthritic patients, while, the test sensitivity was 94.4% and specificity was 100% at a cutoff point (20.5 μg/ml) for serum levels of cartilage oligomeric matrix protein in arthritic patients. The measurement of some serological biomarkers as hyaluronic acid and cartilage oligomeric matrix protein that reflect bone and cartilage destruction in arthritic patients could be used to investigate disease activity and increase the knowledge of the basic pathophysiology of joint disease.
Keywords
Rheumatoid arthritis; Hyaluronic acid; Cartilage oligomeric matrix protein; C-reactive protein; Rheumatoid factor
Download this article as:| Copy the following to cite this article: Al-Dalaen S, Al-Qtaitat A, Al-Rawashdeh M, Alzyoud J, Al-Maathadi A. Rheumatoid Arthritis: Hyaluronic Acid and Cartilage Oligomeric Matrix Protein as Predictors of the Disease Progression. Biomed Pharmacol J 2016;9(1) |
| Copy the following to cite this URL: Al-Dalaen S, Al-Qtaitat A, Al-Rawashdeh M, Alzyoud J, Al-Maathadi A. Rheumatoid Arthritis: Hyaluronic Acid and Cartilage Oligomeric Matrix Protein as Predictors of the Disease Progression. Biomed Pharmacol J 2016;9(1).Available from: http://biomedpharmajournal.org/?p=6871 |
Introduction
Arthritis is a long standing debilitating disorder that results in severe pain, impairment and disability among patients having injury to the cartilage, synovium, and bone of the affected joints1. Existing methods to diagnose and monitor the disease are based on late clinical manifestations of arthritis. However, recent development of successful treatments for rheumatoid arthritis (RA) and osteoarthritis has made it imperative to identify prognostic factors disease. Therefore, the treatments can be started rapidly in order to slow down the progression of the disease1.
A possible approach to monitor arthritis is the estimation of biomarkers of cartilage repair and degradation to reflect variations in joint remodeling. One such potential biomarker is cartilage oligomeric matrix protein (COMP)2, which is also known as thrombospondin 5. It is 524 kDa homopentameric extracellular matrix glycoprotein member of the thrombospondin family of calcium binding proteins with five identical subunits3. The function of COMP remains unclear; however, it may have a structural role in endochondral ossification and in the assembly and stabilization of extracellular matrix by its interaction with collagen fibrils and matrix components4. COMP was initially detected in serum and synovial fluid of patients suffering from rheumatoid disorders, such as RA, reactive arthritis, juvenile chronic arthritis and osteoarthritis (OA)5. Serum concentrations of COMP are initially elevated in patients with early RA who later develop extensive joint destruction, which suggested that the disease pathogenesis is characterized by abnormal turnover of that protein in these patients6.
Hyaluronic acid (HA), is a glycosaminoglycan formed from alternating units of N-acetyl glucosamine and glucuronic acid7. It is a constituent of synovium and cartilage and is thought to contribute to the lubricating mechanisms of synovial fluid. Local increased production of HA has been demonstrated in inflamed synovium from patients with RA, OA reactive arthritis, and ankylosing spondylitis8. Serum levels of HA have to be increased in individuals with liver disease9, cancer10, hypothyroidism11, psoriasis with or without arthropathy12. Thus, the aim of the study is to measure the serum concentrations of specific cartilage and bone molecules reflecting tissue turnover, as HA and COMP to investigate disease activity.
Materials and Methods
The study included 80 human subjects; they were classified into 2 main groups. Group A included 60 RA patients attending Orthopedic Surgery Department, Al-Karak Governmental Hospital, who all fulfilled the American College of Rheumatology 1987 criteria for RA [13], with age range 43-66 years; it included 32 females and 28 males. The median disease duration is 2.67 years (range 1-5 years), disease onset was defined as the time of onset of joint symptoms according to history at the initial visit to the Orthopedic Surgery Department outpatient Clinic. This group was subdivided into two subgroups according to radiographic examination using the Larsen method according to Petterson [14]. Group A1 included 30 patients who showed significant erosive disease of the knee joints (rapid erosive group). Group A2 included 30 patients without rapidly progressive disease (slow erosive group). Group B has included 20 healthy volunteers. The informed written consent was obtained from each patient and each subject of the control group. The experiments were conducted according to the ethical forms approved by the Faculty of Medicine Ethics Committee in Mutah University.
Medical history and clinical examination of all patients and controls were obtained. The following manifestations were recorded for each one of the RA patients: number of swollen joints, number of tender joints, patient’s assessment of pain on a visual analogue scale (VAS) and patient’s assessment of disease activity on a VAS. Disease activity score (DAS) were calculated with assessment of swollen and tender joints using 28-points joint counts [15]. Patients with liver diseases, hypothyroidism, chronic renal diseases, OA and psoriasis were excluded from the study.
Hands, wrists and feet of the 30 RA patients were examined radiographically and graded using Larsen method; according to Petterson [14, 16], without the knowledge of their clinical data. That method is based on comparisons with standard radiographs, where 0 denotes a radiographically normal joint and 5 denotes the one with maximum degree of joint destruction. A theoretical range of values from 0 to 200 were used to grade these joints. All of the following laboratory investigations were obtained, including serum levels of COMP, HA, ultrasensitive C-reactive protein (CRP), erythrocyte sedimentation rate (ESR) and the determination of rheumatoid factor titer.
5 ml of venous blood was collected from each fasting participant in the study in a plain tube and serum was separated in aliquots after centrifugation and stored at –70oC for analysis of the following parameters:
HA using enzyme-linked binding protein assay that used a capture molecule known as hyaluronic acid binding protein17.
Serum COMP levels was measured using Enzyme-linked immunosorbent assay (ELISA)18.
Rheumatoid factor titer was determined using RF-latex which is a slide agglutination test for the quantitative and semi-quantitative detection of RF in human serum. Latex particles coated with human gamma globulin were agglutinated when mixed with samples containing RF19.
ESR was determined according to Westergreen method and Ultrasensitive CRP. It was estimated by latex enhanced immunoturbidimetric method, where CRP causes agglutination of the latex particles coated antihuman CRP, the agglutination of the latex particles is proportional to CRP concentration20.
The obtained data was analyzed using SPSS 16 software package. Differences between groups were calculated by Mann-Whitney’s test for unpaired variables. Data were expressed as mean±SD. Differences between the three groups were compared by means of ANOVA test. Correlations were calculated by Spearman’s correlation coefficient. P values <0.05 were considered significant. Assessment of optimal cutoff points was made using receiver operating characteristic curve (ROC)21.
Results
There are significantly higher values of HA, COMP, CRP and ESR in the group of RA patients (rapid and slow erosive) when compared to the controls (Table 1). There are no significant differences in the number of patients, gender, the duration of RA disease, DAS and RF status between group A1 and A2 (Table 2). However, there is a statistically significant difference regarding the age of the patients between the two groups. Additionally, patients who had rapid erosion (group A1) have a significant higher Larsen score than those with the slow erosion (group A2). There are significantly higher values of HA, COMP, CRP and ESR in the slow erosive group of RA patients (group A2) when compared to the controls (Table 3). HA, COMP, CRP and ESR showed significant increase in the rapid erosive group of RA patients (group A1) when compared to the controls (Table 4).
Table 1: Serum levels of HA, COMP, CRP and ESR in RA patients group (rapid and slow erosive groups) (group A1+A2) versus the controls (group B)
| Parameters | RA patients (group A1+A2) | Controls (group B) | P |
| HA (ng/ml) | 106.8±5.06 | 29.4±3.95 | <0.0001 |
| COMP (μg/ml) | 24.07±7.14 | 10.7±1.42 | <0.0001 |
| CRP (mg/l) | 38.87±6.49 | 2.95±0.52 | <0.0001 |
| ESR (mm/1h) | 28.52±5.93 | 9.95±1.51 | <0.0001 |
Table 2: The characteristics of the patients (rapidly erosive versus slowly erosive)
| Slow erosive group of RA
patients (group A2) |
Rapid erosive group of RA
patients (group A1) |
P | |
| Number of patients (female/male) | 30 (17/13) | 30 (15/15) | >0.05 |
| Age at disease onset (years) | 54±5.3 | 48±3.7 | <0.001 |
| Duration of disease (years) | 2.7±0.88 | 2.3±0.75 | >0.05 |
| RF positivity no. (%) | 19 (63.33) | 21 (70%) | >0.05 |
| Larsen score (0-200) | 7.8±3.31 | 21.6±5.28 | <0.001 |
| DAS (0-10) | 2.9±0.73 | 3.3±0.84 | >0.05 |
Table 3: Serum levels of HA, COMP, CRP and ESR in the slow erosive group of RA patients versus the controls
| Parameters | Slow erosive RA patients (group A2) | Controls (group B) | P |
| HA (ng/ml) | 46.53±3.49 | 29.4±3.95 | <0.0001 |
| COMP (μg/ml) | 19.37±2.76 | 10.7±1.42 | <0.0001 |
| CRP (mg/l) | 10.39±1.22 | 2.95±0.52 | <0.0001 |
| ESR (mm/1h) | 24.70±2.85 | 9.95±1.51 | <0.0001 |
Table 4: Serum levels of HA, COMP, CRP and ESR in the rapid erosive group of RA patients versus the controls
| Parameters | Rapid erosive RA patients (group A1) | Controls (group B) | P |
| HA (ng/ml) | 152.74±37.47 | 29.4±3.95 | <0.0001 |
| COMP (μg/ml) | 30.77±3.62 | 10.7±1.42 | <0.0001 |
| CRP (mg/l) | 53.73±8.07 | 2.95±0.52 | <0.0001 |
| ESR (mm/1h) | 46.33±6.25 | 9.95±1.51 | <0.0001 |
When comparing HA, COMP, CRP and ESR in the rapid erosive group of RA patients (group A1) and the slow erosive group of RA patients (group A2) they showed significant increase Table 5). There are significant positive correlations between serum levels of HA, COMP with the age, disease duration, Larsen score, DAS, CRP and ESR (Table 6). There was a significant positive correlation between serum levels of HA and COMP (r= 0.788, P<0.0001) (Table 7 and Figure 1). As shown in Table 8 the sensitivity and specificity test for serum COMP levels were 94.4% and 100%, respectively, at cutoff value of (20.5 µg/ml), while, they were 82.5% and 100%, respectively for serum levels of HA at cutoff value of (79.5 ng/ml) (Figure 2 and 3).
Table 5: Serum levels of HA, COMP, CRP and ESR in the rapid erosive group of RA patients versus the slow erosive group of RA patients
| Parameters | Rapid erosive RA patients (group A1) | Slow erosive RA patients (group A2) | P |
| HA (ng/ml) | 152.74±37.47 | 46.53±3.49 | <0.0001 |
| COMP (μg/ml) | 30.77±3.62 | 19.37±2.76 | <0.0001 |
| CRP (mg/l) | 53.73±8.07 | 10.39±1.22 | <0.0001 |
| ESR (mm/1h) | 46.33±6.25 | 24.70±2.85 | <0.0001 |
Table 6: Correlations between serum concentrations of HA and COMP and patients characters, CRP and ESR
| HA (ng/ml) | COMP (μg/ml) | |||
| r | P | r | P | |
| Age of patients (years) | 0.361 | <0.05 | 0.476 | <0.05 |
| Duration of disease (years) | 0.394 | <0.05 | 0.502 | <0.05 |
| Larsen score | 0.795 | <0.01 | 0.660 | <0.01 |
| DAS | 0.627 | <0.01 | 0.727 | <0.01 |
| CRP (mg/l) | 0.948 | <0.01 | 0.776 | <0.01 |
| ESR (mm/1h) | 0.914 | <0.01 | 0.762 | <0.01 |
Table 7: correlation between serum concentrations of HA and COMP in the patients group (slow erosive and rapid erosive)
| HA (ng/ml) | COMP (μg/ml) | r= 0.788 | P<0.0001 |
Table 8: Cutoff values, sensitivity and specificity of HA and COMP in RA patients
| HA (ng/ml) | COMP (μg/ml) | |
| Cutoff | 79.50 | 20.50 |
| Sensitivity | 82.5% | 94.4% |
| Specificity | 100% | 100% |
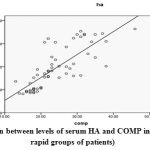 |
Figure 1: The correlation between levels of serum HA and COMP in RA patients (slow and rapid groups of patients) |
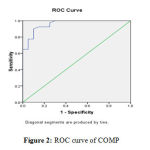 |
Figure 2: ROC curve of COMP |
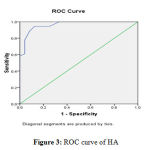 |
Figure 3: ROC curve of HA |
Discussion
It is unclear that joint destruction, which is the main character of RA, progresses slowly in some patients and causes little tissue derangement; whereas in other cases, extensive destruction occurs within a few years after the disease onset22. However, the present study demonstrated that there are no significant differences in the number of patients, gender, duration of RA, DAS and RF status in the rapid erosive and slow erosive patient groups. On the contrary, there is a significant difference concerning the age of patients. Also, the patients who had rapid erosion have a significant higher Larsen score than the patients with slow erosive changes. On the other hand, Majeed et al.23 and Young et al.24 have reported that there were no significant differences in gender, age of the patients, disease duration, RF positivity and DAS.
The use of immuno as says for the quantification of cartilage and bone molecules, which enters the circulation as part of tissue turnover that occur in RA has reflected the changes in metabolism of extracellular matrix in these tissues22. The obtained results in this study showed a significant increase in serum levels of HA in RA patients compared to the control group, the test sensitivity was 82.5% and specificity was 100% at a cutoff point (79.5 ng/ml), the levels of HA were significantly higher in the rapid erosive group of patients than in the slow erosive group, these results were in agreement with those of Majeed et al.23 and Santos et al.25, who suggested that an increased systemic level might act as an early indicator of structural damage and hence provide a useful prognostic marker. It was reported that HA is produced locally by cells of the extracellular matrix26, the degeneration and turnover of the extracellular matrix result in release of HA and HA fragments into the systemic circulation. Increased production and release of HA from arthritis joints are thought to reflect the localized inflammation of the synovial lining and, to a lesser extent, to cartilage degradation. Furthermore, it has been postulated that the levels of HA were higher in RA patients than in asymptomatic donors27. These results also, go with those of Pothacharoen et al28 who suggested that RA may be detected systemically according to these results.
As illustrated above, RA patients showed a significant increase in the levels of COMP compared to the controls, the test sensitivity was 94.4% and specificity was 100% at a cutoff value of (20.50 μg/ml). Additionally, the estimation of serum COMP showed significant higher levels in the rapid erosive group compared to the slow erosive group of patients; which agrees with the results obtained by both Poole29 and Bengt et al.22. Increased levels of COMP in RA could be used as a potential marker for measuring articular cartilage damage5 or it could reflect cartilage turnover [4, 31]. Similarly, Syversen et al2 have reported that COMP and other cartilage and bone biomarkers will serve as more useful prognostic markers than current predictors such as anti-cyclic citrullinated peptide (ACCP), early radiologic damage in the disease course, and signs of inflammation.
CRP and ESR were increased in RA patients compared to controls, and they were significantly higher in the rapid erosive group of patients versus the slow erosive group. In the present study, significant correlations between serum levels of HA and age of the patients at disease onset, disease duration, DAS and Larsen score were detected and found in accordance with those obtained by Emlen et al.32. Also, a significant positive correlation was detected between serum levels of HA and the levels of CRP and ESR, which supported the correlation between joint and systemic inflammation. Majeed et al.23 demonstrated that HA serum levels are correlated with measures of disease activity including swollen joint count, tender joint count and pain VAS. However there is a strong positive correlation with laboratory indices of disease activity (ESR and CRP) rather than with the clinical indices of the disease.
The findings in our results detected, significant correlations between serum levels of COMP and age of the patient at the time onset of the disease, disease duration, DAS and Larsen score. A high clinical disease activity (DAS) was correlated with high COMP values in serum and synovial fluid and with increasing proteolytic activity33, 34; the increase in turnover of cartilage matrix in joint inflammation may explain that correlation. These results were in consistence with those obtained by Skoumal et al31 and De Jong et al35 who found positive correlations between serum levels of COMP and Larsen score & DAS.
COMP was correlated with the radiographic progression, progressed radiographically RA showed elevated serum levels of COMP compared to those where the disease remain radiographically stable36, The present findings showed significant positive correlations between serum levels of COMP and the levels of CRP and ESR, those results go with those of Momohara, et al37, Soderlin et al38 and Fujikawa et at39, who reported that serum levels of COMP correlated with ESR and CRP, which are indicators of the acute phase response. These findings have suggested that serum levels of COMP may reflect cartilage destruction. Serum COMP was found to be a specific marker for the cartilage degradation in RA and not related to the nonspecific inflammatory processes, as there was a significant difference in the levels of COMP when compared to the patients with other inflammatory rheumatic diseases with less cartilage-destructive arthritis40. Moreover, in the present study, the obtained results revealed a significant positive correlation between serum levels of HA and COMP.
It could be concluded that the measurement of some serological biomarkers as HA and COMP that reflect bone and cartilage destruction in RA patients, could be used to investigate disease activity and increase the knowledge of the basic pathophysiology of joint disease. It can be predicted that the possibility of evaluating HA and COMP serum levels, commonly used as routine laboratory investigations, is helpful to estimate their clinical utility as prognostic biomarkers and monitor the response to therapy among RA patients.
References
- Tseng S, Reddi AH, DiCesare PE. Cartilage oligomeric matrix protein (COMP): a biomarker of arthritis. Biomarke Insights 2009 17(4): 33-44
- Syversen SW, Goll GL, Van Der Heijde D, Landewe R, Gaader PI, Odegard S, Haavardsholm EA, Kvien TK. Cartilage and Bone biomarkers in Rheumatoid Arthritis: Prediction of 10-year Radiographic Progression. J. Rheumatol 2009 36(2): 266-272.
- Bjornhart B, Juul A, Nielsen S, Zak M, Svenningsen P, Muller K. Cartilage oligomeric matrix protein in patients with juvenile idiopathic arthritis: relation to growth and disease activity. J. Rheumatol 2009 36(8): 1749-1754.
- Posey KL, Hecht JT. The role of cartilage oligomeric matrix protein (COMP) in skeletal disease. Curr. Drug Targets 2008 9(10):869-877.
- Morozzi G, Fabbroni M, Bellisai F, Pucci G, Galeazzi M. Cartilage oligomeric matrix protein level in rheumatic diseases: potential use as a marker for measuring articular cartilage damage and/or the therapeutic efficiency of treatments. Ann. N. Y. Acad. Sci 2007 1108:398-407.
- Nikolaisen C, Rekving OP, Nossent HC. Diagnostic impact of contemporary, biomarkers assays for rheumatoid arthritis. Scand. J. Rheumatol 2007 36(2): 97-100.
- Das S. Hayluronic acid in rheumatoid arthritis: some facts. J. Chin. Med. Assoc 2008 71(11): 601
- Kogan G, Soltes L, Stern R, Gemeine P. Hayluronic acid: a natural biopolymer with a broad range of biomedical and industrial applications. Biotechnol. Lett 2007 29(1): 17-25
- McHutchison JG, Blatt LM, Medina Measurement of serum hyaluronic acid in patients with chronic hepatitis C and its relationship to liver histology. J. Gastroentrol. Hepatol 2000 15:945-951.
- Wilkinson CR, Bower LM, Warren C. The relation between hyaluronidase activity and hyaluronic acid concentration in sera from normal controls and from patients with disseminated neoplasm. Clin. Chim. Acta 1996 256:165-173.
- Faber J, Horslev-Peterson K, Perrild H, Lorenzen I. Different effects of thyroid disease on serum levels of procollagen III N-peptide and hyaluronic acid. J. Clin. Endocrinol. Metab 1990 1:1016-1021
- Lundin A, Engstrom-Laurent A, Hallgren R, Michaelsson G. Circulating hyaluronate in psoriasis.Br. J. Dermatol 1985 112:663-671
- Arnett FC, edworthy SM, Bloch DA, McShane DJ, Fries JF, Cooper NS, et al. The American Rheumatism Association 1987 revised criteria for the classification of rheumatoid arthritis. Arthritis Rheum 1988 31:315-324.
- Larsen A, Dale Kand, Eek M. Radiographic evaluation of rheumatoid arthritis and related conditions by standard reference films. Acta. Radiol. Diagn 1977 18(4): 481-491.
- Prevoo ML, Van T, Hof MA, Kuper HH, Van Leeuwen MA, Van depute LB, Van Rief PL. Modified disease activity scores that include twenty eight joint counts: development and validation in a prospective longitudinal study of patients with rheumatoid arthritis. Arthritis Rheum 1995 38:44-48.
- Wollheim FA, Petterson H, Saxne T, Sjoblom KG. Radiographic assessment in relation to clinical and biochemical variables in rheumatoid arthritis. Scand. J. Rheumatol 1988 17(6):445-453.
- Plevris JN, Haydon GH, Simpson KJ. Serum hayluronan-a non-invasive test for diagnosing liver cirrhosis. Eur. J. Gastro & Hepatology 2000 12:1121-1127.
- Saxne T, Heinegard D. Cartilage oligomeric matrix protein: a novel marker of cartilage turnover detectable in synovial fluid and blood. BR. J. Rheumatol 1992 31:583-591.
- Wolfe F. Arthritis and rheumatism. 1991 34:951-960.
- Roberts W, Moulton L, Low T, Farrow G, Cooper S, Rifai N. Evaluation of nine automated high sensitive C-reactive protein methods: Implications for clinical and epidemiological applications. Partz. Clin. Chem 2001 47:418-425
- Zweig MH, Campbell G. Receiver-operating characteristic (ROC) plots: a fundamental evaluation tool in clinical medicine. Clin. Chem 1993 39:561-577
- Bengt M, Dennis C, Mauro A, Mirela I, Lawrence R, Robin P, Dick H, Tore S. Cartilage and bone metabolism in rheumatoid arthritis: Differences between rapid and slow progression of disease identified by serum markers of cartilage metabolism. J. Clin. Invest 1995 95(3): 1071-1077.
- Majeed M, McQueen F, Yeoman S, Mclean L. Relationship between serum hyaluronic acid level and disease activity in early rheumatoid arthritis. Ann. Rheum. Dis 2004 63:1166-1168.
- Young-Min S, Cawston T, Marshall N, Coady D, Christgau S, Saxne T, Robins S, Griffith I. Biomarkers predict radiographic progression in early rheumatoid arthritis and perform well compared with traditional markers. Arthritis Rheum 2007 56(10):3236-3247
- Santos ME, Kondo T, Wieczorek A, Lopez LR. Increased serum hyaluronic acid levels in rheumatoid arthritis. Arthritis and Rheumatism 1994 37:S247-252.
- Elliott AL, Kraus VB, Luta G, Stabler T, Renner JB, Woodard J, Dragomir AD, Helmick C. G, Hochberg MC, Jordan JM, Serum hyaluronan levels and radiogaraphic knee and hip osteoarthritis in African American and Caucasians in the Johnston Country Osteoarthritis Project. Arthritis and rheumatism 2005 52(1):105-111.
- Chubinskaya S, Frank BS, Michalska M, Kumar B, Merrihew CA, Thonar EJ, Lenz ME, Otten L, Rueger DC, Block JA. Osteogenic protein 1 in synovial fluid from patients with rheumatoid arthritis or osteoarthritis: relationship with disease andlevels of hyaluronan and antigenic keratan sulfate. Arthritis Res. Ther 2006 8(3):73.
- Pothacharoen P, Teekachunhatean S, Louthrenoo W, Yingsung W, Ong-Chai S, Hardingham T, Kongtawelert P. Raised chondroitin sulfate epitopes and hyaluronan in serum from rheumatoid arthritis and osteoarthritis patients. Osteoarthritis Cartilage 2006 14(3):299-301
- Poole AR. Immunochemical markers of joint inflammation, where are we now? Ann. Rheum. Dis 1994 53:3-5
- Skoumal M, Kolarz G, Klingler A. Serum levels of cartilage oligomeric matrix protein. A predicting factor and a valuable parameter for disease management in rheumatoid arthritis. Scand. J. Rheumatol 1996 23(3):156-161.
- Emlen W, Niebur J, Flanders G, Rutledge J. Measurement of serum hyaluronic acidin patients with rheumatoid arthritis: correlation with disease activity. J. Rheumatol 1996 23(6):278-284.
- Wislowska M, Jablonska B. Serum cartilage oligomeric matrix protein (COMP) in rheumatoid arthritis and knee osteoarthritis. Clin. Rheumatol 2005 24(3):278-284
- Marti C, Neidhart M, Gerber T, Hauser N, Michel BA, Hauselmann HJ. Cartilage oligomeric cartilage protein (COMP): the role of of a non-collagen cartilage matrix protein as a marker of disease activity and joint destruction in patients with rheumatoid arthritis and osteoarthritis. Z. Rheumatol 1999 58(2):79-87.
- De Jong Z, Munneke M, vilim V, Zwinderman AH, Kroon HM, Ronday HK, Lems WF, Dijkmans BA, Breedveld FC, Vliet Vlieland TP, Hazes JM, Degroot J. Value of serum cartilage oligomeric matrix protein as a prognostic marker of large joint damage in rheumatoid arthritis data from the RAPTT study. Rheumatology (Oxford) 2008 47(6):868-871.
- Lindqvist E, Eberhardt K, Bendtzen K, Heinegard D, Saxne T. Prognostic laboratory markers of joint damage in rheumatoid arthritis. Ann. Rheum. Dis 2005 64:196-201.
- Momohara S, Yamanaka H, Holledge MM, Mizumura T, Ikari K, Okada N, Kamatani N, Tomatsu T. Cartilage oligomeric matrix protein in serum and synovial fluid of rheumatoid arthritis: potential use as a marker for joint cartilage damage. Mod. Rheumatol 2004 14(5):356-360
- Soderli MK, Kastbom A, Kautiainen H, Leirisalo-Repo M, Strandberg G, Skogh T. Antibodies against cyclic citrullinated peptide (CCP) and levels of cartilage oligomeric matrix protein (COMP) in very early arthritis: relation to diagnosis and disease activity. Scand. J. Rheumatol 2004 33(3):185-188
- Fujikawa K, Kawakami A, Tamai M, Uetani M, Takao S, Arima K, Iwamoto N, Aramaki T, Eguchi K. High serum cartilage oligomeric matrix protein determines the subset of patients with early-stage rheumatoid arthritis with high serum C-reactive protein, matrix metalloproteinase-3, and MRI-proven bone erosion. J. Rheumatol 2009 36(6):1126-1129
- Skoumal M, Harberhauer G, Feyertag J, Kittl EM, Bauer K, Dunky A. Serum levels of cartilage oligomeric matrix protein (COMP): A rapid decrease in patients with active rheumatoid arthritis undergoing intravenous steroid treatment. Rheumatol. Int 2006 26(11):1001-1004.

