
Manuscript accepted on :March 13, 2016
Published online on: 30-03-2016
Plagiarism Check: Yes
Hasan Abedini 1 and Adel Johari Moghadam 2*
1Department of Biomedical Engineering , Amir Kabir University , Tehran , Iran 2Department of Cardiology , AJA University of Medical Sciences , Tehran , Iran Corresponding Authors Email : adeljoharim@yahoo.com
DOI : https://dx.doi.org/10.13005/bpj/930
Abstract
Numerical modeling of the lack of blood supply in mitral valve regurgitation and its related surgeries are very attractive, because it enables us to examine whether the surgery would improve the blood flow to reduce the tension in tissues. This is crucial, because the negative effects of increasing tension can only be determined over time. However, a finite element method is valuable. This requires accurate heart geometries, heart tissue parameters, a powerful solver and etc. In the present study, with the help of simulation, the function of mitral valve was compared in both modes of normal and valve prolapsed, through which useful results were obtained. Among the models, hyper-elastic Mooney-Rivlin model is used for the first time. The boundary conditions of model are also much nearby to the reality of ventricular function in imposing pressure on the valves. Unlike previous models, in which the prolapse was never been significant, the function of valve is carefully studied and compared in this model. The findings, at the end of the simulation, suggest that the prolapse caused by the rupture of chorda tendinea can be problematic to the valve function. Although the number of chorda tendinea and their properties can be very different in each individual, what has been suggested as a possibility in the results of this simulation is that in the rupture of chorda tendinea, since the imposed tension on the other chorda tendinea and also the tensions created on the leaflets increase, the modification of chorda tendinea as quickly as possible prevents the rupture of other cords. Therefore, the replacement of artificial valve which is very costly and risky may be avoided with a timely surgery.
Keywords
Mitral valve leaflets; Chorda tendinea; finite element method; mitral valve prolapse
Download this article as:| Copy the following to cite this article: Abedini H, Moghadam A. J. Numerical Simulation of The Impact of Chorda Tendinea Rapture on The Mitral Valve Leaflets Stress By Finite Element Method. Biomed Pharmacol J 2016;9(1) |
| Copy the following to cite this URL: Abedini H, Moghadam A. J. Numerical Simulation of The Impact of Chorda Tendinea Rapture on The Mitral Valve Leaflets Stress By Finite Element Method. Biomed Pharmacol J 2016;9(1). Available from: http://biomedpharmajournal.org/?p=6680 |
Introduction
Heart diseases is one of the most common death cause worldwide. [1] Simplifying of the heart geometry and tissues microstructure which are interacted with solids and fluids increase our knowledge of fluids dynamic in heart which is necessary for mechanical analysis of heart and surgeries. In fact, by imaging of the heart which can be done by removing the heart from the body, just high quality images would be obtained. Due to difference of the heart geometry inside and outside of the body, this would be a challenging issue. The next major obstacle in the prediction of the analysis is the lack of mechanical impact of heart valves. The sever impact of heart valves on fluid dynamic is obvious. [2]
The most important mechanical coupling which is between ventricle and heart valves caused by chorda tendinea which connect the free edges of front and rear leaflets to the muscles and thus to the left ventricle wall. [2, 3]
Leaking backward of blood is a clinical pathology involved the mitral valve and left ventricle with dynamic interaction between solids and fluids. Blood backflow to the left atrium in systole phase due to the changes in blood flow in heart and valves. This backflow causes lung swell and slight changes in the final volume left ventricular that is associated with mortality. [4] Modification of blood backflow to reduce myocardium tension and slow/stop ventricular changes are the main goal of surgeries for this disorder. Numerical models of blood backflow and their modification are used to predict successful outcomes of surgeries to reduce tensions and improvement of blood flow. [2]
In general, a proper three-dimensional model will be needed for three-dimensional modeling and analysis of the mitral valve. The geometry of mitral valve was checked and entered to Catia software, after extracting of basic information from articles. The model was imported into the 3D finite element software (ADINA) and boundary condition was determined after specifying the valve properties and components, and finally the model was analyzed.[5] Extraction of stresses and strains were the outcome of this model analysis. [6]
Methods
Equations
The solid object equation is shown below. (Equation 1)
![]()
Equation 1 :Solid object equation. τ: Tension, f B: Physical force, ρs: Density of solid object, ü: Acceleration
Kinematics system should also be considered in order to achieve proper finite element form to apply solid model equation. A solid object with high mobility and low strain was assumed for the kinematics of this study model. Nonlinear dynamic equation (Equation 2) would be the most appropriate system to applying equations due to high mobility of assumed solid object. [7, 8]
![]()
Equation 2: Nonlinear dynamic equation. M: Mass matrix, C: Dumping matrix, K: Stiffness matrix, R: External force vector, F: External force vector equal to the tension elements in the previous iteration, Ü: Acceleration of solid object nodes, : Speed of solid object nodes, U: Displacement of solid object nodes
The F term in above equation was used to calculate nonlinear terms of the system. The F vector contains physical force, focused force, surface force, and primary stresses. M, C, and K matrices considered constant and shown in Equation 3.
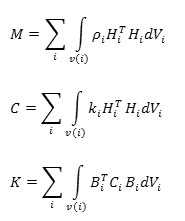
Equation 3- M, C, and K matrices. i: Element number. ρ: Elements’ density, k: Elements’ dumping activity coefficient, H: Element displacement element, B: Strain-displacement matrix of element, C: Elasticity matrix of element, V: Volume of element.
There should be a special attention to degree of freedom when a solid object has been modeled. All rotational freedom degrees should be considered equal to zero to achieve convergence, if in a particular model only movement freedom degree taken into consideration. Suitable element should also selected for solid object to discretization of finite element method equations. When th boundary condition, material properties, element, and network applied correctly, solid model equations would be fully resolved. Newtonian method is used to linearize the system of equations and finally as fluid equations, solving sparse would be used for these liner system. [9]
Numerical simulation
Valve geometry include annulus ring, leaflets, and tendons. Annulus would be investigated first. Annulus ring is roughly oval in shape.[10] Different models of valves are provided in various articles based on photos which are shown some of them in figure 1A. Although annulus ring is a dynamic part of heart valve, but a fixed geometry was assumed for it to reduce the complexity of this study’s issue. An oval shape hole was considered for annulus profile. Figure 1B is a proposed annulus profile by Kevin Daniel Lau which is used in this study. [11]
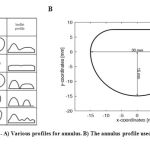 |
Figure 1: A) Various profiles for annulus. B) The annulus profile used in this study |
The article of Emilliano Votta was also used to leaflets design. Leaflets can be considered as a surface with approximately 1mm thickness due to their inconsequential thickness. [12] Although there is disagreement about thickness of leaflets in various studies, but 1mm thickness is offered in all of them. The thickness of front and rear leaflets considered equal in this study which is corresponds to the reality with a little error. The form and angle of surfaces toward horizon of leaflets are shown in figure 2. The front leaflet is bigger than rear one but allocate smaller part of the annulus. This leaflet is monolithic. The rear leaflet consists three section and the middle one is bigger than others.
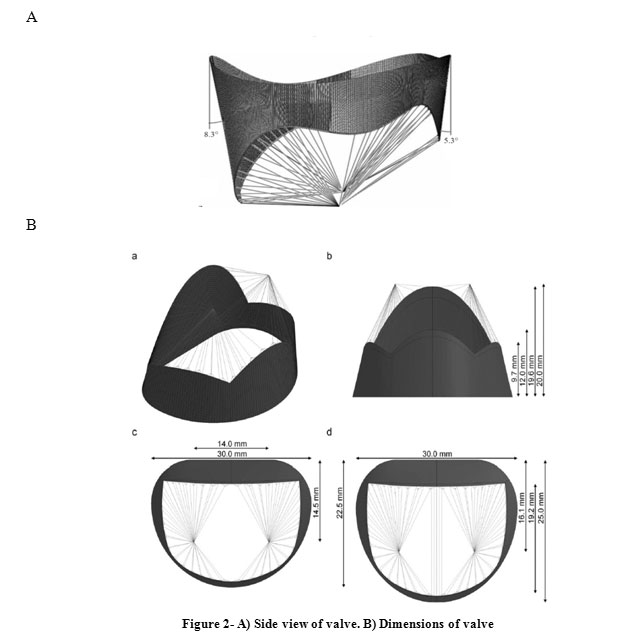 |
Figure 2: A) Side view of valve. B) Dimensions of valve |
The leaflet can be easily designed based on figure 2. Tendinous cords were also drawn as shown in this figure.
Thus, the geometry of valve was designed on Catia software based on figure 2 and the sizes which are calculated in articles and prepared for finite element analysis. The resulting design is shown in figure 3.
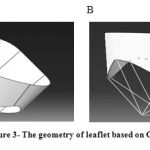 |
Figure 3: The geometry of leaflet based on Catia. |
Mitral valve properties
Biomechanical behavioral measures of soft tissues require a carful definition of basic models which are need assessment of histologic and morphologic characteristics of desired tissue. Mechanical experimental tests face many operational problems. Therefore, numerical methods are easier way. Expert models which are associated with experimental data should be accepted considering to the nonlinear behavior of the materials.[13]
Heart valve tissue is soft and hydrated. Stress-strain responses are their macroscopic result of their microscopic structure. The tissue of valves’ leaflets are formed by elastic matrix which are reinforced by collagen fibers. Tissues and their behaviors intended hyperelastic to analyze their large deformation. Hyperelastic materials have nonlinear stress-strain curve and large strains. Most of biologic tissues are hyperelastic.
If the presence of strain energy density function could be assumed for an object, this material would be hyperelastic. Hyperelastic materials defined by energy function and also invariants of C matrix which is obtained from F transformation matrix. Strain energy function would be W=W(C), if proper amount of strain assumed. In this function, C is the right Cauchy Green tensor and C function is C=FTF which F in this equation is transformation gradient. According to these, stress-strain curve function is shown below.
![]()
If the material being homogeneous, it can be shown that the strain energy function will be depend on C by their main invariables:

Order structure of soft tissues, such as the presence of fibroids with specific space direction, determines the heterogeneous mechanical response of tissue. This fact can be calculated by checking the previous formula, the introduction of new invariants, which these invariants are directly related to the structure of tissue.
For example, consider the presence of a fibers family in a particular direction in a small area of a tissue! Two more invariables will be introduced:
![]()
A is a unit vector that indicates the direction of fibers in no deformation state. The local direction of deformed state will be indicated by unit vector, a=FA/λ, which λ represents the strain in fibers direction. The fourth invariable is square strain of tissue in fibers direction, while the fifth one will be calculated for the ratio of fibers to strain energy function which is depended on shear and direction of fibers. Thus, strain energy function and stress-strain equation will be equation 5.
Basic model defined by the above equations are symmetrical and homogeneous, and usually use for many ideas and soft tissue mechanics. There is various models such as Ogden, Mooney-Rivlin, Polynomial, Reduced polynomial, Arruda-Boyce, Marlow Neo, and etc. for hyperelastic materials. A specific energy function is defined for all of these models and their coefficients will be determined.
Moony-Rivlin hyperelastic 9 nominal model was used in this simulation for the first time. The model’s W strain energy function is shown below.

In this function, I1 and I2 are invariables of Cii Cauchy Green deformation matrices:
![]()
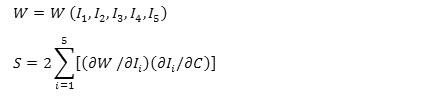
C1 to C9 are also constants of matter. These constants obtained from curve fitting to the experimental data of heart valves tissues stress-strain data which are reported by Yin and May- Newman [14] and given below.
At first, the charts obtained from loading heart valves tissues is shown in figure 4. This graph is taken from Yin and May-Newman results of heart valves tissue tests.[15]
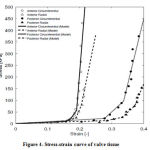 |
Figure 4: Stress-strain curve of valve tissue |
The graph and desired model coefficients are shown in figure 5 and table 1.
Table 1: Mooney-Rivlin Coefficients
| Variable | Coefficients | Variable | Coefficients | Variable | Coefficients |
| C1 | 25517.1736493095 | C4 | 10352.3090759319 | C7 | 4376.38022869666 |
| C2 | 19445.8910349734 | C5 | 8151.7905945757 | C8 | 3487.18987844141 |
| C3 | 13126.1671986812 | C6 | 5488.58097719279 | C9 | 2776.6605548665 |
| The bulk modulus : 44963064.6842829 | |||||
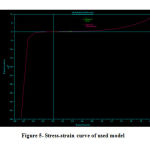 |
Figure 5: Stress-strain curve of used model |
Due to high elasticity of tendons, they assumed elastic and linear. According to the paper by Votta, 16 Mpa and 0.45 were intended for Yang modulus and Poisson ratio of tendons. The model is elastic and isotropic. With these properties, desired model can be entered into the finite element software. ADINA ver. 8.8 was used for this study.
Uploading and boundary condition
Annulus ring was intended fix for boundary condition. Outer surfaces have systolic pressure and the inner ones have atrial pressure. Its diagram is shown in figure 6.
 |
Figure 6: Atrial and Ventricular pressure |
The used elements were triangular. Settings were intended for large deformation and convergence of the subject. The number of steps were 8022 and the minimum E-4 time step was 1.24667581. The total time for solving was 8245.47s (≈ 2.5 hours). The number of triangular elements were 46210. The valve shape before analysis is shown in figure 7
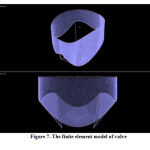 |
Figure 7– The finite element model of valve |
Results and Discussion
First, the valve function was analyzed in normal mode. The results showed normal function of valve in this mode, according to the physiologic boundary condition. Stresses and strains of valve were derived on various times conditions in the analysis. Analyzing the normal function of valve can be used as a standard for comparison of its operation in healthy and damaged mode of valve. [16]
Mitral valve performance analysis
As it shown in figure 8, primary tension is significantly high near the annulus and it increases by the time. With closure of the mitral valve, sever tension will be observed in parts of leaflets which are near the annulus. There is also sever strains in these parts.
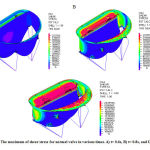 |
Figure 8: The maximum of shear stress for normal valve in various times. A) t= 0.6s, B) t= 0.8s, and C) t= 1s |
The reason of this phenomenon is clear. A sever tension inserted to the high deformable tissue of valve and therefore the leaflets next to the annulus will be severely deformed. Valves’ strain in various times are shown in figure 9
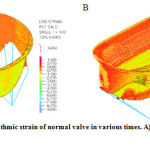 |
Figure 9: Logarithmic strain of normal valve in various times. A) t=0.6s and B) t=1s |
After rising the tension in these regions, the tension is severely reduced in free edges of valve which was expected.
Another important point in this analysis is the tension in chorda tendinea and connection point of them to the leaflets. The beneficial and important role of these chorda tendinea in proper form of valve to have acceptable and accurate closure can be observed in figure 8 and 9. It is notable that the tension in chorda tendinea is so much lower than valve. Chorda tendinea will have lower deformity rather than valve due to higher elasticity of their tissue than valve tissue.
Valve performance analysis in rupture mode (Prolapse)
In next step, as it said before, the valve performance was analyzed in rupture mode. For this, some tendons assumed damaged. The results showed different tension in leaflets and chorda tendinea. Figure 10 shows the effect of tension on damaged valve and the chorda tendinea response is shown in figure 11. The simulation was done by ADINA software.
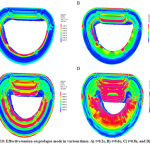 |
Figure 10: Effective tension on prolapse mode in various times. A) t=0.2s, B) t=0.6s, C) t=0.8s, and D) t=1s |
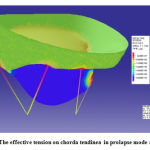 |
Figure 11: The effective tension on chorda tendinea in prolapse mode after 1sec. |
Valve performance analysis in rupture mode (Prolapse)
In next step, as it said before, the valve performance was analyzed in rupture mode. For this, some tendons assumed damaged. The results showed different tension in leaflets and chorda tendinea. Figure 10 shows the effect of tension on damaged valve and the chorda tendinea response is shown in figure 11. The simulation was done by ADINA software.
Conclusion
This method can show the position of leaflets with high tension, so this method would be a powerful measuring tool for physicians, during or prior of surgery, to show critical location of leaflets for focusing during the surgery. It will be expected that most experienced physicians would be have more successful surgery by using this method.
References
- A.S. Go, D. Mozaffarian, V.L. Roger, E.J. Benjamin, J.D. Berry, W.B. Borden, D.M. Bravata, S. Dai, E.S. Ford, C.S. Fox, Heart disease and stroke statistics–2013 update: a report from the American Heart Association. Circulation 127 (2013) e6.
- D.R. Einstein, F. Del Pin, X. Jiao, A.P. Kuprat, J.P. Carson, K.S. Kunzelman, R.P. Cochran, J.M. Guccione, M.B. Ratcliffe, Fluid–structure interactions of the mitral valve and left heart: comprehensive strategies, past, present and future. International Journal for Numerical Methods in Biomedical Engineering 26 (2010) 348-380.
- H. Muresian, The clinical anatomy of the mitral valve. Clinical anatomy 22 (2009) 85-98.
- L.A. Piérard, P. Lancellotti, The role of ischemic mitral regurgitation in the pathogenesis of acute pulmonary edema. New England Journal of Medicine 351 (2004) 1627-1634.
- K. Kunzelman, R. Cochran, C. Chuong, W. Ring, E. Verrier, R. Eberhart, Finite element analysis of the mitral valve. The Journal of heart valve disease 2 (1993) 326-340.
- H. Zhang, X. Zhang, S. Ji, Y. Guo, G. Ledezma, N. Elabbasi, Recent development of fluid–structure interaction capabilities in the ADINA system. Computers & structures 81 (2003) 1071-1085
- M. Stevanella, E. Votta, A. Redaelli, Mitral valve finite element modeling: implications of tissues’ nonlinear response and annular motion. Journal of biomechanical engineering 131 (2009) 121010.
- T. Mansi, I. Voigt, B. Georgescu, X. Zheng, E.A. Mengue, M. Hackl, R.I. Ionasec, T. Noack, J. Seeburger, D. Comaniciu, An integrated framework for finite-element modeling of mitral valve biomechanics from medical images: application to MitralClip intervention planning. Medical image analysis 16 (2012) 1330-1346.
- K. Bathe, Theory and Modeling Guide, Vol III: ADINA-F, ADINA R&D. Inc, Watertown, MA (2003).
- V. Prot, R. Haaverstad, B. Skallerud, Finite element analysis of the mitral apparatus: annulus shape effect and chordal force distribution. Biomechanics and modeling in mechanobiology 8 (2009) 43-55.
- K. Lau, V. Diaz, P. Scambler, G. Burriesci, Mitral valve dynamics in structural and fluid–structure interaction models. Medical engineering & physics 32 (2010) 1057-1064.
- E. Votta, E. Caiani, F. Veronesi, M. Soncini, F.M. Montevecchi, A. Redaelli, Mitral valve finite-element modelling from ultrasound data: a pilot study for a new approach to understand mitral function and clinical scenarios. Philosophical Transactions of the Royal Society of London A: Mathematical, Physical and Engineering Sciences 366 (2008) 3411-3434.
- V. Prot, B. Skallerud, Nonlinear solid finite element analysis of mitral valves with heterogeneous leaflet layers. Computational Mechanics 43 (2009) 353-368.
- K. May-Newman, F. Yin, Biaxial mechanical behavior of excised porcine mitral valve leaflets. American Journal of Physiology-Heart and Circulatory Physiology 269 (1995) H1319-H1327.
- K. May-Newman, F. Yin, A constitutive law for mitral valve tissue. Journal of biomechanical engineering 120 (1998) 38-47.
- E. Yellin, S. Laniado, C. Peskin, R. Frater, Analysis and interpretation of the normal mitral valve flow curve. The mitral valve (1976) 163-172.

