
Manuscript accepted on :February 01, 2016
Published online on: 05-03-2016
Plagiarism Check: Yes
Reza Mohammadi1,2 and Vagihe Norozi1
1Department of Biochemistry and Pharmacology, Islamic Azad University, Tehran Medical Sciences Branch, Tehran, Iran. 2Department of Biochemistry of External Quality Assessment Program, Iranian Association of Clinical Laboratory Doctors, Tehran, Iran.
DOI : https://dx.doi.org/10.13005/bpj/919
Abstract
Results of HbA1c measuring is used in management diabetic patients. So agreement between results of different HbA1c measuring methods and kits is critical in medical decision making.Results of measring HbA1c of 55 patient’s blood samples with five commonly used kits in Iran, including Pars Azmon, Pishtaz Teb, Biosystem, Roche, and NycoCard, compared with total mean results. All kit results showed good correlation (r>0.96) with total mean results. In paired t-test analysis, results of Pars Azmon, Biosystem, and NycoCard had no statistically significant difference with total mean results, but results of Pishtaz Teb and Roche kits were significantly lower and higher than total mean results, respectively. However, this differences were clinically insignificant.With respect to results of external quality assessment program (EQAP) in Iran and results of this study, analytical performance of studied kits are acceptable, except for Roche kit which had a positive bias.
Keywords
Glycated hemoglobin; HbA1c; diabetes mellitus
Download this article as:| Copy the following to cite this article: Mohammadi R, Norozi V. HbA1c Measurement: Comparison of Results of Five Commonly Used Kits in Iran. Biomed Pharmacol J 2016;9(1) |
| Copy the following to cite this URL: Mohammadi R, Norozi V. HbA1c Measurement: Comparison of Results of Five Commonly Used Kits in Iran. Biomed Pharmacol J 2016;9(1). Available from: http://biomedpharmajournal.org/?p=6538 |
Introduction
Diabetes mellitus is associated with complications of eyes, kidneys, heart, blood vessels and other organ systems. Long-term complications of diabetes include retinopathy with potential loss of vision, nepheropathy leading to renal failure, and peripheral neuropathy with risk of foot ulcers and amputations [1]. The results of major clinical trials, The Diabetes Control and Complications Trial ((DCCT) and The U.K. Prospective Diabetes Study (UKPDS), showed that the development and progression of diabetic complications can be delayed by monitoring the glycemic status of patients [1, 2]. The tests most widely used in monitoring the glycemic status are blood glucose and glycated haemoglobin [1].
Fasting blood glucose measuring is used for short-term monitoring and has limited value for the long term assessment of glycemic control [1, 3]. In addition, it is affected by last feeding and other conditions, such as stress and using drugs [4, 5]. So, the blood glucose level is inadequate in evaluating the level of glucose regulation.
For the long term assessment of glycemic status, measurement of HbA1c, main glycated hemoglobin, is now routinely and widely used in clinical practice [6, 7]. Formation of HbA1c is directly proportional to blood glucose which is not affected by diurnal fluctuations of blood glucose [4]and so is the most important indicator of the the overall glucose level in a patient during a period of two or three months [8]. Results of DCCT and UKPDS showed good correlation between diabetics long-term complications and blood HbA1c levels and thereafter HbA1c assay has become the gold standard measurement of hyperglycemia [1, 7].
There are different principles and methods for measuring blood HbA1c [2, 8]. The result of blood HbA1c of one patient measured by different methods or kits may be siginificantly different. So, clinicians are usually worried about reliability of HbA1c test results which may affect on patient treatment.
There are numerous analytical problems associated with HbA1c measurement, including lack of assay standardization, intrference by hemoglobin varients in patients with hemoglobinopathies, and presence of hemoglobin derivatives in uremic patients [1, 9].
In order to obtain same results of HbA1c in a whole blood specimen by different methods, standardization of these methods is essentisl. Standardization of HbA1c assays was began in 1996 by The National Glycohemoglobin Standardization Program (NGSP). American Diabetes Association (ADA) recommends using NGSP certified assays for measuring HbA1c in whole blood [8, 10].
Five most commoly used HbA1c measuring kits in Iran are Pars Azmon, Pishtaz Teb, Biosystem, Roche, and NycoCard which all of them have NGSP certification or their results can be convertd to NGSP certified method. In this study, we compare results of measuring patient’s whole blood HbA1c by these different methods.
Material and Methods
Venous blood of fifty five subjects, including diabetic, pre-diabetic, and nondiabetic patients, were collected, every in four different EDTA containing tubes, during six working days, which lasted from 15 February 2014 to 27 Februray 2014. These tubes were sent to four clinical laboratory within the same day of blood collection to measure HbA1c. Every laboratory used one different kit for measuring HbA1c, except one laboatory which used two kits for this measuring. So, HbA1c in every specimen of 55 subjects were measured with five kits which were commonly used in clinical laboratories of Iran. These kits included Pars Azmon, Pishtaz Teb, Biosystem, Roche, and NycoCard which their assay priniples were immunoturbidimetry, enzymatic, cation-exchange chromatography, immunoturbidimetry, and boronate-affinty chromatography, respectively. Every sample was tested in duplicate. Each method was calibrated according to manufature instructions and in each run, two control materials, including normal and high levels, were tested as internal quality control. HbA1c results were reported as percent of total hemoglobin.
After reporting results, as an external quality assessment, mean of ten reported results from duplicate measuring of each sample with five different kits was calculated and used as target value for comapring mean of each kit duplicate measuring. In this way, we calculated absolute bias (Bias), percent bias (Bias%), and standard deviation index (SDI) according to following formulas [4]:
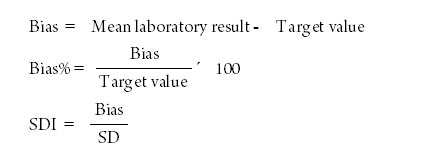
For calculating SDI, we used SD (standard deviation) of ten results used for calculating target values. According to SDI, methods were classified as excellent (SDI ≤ 0.5), good (0.5 < SDI ≤ 1.0), acceptable (1.0 < SDI ≤ 2.0), marginal (2.0 < SDI ≤ 3.0), and unacceptable (SDI > 3.0). Clinically acceptable range was calculated as total mean ± 6%, which is recommended by College of America Pathologists (CAP)[11],and then acceptability of each peergroup mean was investigated according to this range.
Data analyzedwith statistical sowftware of SPSS 20 and MedCalc 13.3.1. The paired t-test was used to compare means and linear regression analysis was used to determine the coefficient of correlation. We also used Deming regression analysis for the comparison of the methods [3].When results of both of comparative method (here, results of total mean) and test method (here, each kit results) have imprecision, using Deming regression analysis is better than linear regression in which there is assumption that comparative method results are free of imprecision [12].
Results
Between-day coefficient variation (CV) for normal level (table 1) and high level (table 2) control materials were about 3% to 4%, except for Biosystem which were about twice.
Table 1: Between-day coefficient variation (CV) of HbA1c measurement obtained by different kits with normal-level control material
| Kits | No. | Mean | SD | CV (%) |
| Pars Azmon | 12 | 5.7% | 0.25 | 4.4 |
| Pishtaz Teb | 12 | 5.2% | 0.16 | 3.1 |
| Biosystem | 12 | 5.7% | 0.37 | 6.5 |
| Roche | 12 | 5.7% | 0.19 | 3.3 |
| NycoCard | 12 | 5.2% | 0.17 | 3.3 |
Table 2: Between-day coefficient variation (CV) of HbA1c measurement obtained by different kits with high-level control material
| Kits | No. | Mean | SD | CV (%) |
| Pars Azmon | 12 | 9.5% | 0.44 | 4.6 |
| Pishtaz Teb | 12 | 9.1% | 0.34 | 3.7 |
| Biosystem | 12 | 7.9% | 0.48 | 6.1 |
| Roche | 12 | 10.1% | 0.31 | 3.1 |
| NycoCard | 12 | 9.1% | 0.37 | 4.1 |
Calculated target values range from 4.7% to 11.3%. According to these target values, 12 (22%) patients were nondiabetics (HbA1c less than 5.7%), 6 (11%) patients were pre-diabetics (HbA1c 5.7-6.5%), and 37 (67%) were diabetics (HbA1c more than 6.5%). Calculated total mean was 7.41%. Mean of results obtained by Pars Azmon, Pishtaz Teb, Biosystem, Roche, and Nycocard were 7.27%, 6.82%, 7.39%, 8.06%, and 7.54%, respectively (table 3). The paired t-test showed that Pishtaz results and Roche results were siginficantly lower and higher than mean results, respectively (table 4); these differences were very significant (p<0.001). The results of Pars Azmon and NycoCard were also lower and higher than mean results, respectively; but these differences were not very significant (p<0.05).
Table 3: Values obtained by different kits and total group.
| Group | Mean | SD | Range |
| Total | 7.41% | 1.81 | 4.70%-11.30% |
| Pars Azmon | 7.27% | 1.86 | 3.55%-10.70% |
| Pishtaz Teb | 6.82% | 1.79 | 4.15%-11.00% |
| Biosystem | 7.39% | 1.69 | 4.45%-11.85% |
| Roche | 8.06% | 2.03 | 5.05%-12.85% |
| NycoCard | 7.54% | 1.88 | 4.70%-11.75% |
Table 4: Results of paired t-test analysis
| Kit | Paired Differences | T test | ||||
| Mean | STM | 95% CI | t | df | sig (2 tail) | |
| Pars Azmon | – 0.14* | 0.069 | – 0.29 to – 0.01 | – 2.137 | 54 | 0.037 |
| Pishtaz Teb | – 0.59** | 0.038 | – 0.66 to – 0.52 | – 15.560 | 54 | 0.000 |
| Biosystem | – 0.02 | 0.067 | – 0.15 to 0.11 | – 0.340 | 54 | 0.735 |
| Roche | 0.65** | 0.046 | 0.56 to 0.74 | 14.195 | 54 | 0.000 |
| NycoCard | 0.13* | 0.056 | 0.02 to 0.24 | 2.256 | 54 | 0.028 |
* Significant difference (P<0.05). ** Very Significant difference (P<0.001).
According to allowable total error of ±6%, clinically acceptable range was 7.41%± 0.44% or 6.97% to 7.87%. According to this rang, means of Pars Azmon, Biosystem, and NycoCard kits were clinically acceptable, But means of Pishtaz Teb and Roche kits were clinically unacceptable.
Table 5 has summerized average of bias% and SDI of each kit results. Average of bias% and SDI of Pishtaz Teb and Roche kit results were higher than mean bias% and SDI of Pars Azmon, Biosystem, and NycoCard kit results. Roche kit results had the highest bias% and SDI. Average bias% and SDI were lowest for Biosystem and NycoCard, respectively. According to average SDIs, analytical performance for Pishtaz Teb and Roche kits was acceptable, for Pars Azmon and Biosystem was good, and for Nycocard was excellent.
Table 5: Average of bias% and standard deviation (SDI), along with analytical performance (according to SDI) of different HbA1c measuring kits
| Kits | Bias% | SDI | Performance |
| Pars Azmon | 6.19 | 0.71 | Good |
| Pishtaz Teb | 8.33 | 1.06 | Acceptable |
| Biosystem | 4.98 | 0.62 | Good |
| Roche | 8.60 | 1.14 | Acceptable |
| NycoCard | 5.38 | 0.46 | Excellent |
Table 6 shows results of correlation analysis and Deming regression analysis. There was good correlation (r > 0.96) between each kit results and target values. When Deming regression analysis of Pishtaz Teb kit results was examined, the 95% coinfidence interval for y-intercept did not contain the value 0 which shows a constant systematic error in Pishtaz Teb results. When Deming regression analysis of Roche kit results was examined, the 95% coinfidence interval for slope did not contain the value 1 which shows a proportional systematic error in Roche results. In Deming regression analysis of NycoCard results, the 95% coinfidence interval for slope did not contain the value 1, but the lower limit of it, 1.005, was very near to 1. Deming regression of other results showed no systematic error. Figure 1 shows Deming regression plot of five different kit results against target mean results. As visually is evident, there are constant systematic error in Pishtaz Teb results and proportional systematic error in Roche kit.
Table 6: Correlation coefficient and Deming regression parameters for “y=ax+b” for results of HbA1c kits (y) and results of total groups (x).
|
Kit |
Correlation
Coefficient |
Slope (a) | y Intercept (b) | ||||
| Coefficient | SEM | 95% CI | Coefficient | SEM | 95% CI | ||
| Pars Azmon | 0.962 | 1.1239 | 0.077 | 0.970 to 1.278 | – 1.0496 | 0.527 | – 2.108 to + 0.009 |
| Pishtaz Teb | 0.988 | 1.0099 | 0.029 | 0.951 to 1.070 | – 0.6901* | 0.211 | – 1.113 to – 0.267 |
| Biosystem | 0.962 | 0.9543 | 0.041 | 0.872 to 1.037 | 0.3337 | 0.324 | – 0.317 to + 0.984 |
| Roche | 0.991 | 1.1346* | 0.027 | 1.080 to 1.189 | – 0.3696 | 0.191 | – 0.753 to + 0.014 |
| NycoCard | 0.976 | 1.0714* | 0.033 | 1.005 to 1.138 | – 0.4309 | 0.230 | – 0.892 to + 0.030 |
* Significant Bias.
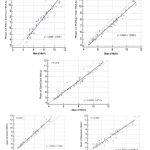 |
Figure 1: Deming regression analysis of Pars Azmon, Pishtaz Teb, Biosystem, Roche, and NycoCard Kits results in comparison with total mean results. Means of duplicate analysis by each kit have plotted on y-axis and total target means have plotted on x-axis. |
Disscussion and Conclusion
According to NGSP precision criteria, between-day CV% must be less than 4% [8]. This was achieved by Pars Azmon, Pistaz Teb, Roche, and NycoCard kits. But between-day CV% was higher for Biosystem kit (6.5% and 6.1% for normal and high level control material, respectively). This was comparable with producer information which had stated between-day CV% of 7.3% and 5.9% for QC material with mean HbA1c concetration of 7.2% and 9,9% respectively. This hiher CV% may be due to effect temperature on results.
Several studies have reported a perfect relationship between HbA1c methods based on different principles [13]. Good relationship and concordance between the different methods, as indicated in other studies, support the reliability of properly used different methods.
Ozceelik et al [13] compared three methods for measuements of HbA1c in Turkey. They found that mean HbA1c measured by high performance liquid chromatograpphy (HPLC) was statistically higher than particle-enhanced immunoturbidimetric assay (PEITT) and turbidimetric inhibition immunoassay (TINIA). They concluded this higher values may reflect that HbA1c peak was affected by abnormal variants, because the HPLC method is less specific than two other methods.
Sudhakar et al [3] compared three methods for measurement blood HbA1c, including PEITT, TINIA, and HPLC. They also showed statistically significant higher mean results with HPLC than mean results of PEITT and TINIA.F. Ozcelick and B. Sudhakar Studies showed better correlation between PEITT and HPLC and They recommended using PEITT method for measuring HbA1c, which is reliable, faster and easier [3, 13].
Khan et al [14] compared HPLC, as pereferable method, and immunological methods for measuring HbA1c. They found that mean of these two methods have no significant difference in HbA1c up to 10.0, but have significant difference in HbA1c more than 10.0. Finally, they concluded that HbA1c can be measured by immunological method in an automated chemistry analyzer to make the test cost-effective.
Thvarajah et al [15] campared two HPLC method, one based on boronate affinity chromatography and other based on cation-exchange chromatography, and one immunoturbidimetric method of measuring HbA1c. They found good correlation between these methods.
In Our study, statistically and clinically Significant differences between means of Pishtaz Teb and Roche kits may be due to used calibrators, incorrect calibration or improper use of kits and calibrators. We have seen in fifteen, seventeen, and eighteen runs of External Quality Assessment Program (EQAP) in Iran, Roche kit results were siginficantlly higher than total mean group results. This confirms positive bias of Roche kit and show that it is due to calibrators and their assigned values which needs further evaluation and if confirmmed, then necessitates corection actions.
Significantly lower mean concentration (Negative bias) of Pishtaz Teb kit was not seen in EQAP-15, EQAP-17, and EQAP-18. This shows that this negative bias may be due to improper instrument calibration.
In general, without regard to principles of measuring HbA1c, using NGSP certified assays is essential in measuring patient’s HbA1c blood and it is also necessary that this assay be used properly. So, pre-analytical, analytical, and post-analytical errors must be in control and method performance must be clinically acceptable.
Acknowledgment
The authors thank White laboratory, Medical laboratory, Eizaddost laboratory, and laboratory of Day hospital for performing the analysis, and also kit providers for preparing needed kits, control, and calibrators. This study was done with cooperation of EQAP.
References
- Yasmeen F., Mumtaz A., Adhami S. Comparison os cation exchange HPLC and immunoturbidimetric method for determination of HbA1c. Biomedica, 2011; 27:161-165.
- Weykamp C. HbA1c: A review of analytical and clincal aspects. Ann Lab Med, 2013;33:393-400.
- Sudhakar B., Reddy A., Fallerio J. Comparison of three methods for measurement of blood HbA1c as to reliability. J. of bioassays, 2014; 3:3000-3005.
- Burtis C.A., Ashwood E.R., Bruns D.E. Tietz textbook of clinical chemistry and molecular diagnostics. 5th edition. United State of America: Elsevier; 2012.
- McPherson R.A., Pincus M.R. Henry’s clinical diagnosis and management by laboratory methods. 22nd edition. Philadelphia: Elsevier; 2011.
- Mona R., Iwani Z., Rosidah T. Haemoglobin A1c: comparing performance of two point of care devices with laboratory analyser. BMC Research Notes, 2013; 6:540.
- Hector G.A., Alejandro R.A., Beatariz C.C. Effect of the method to measure levels of glycated hemoglobin on individual clinical decisions. Am J Clin Pathol, 2009; 132:332-335.
- Little R.R., Rohlfing C.L. HbA1c standardization: background, progress and current issues. Labmedicine, 2009;40:368-373.
- Mona R., Iwani Z., Rosidah T. Haemoglobin A1c: comparing performance of two point of care devices with laboratory analyser. BMC Research Notes, 2013; 6:540.
- Braga F., Panteghini M. Standardization and analytical goals for glycated hemoglobin measurement. Clin Chem Lab Med, 2013; 51: 1719-1726.
- College of America Pathologists (CAP) Survey Data. Available at: www.ngsp.org/pong/index.html.
- Lumsden J. Laboratory test method validation. Revue Med Vet. 2000; 151, 7: 623-630.
- Ozceelik F., Yiginer O., Serdar M. Comparison of three methods for measurement of HbA1c. Turk J Biochem, 2010; 35:344-349.
- Khan A.H., Rabeya M.R., Saeidullah M. Measurements of HbA1c by High Performance Liquid Chromatography in D-10 analyzer and Immunological Method by Beckman Coulter AU480 system: a comparative study. J Enam Med Col, 2012;2:62-66.
- Thevarajah T.M., Hasrash T., Ismail A.M. A comparison of three methods of measuring plasma glycated hemoglobin. Asian Biomedicine, 2008; 2: 43-49.

