
Manuscript accepted on :February 02, 2016
Published online on: 27-04-2016
Plagiarism Check: Yes
Mohd Maroof Siddiqui1, Geetika Srivastava2 and Syed Hasan Saeed
1Research Scholar, Amity University, India. 2Department of Electronics and Communication, Amity University, India. 3Department of Electronics and Communication, Integral University, India.
DOI : https://dx.doi.org/10.13005/bpj/947
Abstract
Sleep disorders may be one of the reasons for concerned sleep. Distressed sleep involves many inabilities such as to fall asleep, to go back to sleep and common waking up during the night. Sleep disorders can be classified under primary and secondary sleep disorders. By the improved recognition of sleep disorders, the variety of treatments now available. In this analysis of several patients of sleep disordered breathing (SDB) and standard people we have calculated an accurate PSD estimate After the analysis of normalized power of standard person a range is defined by which the comparison of normalized power of patients of sleep disordered breathing (SDB) is done. The result of comparison gives the accurate estimate of PSD for sleep disordered breathing. The analysis of patients can be done on a large scale, the more we analyze patients the more accurate results we will get. Working on all channels, with different PSD estimation methods can be very productive.
Keywords
Symptoms of sleep apnea; Analysis of EEG signals; PSD Estimation
Download this article as:| Copy the following to cite this article: Siddiqui M. M, Srivastava G, Saeed S. H. Detection of Sleep Disorder Breathing (SDB) Using Short Time Frequency Analysis of PSD Approach Applied on EEG Signal. Biomed Pharmacol J 2016;9(1) |
| Copy the following to cite this URL: Siddiqui M. M, Srivastava G, Saeed S. H. Detection of Sleep Disorder Breathing (SDB) Using Short Time Frequency Analysis of PSD Approach Applied on EEG Signal. Biomed Pharmacol J 2016;9(1). Available from: http://biomedpharmajournal.org/?p=6854 |
Introduction
Sleep apnea is a disorder of disrupted breathing during sleep. It again and again appears in corporation with fat enlargement or loss of tissue tone with collapse. These differences allowance the windpipe to crash at the time of breathing when tissues calm down all along sleep. This complication is called obstructive sleep apnea, is normally correlated with loud snuffling (though not everybody who snores has this disorder). Sleep apnea can also appear if the neurons that govern breathing malfunction at the time of sleep. During an incident of obstructive apnea, the person’s attempt to inhale air generates indigestion which crashes the windpipe. This blocks the air discharge for few seconds to a minute although the sleeping person struggles to inhale air. When somebody’s blood oxygen level decline, the brain responds by arousal the person enough to narrow the upper airway tissues and open the windpipe. The person may grunt or blow, then restart sniffling [1]. This period may be imitated hundreds of times a night. The continual awaking that sleep apnea patients experience leave them continuously sleepy and may lead to change in nature such as annoyance or abasement. Sleep apnea also deprives the person of oxygen, which can lead to morning inconvenience, a loss of concern in sex, or a failure in mental working. It may lead to high blood pressure, uneven heartbeats, and an expanded hazard of heart attacks and stroke. Patients with serious, untreated sleep apnea disorder are two to three times more feasible to have automobile calamities than the general population. In some high-risk persons, sleep apnea may even lead to quick death from gasping arrest at the time of sleep. An approximated 18 million Americans have sleep apnea [2][3].
Nonetheless, small members have had the problem analyzed. Patients with the exemplary appearances of sleep apnea, such as loud snorting, fatness, and inordinate daytime drowsiness, should be point out to a particular sleep center that can implement a test called Polysomnography. This test reports the patient’s brain movement, heartbeat, and inhaling during whole night. If sleep apnea is determined, a few treatments are accessible. Moderate sleep apnea usually can be overthrown through weight loss or by prohibiting the person from getting asleep on his or her back. Other people may demand exclusive devices or surgery to correct the impediment. People with sleep apnea should never take prescription or sleeping pills, which can influence their breathing throughout awaking [4].
Symptoms Of Sleep Apnea
The signs and symptoms of central and obstructive sleep apneas overlap, consistently making the type of sleep apnea more crucial to determine. The most recurrent signs and symptoms of disruptive and central sleep apneas include:
Drowsiness (hypersomnia) noisy snoring which is typically more important in obstreperous sleep apnea
Episodes of breathing cessation during sleep witnessed by another person.
Abrupt awakening accompanied by shortness of breath, which more likely indicates central sleep apnea
Awakening with a dry mouth or sore throat, Morning headache, Difficulty staying asleep (insomnia), Attention problems, unnecessary daytime sleepiness, walking with an unusual feeling after sleep, Having problems with reminiscence and attentiveness, Experiencing behavior changes, Morning or night headaches, About half of all people with sleep apnea report headaches, Heartburn or a sour taste in the mouth at night, Swelling of the legs, Sweating and chest pain while you are sleeping, Loud snoring. Almost all people who have sleep apnea snore, Restless tossing and turning during sleep, Mouth breathing, receiving up often during the night to urinate, impatience, Waking up a lot, Bed wetting and Not growing as rapidly as they should for their time. This may be the only indication in some kids [2]
Analysis Of Eeg Signals
Different signals considered by biomedical signals. All signals are obtained by performing signal data extraction by performing signal data extraction of data file named as n2_edfm.mat and sdb1_edfm.mat.
Normal And Patient Detail
Sixteen volunteer subjects were chosen for this study. These were referred to as the normal group as they were recorded to have no cardiac or respiratory complications and also any sleep related problem. Another group has sleep disorder of SDB of four subjects.
Load The Eeg Data
Figure 1 shows a plot of EEG signal of a sdb subject SDB1 with data base name ‘sdb1_edfm.mat’ it shows the ROCLOC channel it is channel of the given data[5].
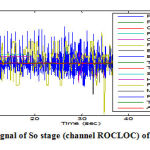 |
Figure 1: EEG signal of So stage (channel ROCLOC) of subject sdb1 |
Extraction Of Channel
In figure 2 we have shown the extracted signal of duration of 1min (60 sec) consisting of EEG signal of the respective channel for sleep stage So for subject sdb1. Here the total signal is of 1min, sampling frequency 256 Hz (for subject sdb1) [6] [7] .
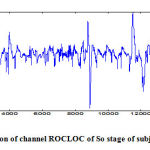 |
Figure 2: Extraction of channel ROCLOC of So stage of subject sdb1 |
In figure 3 we have shown the clipped signal of duration of 1min (60 sec) consisting of EEG signal of the respective channel for sleep stage So for subject sdb1. Here the total signal is of 1min, sampling frequency 256 Hz (for subject sdb1) respectively.
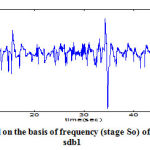 |
Figure 3: Extraction of signal on the basis of frequency (stage So) of channel ROCLOC, subject sdb1 |
In figure 4 we have shown the clipped signal of duration of 1min (60 sec) consisting of EEG signal of the respective channel for sleep stage S1 for subject sdb1. Here the total signal is of 1min, sampling frequency 256 Hz (for subject sdb1).
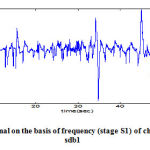 |
Figure 4: Extraction of signal on the basis of frequency (stage S1) of channel ROCLOC, subject sdb1 |
In figure 5 we have shown the clipped signal of duration of 1min (60 sec) consisting of EEG signal of the respective channel for sleep stage S2 for subject sdb1. Here the total signal is of 1min, sampling frequency 256 Hz (for subject sdb1).
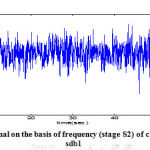 |
Figure 5: Extraction of signal on the basis of frequency (stage S2) of channel ROCLOC, subject sdb1 |
In figure 6 we have shown the clipped signal of duration of 1min (60 sec) consisting of EEG signal of the respective channel for sleep stage S3 for subject sdb1. Here the total signal is of 1min, sampling frequency 256 Hz (for subject sdb1)
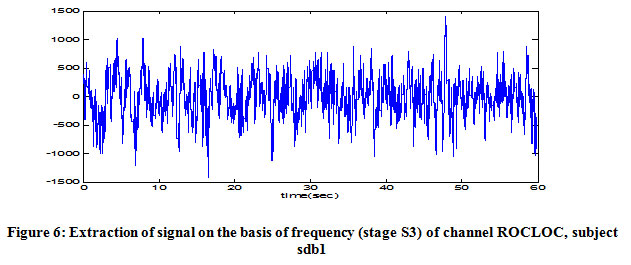 |
Figure 6: Extraction of signal on the basis of frequency (stage S3) of channel ROCLOC, subject sdb1 |
In figure 7 we have shown the clipped signal of duration of 1min (60 sec) consisting of EEG signal of the respective channel for sleep stage S4 for subject sdb1. Here the total signal is of 1min, sampling frequency 256 Hz (for subject sdb1.
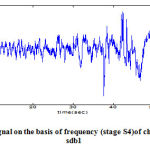 |
Figure 7: Extraction of signal on the basis of frequency (stage S4)of channel ROCLOC, subject sdb1 |
In figure 8 we have shown the clipped signal of duration of 1min (60 sec) consisting of EEG signal of the respective channel for sleep stage REM for subject sdb1. Here the total signal is of 1min, sampling frequency 256 Hz (for subject sdb1) .
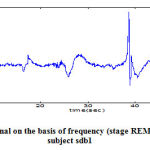 |
Figure 8 Extraction of signal on the basis of frequency (stage REM) of channel ROCLOC, subject sdb1 |
Filtering Of The Signal
The clipped signal are passed through the Hanning window low pass filter for removing the high frequency components that eventually indicates the noise because major portion of EEG signals are limited within the range of 25Hz. Figure 9 shows the filtering of the signal for sdb1[6][8].
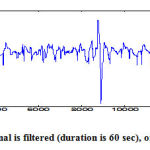 |
Figure 9: Extracted signal is filtered (duration is 60 sec), of subject sdb1. |
Comparison Between Filtered And Non-Filtered Signal
Now comparison of each clipped signal is shown. Figure 10 shows the comparison between the filtered and non-filtered signal for sdb1 (stage So).
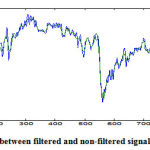 |
Figure 10: Comparison between filtered and non-filtered signal, of subject sdb1 |
Psd Estimation
After applying the filtering each signal is passed through the sliding window to measure the power spectrum density (PSD). Since PSD gives signal power with respect to frequency spectrum, we require specifying the number of frequency slots to distribute the spectral power.In figure 11 we have shown the PSD estimation curve of subject Sdb1 for So stage[6][9].
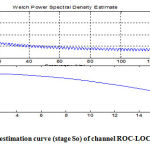 |
Figure 11: PSD estimation curve (stage So) of channel ROC-LOC for subject sdb1 |
Result
Normalized power (P norm) of normal cases having no indication of sleep is figure out and correlated with pathological cases all along different sleep stages. Normalized power shows the percentage of a specific EEG activity out of complete power. So it is found a better explanation of assessment of detection of features in reverse of taking average power of peculiar EEG activity [6][10].
For delta activity normalized power for normal cases is found in range of 0.75 — 0.81 same calculation for cases under SDB disorder is found to be 0.82 — 0.83 i.e. normalized power for delta activity during So stage for SDB disorder is quite high in comparison to normal case.(see table 1).
Table 1: Comparison of normal and SDB subject for delta activity
| NORMAL/PATIENT | n1 | n2 | n3 | n11 | sdb1 | sdb2 |
| P_delta | 0.58 | 0.76 | 0.75 | 0.78 | 0.82 | 0.83 |
| LOW | HIGH | |||||
For theta activity normalized power for normal cases is found in range of 0.16 — 0.28 same calculation for cases under SDB disorder is found to be 0.10 — 0.14 i.e. normalized power for theta activity during So stage for SDB disorder is quite low in comparison to normal cases.(see table 2)
Table 2: Comparison of normal and SDB subject for theta activity
| NORMAL/PATIENT | n1 | n2 | n3 | n5 | n11 | sdb1 | sdb2 | sdb4 |
| P_theta | 0.28 | 0.17 | 0.19 | 0.16 | 0.18 | 0.12 | 0.14 | 0.10 |
| HIGH | LOW | |||||||
For alpha activity normalized power for normal cases is found in range of 0.01 — 0.12 same calculation for cases under SDB disorder is found to be 0.06 — 0.16 i.e. normalized power for alpha activity during So stage for SDB disorder is quite high in comparison to normal cases.(see table 3)
Table 3: Comparison of normal and SDB subject for alpha activity
| NORMAL/PATIENT | n1 | n2 | sdb2 | sdb3 | sdb4 | |
| P_alpha | 0.10 | 0.05 | 0.16 | 0.11 | 0.06 | |
| LOW | HIGH | |||||
Conclusion
It was shown, that the time profiles of different patients and normal patients reflect the structure of EEG signal during quiet and active sleep. The procedure is capable of working even in the presence of different PSD estimation methods. A comprehensive comparison between the ROC-LOC channel, EEG sourced, PSD of affected and non-affected individuals has been made. The results in the tested channels indicate a significant difference in amplitudes between the control group and reference group.
As the above statistics indicate, the approach utilized over the course of this study enables the identification of Sleep Disorder Breathing patients from healthy individuals in a relatively easier manner as compared to most contemporary techniques in vogue. Further work on this technique will aim at establishing concrete boundaries of PSD for patients and non-affected individuals, for wide-scale diagnostic applications.
Abbreviations
EEG: Electro Encephalogram; ROC-LOC: Right of Central & Left of Central; PSD: Power spectrum Density
Competing interests
MMS is researcher. The other authors declare that they have no competing interests.
Authors’ Contributions
MMS designed the algorithm for experiments& performed the experiments and analyzed the data. AA edited my Manuscript. GS& SHS help me and guide me during my work. All authors read and approved the final manuscript.
References
- Várady, Péter, et al. “A novel method for the detection of apnea and hypopnea events in respiration signals.” Biomedical Engineering, IEEE Transactions on49.9 (2002): 936-942.
- McNames, J. N., and A. M. Fraser. “Obstructive sleep apnea classification based on spectrogram patterns in the electrocardiogram.” Computers in Cardiology 2000. IEEE, 2000.
- Watanabe, Takashi, and Kajiro Watanabe. “Noncontact method for sleep stage estimation.” Biomedical Engineering, IEEE Transactions on 51.10 (2004): 1735-1748.
- Siddiqui, Mohd Maroof, et al. “EEG Signals Play Major Role to diagnose Sleep Disorder.” International Journal of Electronics and Computer Science Engineering (IJECSE) 2.2 (2013): 503-505.http://physionet.org/cgi-bin/atm/ATM
- Siddiqui, Mohd Maroof, et al. “Detection of rapid eye movement behavior disorder using short time frequency analysis of PSD approach applied on EEG signal (ROC-LOC).”Biomedical Research 26.3 (2015): 587- 593.
- Krajca V, Petranek S, Paul K , Matousek M, Mohylova J, and Lhotska L, “Automatic Detection of Sleep Stages in Neonatal EEG Using the Structural Time Profiles”, Proceedings of the 2005 IEEE Engineering in Medicine and Biology 27th Annual Conference Shanghai, China, September 1-4, 2005
- Acharya RU, Faust O, Kannathal N, Chua T, Laxminarayan S, “Non-linear analysis of EEG signals at various sleep stages” Elsevier, Computer Methods and Programs in Biomedicine 2005; 80: 37-45.
- Liu D, Pang Z, Lloyd SR, “Neural Network Method for Detection of Obstructive Sleep Apnea and Narcolepsy Based on Pupil Size and EEG”, IEEE Transactions on Neural Networks, Vol. 19, No. 2, (February 2008), pp. 308-318, ISSN 1045-9227.
- Iasemidis LD, “Epileptic seizure prediction and control”, IEEE Trans.Biomed. Engng., 50, 2003, 549–558.
- Siddiqui, Mohd Maroof, et al. “Detection of Periodic Limb Movement with the Help of Short Time Frequency Analysis of PSD Applied on EEG Signals.” Extraction 4.11 (2015).

