
Manuscript accepted on :
Published online on: 27-11-2015
Plagiarism Check: Yes
A. Prabin1 and J. Veerappan2
1Department of ECE, Universal College of Engineering and Technology, Tirunelveli, India, 2Dept. Sethu Institute of Technology, Tamilnadu, India
DOI : https://dx.doi.org/10.13005/bpj/805
Abstract
Brain tumor segmentation is a clinical requirement for brain tumor diagnosis and radiotherapy planning. Automating this process is a challenging task due to the high diversity in appearance of tumor tissue among different patients and the ambiguous boundaries of lesions. In this paper, we propose a novel method of classification of primary brain tumor in MRI images using multi model texture features and kernel based support vector machine. The probabilities of each pixel that belongs to the foreground (tumor) and the background are estimated by global and custom classifiers that are trained through gray level co-occurrence and Texton co-occurrence matrix based feature vector, respectively. The proposed method is evaluated 80 T1 weighted brain MRI image sequences using the evaluation metrics such as sensitivity, specificity and accuracy. The classification results are compared with other neural network based classifiers such as RBF and FFNN. The accuracy level (94%) for our proposed approach is provided at detecting the tumors in the brain MRI images. The obtained results depict that the proposed brain tumor detection approach produces better results in terms of the evaluation metrics.
Keywords
Magnetic Resonance imaging; Feature extraction; Classification; brain tumor; Textures; SVM
Download this article as:| Copy the following to cite this article: Prabin A, Veerappan J. Robust Classification of Primary Brain Tumor in MRI Images Based on Multi Model Textures Features and Kernel Based SVM. Biomed Pharmacol J 2015;8(2) |
| Copy the following to cite this URL: Prabin A, Veerappan J. Robust Classification of Primary Brain Tumor in MRI Images Based on Multi Model Textures Features and Kernel Based SVM. Biomed Pharmacol J 2015;8(2). Available from: http://biomedpharmajournal.org/?p=1810 |
Introduction
Medical image segmentation has core importance to implement high level operations such as tissues recognition and classification. Segmentation of this type of imaging data is still a problem that demands to be probed [1]. Segmentation of medical structures is compulsory in computer assisted surgery or diagnosis system. Medical imaging methods take part in focusing organs and tissues during surgery process [2]. The visible and palpable tumor mass seen by different medical imaging modalities like CT and MRI is usually complicated to identify automatically with existing image processing methods, but still same is achieved manually by clinicians using computer aided drawing software. Segmentation of basic brain MR regions supports in visualization to identify various diseases, morphological and volume estimation, tissue classification and etc. Various methods of segmentation are edge based, thresholding, watershed and region growing etc., which are distinguished on the basis of their application and modality using which image is acquired [3].
Magnetic Resonance Imaging (MRI) is a multi-sequence medical imaging technique with which stacks of images are acquired with different tissue contrasts. Each sequence, namely, T1-weighted,T2-weighted, Proton Density (PD), Fluid-Attenuated Inversion Recovery (FLAIR), etc., highlights specific properties of tissues and pathologies, but none of them can provide completely decisive and reliable information. In MR images, lesions usually appear quite different in texture from normal tissues. Texture features provide an important in the perception and discrimination of a tumor. Image classification is one of the typical computer applications widely used in the medical field, especially for abnormality detection in Magnetic Resonance (MR) brain images [4]. The automated image classification systems used for such applications must be significantly efficient in terms of accuracy since false detection may lead to fatal results.
The process of extracting the original image based on the certain features which undergo a transformation of pixel regions. Feature extraction can be based on two approaches; they are human centered and machine centered approaches. Human centered approach measures with perception based features such as texture, and the perfect mathematical representation is selected for it. In machine centered approach, a unified computing scheme is selected for extracting certain ad-hoc features. There are many techniques for feature extraction, e.g. texture Features [5], Gabor features, feature based on wavelet transform, principal component analysis, minimum noise fraction transforms, discriminant analysis, decision boundary feature extraction, non-parametric weighted feature extraction and spectral mixture analysis. The texture elements act as attributes based on the pixel region that digitizes the individual object into binary forms of information through computer imaging based on the silhouette of image information [6-7].
Machine learning classification techniques, including supervised and unsupervised (clustering or fuzzy clustering)[8-9], are also introduced into brain tumor segmentation. Trained classifiers estimate the probability for each voxel in the testing volume, judging whether the voxel belongs to the target or the background. The threshold of the probability map is calculated to obtain the segmentation result or provide for post-processing. These techniques make it possible for high-dimensional features to be utilized in order to achieve a better discriminatory power for tumors compared with sole dependence on intensity information [10]. Moreover, the approaches applied in the field of pattern analysis can be transplanted into medical image segmentation, such as a distance metric learning algorithm, to make the intra-class samples closer while keeping extra-class samples as far away from each other as possible. Unfortunately, these classifications based segmentation approaches consider the voxels in the image to be independent of each other, with no spatial correlation both in the training and testing phases [11].
Related Work
Lots of research has been performed for the segmentation of normal and abnormal tissues in MRI brain images. Some of the recent related works regarding the classification of brain tissues are reviewed in this section.
Kekre et al. [8] have proposed a vector quantization segmentation technique to identify a cancerous mass from MRI images. In order to improve the radiologists’ diagnostic performance, computer-aided diagnosis (CAD) scheme has been introduced to enhance the recognition of primary signatures of this disease: masses and micro calcifications. As well, to tackle the class distinguishability as well as feature space sparseness and solution space intricacy problems in multivariate image segmentation, a Markov random field (MRF) based multivariate segmentation algorithm called “multivariate iterative region growing using semantics” (MIRGS) has been proposed by Shan Shen [13]. In MIRGS, the impact of intra-class variation and computational cost has been minimized by means of the MRF spatial context model integrated with adaptive edge penalty and applied to regions. To restrain the initialization sensitivity, a region-level means (RKM) based initialization technique has been utilized, which always provides exact initial conditions at low computational cost. Experiments have demonstrated the pre-eminence of RKM relative to two frequently used initialization techniques.
As well, a template-based framework for multi-object segmentation of deep brain structures (caudate nucleus, putaen and thalaus) in medical brain images has been presented by Jue Wu and Albert C.S. Chung [14]. This framework combines the information of edge features, region statistics, and inter-structure constraints for identifying and locating all target brain structures. The multi-object template has been structured in the form of a hierarchical Markov Dependence Tree (MDT), and manifold objects have been successfully matched to a target image via a top-to-down optimization approach. The final segmentation has been achieved through refinement by a B-spline based non-rigid registration between the exemplar image and target image. The approach necessitates only one example as training data. The technique has been validated using a publicly available T1-weighted MRI database with expert-segmented brain structures and obtained satisfactory results as 0.80 Dice score for the caudate nuclei, 0.81 Dice score for the putaina, and 0.84 Dice score for the thalai on average.
In order to enhance the performance of automated image segmentation, especially in the field of brain tissue segmentation from 3D MRI towards classical image deterioration including the noise and bias field artifacts that arise in the MRI acquisition process, caldairou et al. [15] have proposed to integrate into the FCM segmentation methodology concepts stimulated by the Non-Local (NL) framework. The major algorithmic contributions of this paper were the definition of an NL data term and an NL regularization term to effectively handle the intensity inhomogeneity and noise in the data. Then, the resulting energy formulation was built into an NL/FCM brain tissue segmentation algorithm. Experiments carried out on both the synthetic and real MRI data, leading to the classification of brain tissues into gray-matter, white matter, and cerebro-spinal fluid, have shown a substantial enhancement in performance in the case of higher noise levels, when compared to a range of standard algorithms.
Feature Extraction
The purpose of feature extraction is to reduce the original data set by measuring certain properties, or features, that distinguish one input pattern from another pattern [16]. The extracted feature is expected to provide the characteristics of the input type to the classifier by considering the description of the relevant properties of the image into a feature space. The proposed method,feature extraction method consists of Three steps
- Computation of Feature Vector FV1)
- Computation of Feature Vector F(V2)
- Concatenated of the two vectors
Computation of Feature Vector FV1)
Histogram based features are local in nature. These features do not consider spatial information into consideration. So for this purpose gray-level spatial co-occurrence matrix hd(i,j) based features are defined which are known as second order histogram based features. These features are based on the joint probability distribution of pairs of pixels. Distance d and angle θ within a given neighborhood are used for calculation of joint probability distribution between pixels. Normally d=1,2 and θ=0o,45 o, 90 o,135 o are used for calculation. Texture features can be described using this co-occurrence matrix [17]. In our proposed method, Feature Vector F(V1) (Five features such as, ASM, entropy, IDM, contrast and Maximum probability) is extracted from the co-occurrence matrix.
Computation of Feature Vector F (V2)
According to the neuropsychological findings, different types of incentive are processed disjoint, yet concurrently, by dissimilar neural mechanism previously to the stimulus is intentionally perceived as a whole. In the proposed method, feature extraction process is done with the help of enhanced Texton Co-occurrence Matrix (ETCM). In this method, both Histogram and co-occurrence matrix are used for feature extraction process. The relationship between the values of neighboring pixels is characterized by TCM. Histogram based techniques are simple to compute, but highest indexing performance. The co-occurrence matrix directly uses a feature representation of the image. If the dimension of the image is high, then the performance is decreased. The spatial information is lost when the histogram is used only for feature representation of the image. Hence combine both histogram and co-occurrence matrix for feature extraction and representation. In the ETCM method, four special types of textons are used for detecting the texton in the original image. It is shown in Figure 1.
fig1
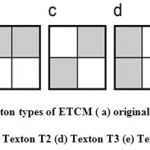 |
Figure 1: Special texton types of ETCM ( a) original 2×2 matrix (b)Texton T1 (c) Texton T2 (d) Texton T3 (e) Texton T4 |
Consider a 2 × 2 matrix in the image with four pixels P1, P2, P3 and P4. If two pixels have the same, then these pixels form a texton. The possible textons formed with different combination of pixels with same intensity values are denoted by T1, T2, T3 and T4 which are shown in Figure 1. The texton image is generated using these four texton templates with two pixel length as shown in Figure 2.
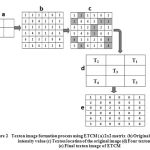 |
Figure 2: Texton image formation process using ETCM ( a) 2×2 matrix (b) Original image intensity value (c) Texton location of the original image (d) Four texton types (e) Final texton image of ETCM |
In Figure 2, the 2 × 2 matrices are shown in Figure 2 (a), the experimental image data are shown in Figure 2 (b), the four texton templates that slide over the entire experimental image from left to right and top to bottom with two pixel length to detect four textons is shown in Figure 2(c). The four different type textons are given in Figure 2(d). The four texton component images that are composed to form a final texton image is shown in Figure 2(e). After the formation of final texton image,the feature vector F(V2) (Five features such as, ASM, entropy, IDM, contrast and Maximum probability) is extracted from the final texton image.
Concatenated of the two vectors
Hence, total Feature vector uses dimensional vector as the concluding image features in the classification.
Final Classification
After feature extraction process, In-order to detect the presence of the tumor in the input MRI image, we perform the final classification step. Here we use the Support Vector Machine classifier to classify the image into tumorous or not. Support vector machine (SVM) is one of the techniques used for the classification purpose. SVM has also been applied to different real world problems such as face recognition, text categorization, cancer diagnosis, glaucoma diagnosis, microarray gene expression data analysis. Proposed system used SVM for binary classification of brain MR image as normal or tumor affected. SVM basically tries to divide the given data into decision surface. Decision surface is a hyper-plane which divides the data into two classes. Training points are the supporting vector which defines the hyper-plane. The basic theme of SVM is to maximize the margins between two classes of the hyper-plane[19-21].
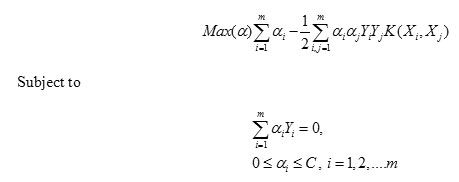
Given training vectors and a vector of labels, SVM provides the optimal hyperplane that aims to separate the training patterns. In the case of linearly separable classes this hyperplane maximizes the sum of the distances to the closest positive and negative training patterns. This sum is called margin. To construct the maximum margin or optimal separating hyperplane, we need to classify correctly the vectors Xi of the training set into two different classes Yi using the smallest norm of coefficients W.
For a nonlinear classifier, SVM maps the data points into a higher dimensional space H, where a separating hyperplane with maximal margin is constructed. The following quadratic optimization problem has to be solved
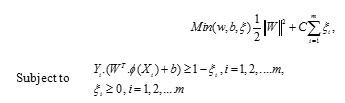
Where training data are mapped to the higher dimensional space H by the function X→Φ(X)εH A set of slack variables is introduced for each training vector and C is a penalty parameter on the training error.
Under this mapping the solution of an SVM has the form :
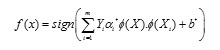
As can be seen, it is sufficient to compute the scalar products of the form. A kernel function k(X,Y) = Φ(X). Φ(Y) which defines an inner product in H performs the respective mapping leading to the following decision function f(x):
![]()
The optimal hyperplane is the one with a maximal distance to the closest image Φ(Xi) from the training data. The dual formulation can be stated as follows:
There are several common kernel functions namely,
- Linear : yi-yi
- Polynomial of degree d: (yi-yi+1)d,
- Radial basis function (RBF): exp

Material and Results
Input data set
For our proposed method, we have collected the various tumor and non tumor MRI images from south Indian area severity analysis which is undergone for processing the images. This image dataset contains 100 brain MRI images. In which, a total of 80 T1-weighted gadolinium enhanced MR images were tumorous .These 3D DICOM real images were obtained from the Government Medical College Hospital, Tirunelveli, Tamilnadu, India, using SIEMENS 1.5 Telsa MR unit. In each case ,only T1-weighted post contrast(Gadolinium) images ,Spin-Echo (SE) sequence (TR=480 ms ,TE=8.7 ms) ,Matrix size is 256 *256 and the slice thickness is 1 mm used for analysis.
Performance evaluation of proposed system
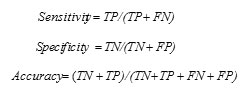
Classifier performance evaluation of this work is conducted with widely used statistical measures, sensitivity, specificity, accuracy and error rate [22]. True Positive (TP) is defined as the number of correctly identified positive pixels; True Negative (TN) is defined as correctly identified negative pixels. For example, in a diagnostic test, evaluation focusing on the presence of abnormal tissues, tumor samples is considered in the positive category and normal tissues will be in the negative category. False Positive (FP) represents the count of normal tissues incorrectly identified as a tumor, and False Negative (FN) gives the count of abnormal samples incorrectly identified as normal tissues. Higher values of sensitivity, the proportion of correctly classified positives, indicate better performance of the method in predicting positives. Specificity measures how well the system can predict the negatives. Accuracy measures the overall correctness of the classifier in predicting both positives and negatives, and overall error rate is calculated as per the following eqn.
Comparative analysis
We have compared our proposed tumor detection technique of FVF against the neural network techniques. The neural networks, we have utilized for comparative analysis is Feed Forward Neural Network (FFNN) and Radial Basis Function (RBF) neural network. The performance analysis has been made by plotting the graphs of evaluation metrics such as sensitivity, specificity and the accuracy are shown in Table-1.
Table 1: Experimental results of existing and proposed method
|
Evaluation metrics |
Texture Features with kernel SVM | Texture Features with RBF | Texture Features with RBF | ||
| Input MRI image data set | TP | 38 | 37 | 35 | |
| TN | 9 | 8 | 8 | ||
| FP | 1 | 2 | 2 | ||
| FN | 2 | 3 | 5 | ||
| Sensitivity | 95 | 92.5 | 87.5 | ||
| Specificity | 90 | 80 | 80 | ||
| Accuracy | 94 | 90 | 86 | ||
| Total error(%) | 6 | 10 | 14 | ||
By analyzing the plotted graph; the performance of the proposed technique has significantly improved the tumor detection compared with Feed Forward Neural Network (FFNN) and Radial Basis Function (RBF) neural network classifier. The evaluation graphs of the sensitivity, specificity and the accuracy graph are shown in Fig.2. Based on the experimental results our proposed method produces better results compared to other neural network based classifiers. The brain tumor classification error bar is also given in Fig 3.
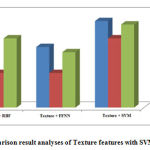 |
Figure 2: Comparison result analyses of Texture features with SVM, RBF and FFNN |
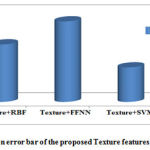 |
Figure 3: Comparison error bar of the proposed Texture features with various classifiers |
Conclusion
In this paper, we have developed an automated brain MRI diagnostic system with normal and abnormal classes. The medical decision making system was designed with the Texture features and kernel based Support Vector Machine. The proposed approach comprises feature extraction and classification. The benefit of the system is to assist the physician to make the final decision without hesitation. According to the experimental results, the proposed method is efficient for the classification of the human brain into normal and abnormal. For comparative analysis, our proposed approach is compared with other neural networks RBF and FFNN. The accuracy level (94%) for our proposed method proved that the proposed algorithm graph is good at detecting the tumors in the brain MRI images.
References
- Liévin, M., Hanssen, N., Zerfass, P., Keeve, E., 2001. 3D Markov random fields and region growing for interactive segmentation of MR data. In: Proceedings of the 4th International Conference on Medical Image Computing and Computer- Assisted Intervention. Springer-Verlag, pp. 1191–1192
- Hajar Hamidian, H.S.-Z., Faraji-Dana, Reza, Gity, Masoumeh, 2010. Data-guide for brain deformation in surgery: comparison of linear and nonlinear models. BioMed. Eng. OnLine 9, 1–19.
- Chia-Chi Teng, L.G.S., Kalet, Ira J., 2010. Head and neck lymph node region delineation with image registration. BioMed. Eng. OnLine 9, 1.
- Jayachandran, A & Dhanasekaran, R, “Severity Analysis of Brain Tumor in MRI Images using Modified Multi-Texton Structure Descriptor and Kernel- SVM, The Arabian Journal of science and engineering October 2014, Volume 39, Issue 10, pp 7073-7086,(2014).
- Cobzas D, Birkbeck N, Schmidt M, Jagersand M, Murtha A. 3D variational brain tumor segmentation using a high dimensional feature set. In: Presented at computer vision, 2007. IEEE 11th international conference on ICCV 2007.2007.
- Daugman JG. Complete discrete 2-D Gabor transforms by neural networks for image analysis and compression. IEEE Trans Acoustics, Speech Signal Process1988;36 (7): 1169–79.
- Lee TS. Image representation using 2D Gabor wavelets. IEEE Trans Pattern Anal Math Intell 1996;18(10):959–71.
- Vaidyanathan M, Clarke L, Velthuizen R, Phuphanich S, Bensaid A, Hall L, BezdekJ, Greenberg H, Trotti A, Silbiger M. Comparison of supervised MRI segmentation methods for tumor volume determination during therapy. Magn Reson Imaging 1995;13(5):719–28
- Zhang J, Ma KK, Er MH, Chong V. Tumor segmentation from magnetic resonance imaging by learning via one-class support vector machine. In: Presented at international workshop on advanced image technology (IWAIT’04).2004.
- Yazdan-Shahmorad A, Jahanian H, Patel S, Soltanian-Zadeh H. Automatic brain tumor segmentation using tissue diffisivity characteristics. In: Presented at biomedical imaging: from nano to macro, 2007. 4th IEEE International Symposium on ISBI 2007. 2007.
- Fletcher-Heath LM, Hall LO, Goldgof DB, Murtagh FR. Automatic segmentation of non-enhancing brain tumors in magnetic resonance images. Artif Intell Med2001;21(1–3):43–63.
- Kekre, Dr.Tanuja Sarode and Ms.Kavita Raut, “Detection Of Tumor In MRI Using Vector Quantization Segmentation”, International Journal of Engineering Science and Technology, Vol. 2, No.8, pp.3753-3757, 2010.
- Shan Shen, William Sandham, Malcolm Granat, and Annette Sterr, “MRI Fuzzy Segmentation of Brain Tissue Using Neighborhood Attraction With Neural Network Optimization,” IEEE Transactions on Information Technology in Biomedicine., vol. 9, no. 3, September.2005.
- Jue Wu and Albert C.S. Chung, “A novel framework for segmentation of deep brain structures based on Markov dependence tree,” Elsevier, Vol.46, pp.1027–1036, 2009.
- Caldairou, N. Passat, P. Habas, C. Studholme and F. Rousseau, “A Non-Local Fuzzy Segmentation Method: Application to Brain MRI”, Lecture Notes in Computer Science, Vol. 5702, pp.606-613, 2009.
- M.J Nassiri,etal.,Texture feature extraction using Slant-Hadamard transform,World Academy of Science, Engineering and Technology17(2006)40–44.
- Haralick, RM, Shanmugam, K and Dinstein, IH 1973, ‘Textural features for image classification’, IEEE Transactions on Systems, Man and Cybernetics, vol. 6, pp. 610-621.
- Ma, L., Wang, Y, and Tan, T., ” Iris recognition based on multichannel Gabor filtering”, In Proc. Fifth Asian Conf. Computer Vision, Vol. 1, pp. 279-283, 2002.
- Zhang J., Liu Y., Cervical Cancer Detection Using SVM Based Feature Screening, Proc of the 7th Medical Image Computing and Computer-Assisted Intervention ,vol. 2, pp.873-880,2004.
- Zhang K., CAO H.X., Yan H., Application of support vector machines on network abnormal intrusion detection. Application Research of Computers, vol.5, pp.98-100, 2006.
- Jayachandran A, Dhanasekaran R, “Automatic detection of brain tumor in magnetic resonance images using multi-texton histogram and support vector machine”, International Journal of Imaging Systems and Technology, Vol. 23, no. 2, pp. 97–103, (2013).
- Wen Zhu, Nancy Zeng, Ning Wang, “Sensitivity, Specificity, Accuracy, Associated Confidence Interval and ROC Analysis with Practical SAS Implementations”, Proceedings of the SAS Conference, Baltimore, Maryland, pages: 9, 2010.

