
Manuscript accepted on :
Published online on: --
Plagiarism Check: Yes
Ramin Gossili1, Arezoo Niknezhad1, Maryam Samadifar1 and Fatima Rashid Sheykhahmad2*
1Department of Medical, Ardabil Branch, Islamic Azad University, Ardabil, Iran. 2Young Researchers and Elite club, Electronic Branch, Islamic Azad University, Tehran, Iran.
DOI : https://dx.doi.org/10.13005/bpj/859
Abstract
Sinusitis is a common disease in children, sinusitis, acute and chronic inflammation of the mucosal layer in one or more of the nasal cavity is called. One of the new methods used in this communication, electromagnetic therapy is therefore in this study we decided to design this study to evaluate the therapeutic effects of this technique on chronic sinusitis. This article is a clinical trial. The population study included 40 patients for treatment of sinusitis, children were admitted to a private clinic. In this study, 52 children (20 children treated with electromagnetic therapy and antibiotic therapy and 32 patients undergoing antibiotic treatment alone (control)), were studied. After the first follow-up of patients was observed between the groups, there was no significant difference in the number of symptoms. After the first follow-up of patients was observed between the groups, there was no significant difference in the number of symptoms.(With significant levels 0.433). The significant difference between the groups in terms of PND (with significant levels 0.274), halitosis (with significant levels 0.732), the first follow-up there. However, significant differences between the groups in terms of nasal obstruction in the first follow-up (with significant levels 045/0) there. The results showed that the effectiveness of electromagnetic therapy combined with antibiotic treatment of chronic sinusitis than antibiotic therapy alone, respectively. The results of this study and comparison with other studies showed that a high-performance electromagnetic therapy in the treatment of patients with sinusitis.
Keywords
Electromagnetic therapy; Antibiotics; Chronic sinusitis; Children; Sinusitis
Download this article as:| Copy the following to cite this article: Gossili R, Niknezhad A, Samadifar M, Sheykhahmad F. R. Effects of Electromagnetic Therapy in Chronic Sinusitis with Antibiotics (Case Study: Children 6 to 12 years). Biomed Pharmacol J 2015;8(2) |
| Copy the following to cite this URL: Gossili R, Niknezhad A, Samadifar M, Sheykhahmad F. R. Effects of Electromagnetic Therapy in Chronic Sinusitis with Antibiotics (Case Study: Children 6 to 12 years). Biomed Pharmacol J 2015;8(2). Available from: http://biomedpharmajournal.org/?p=5870 |
Introduction
Sinusitis is inflammation of the sinuses, which are holes in the cranium. Etiology may be infectious (microbial- viral- fungal), or noninfectious (allergic). This inflammation leads to the obstruction of sinus drainage, and leads to accumulation of mucus, hypoxia and decrease of mucociliary clearance; and may prepare the way for bacterial growth.
Kinds of sinusitis:
- Acute Sinusitis with the symptoms for less than 4 weeks
- Sub-acute sinusitis with the symptoms for 4 to 8 weeks
- Chronic sinusitis with the symptoms persist for more than 8 weeks
- Recurrent acute sinusitis often three times more attacks in the year which an attack of sinusitis lasts less than 2 weeks
Incidence
Incidence of acute sinusitis is increasing. According to data from the National Hospital Medical Care, sinusitis has been increased from 0.2 in 1990 to 0.4 percent in 1995 (2). In 2001, about 13.6 million outpatient visits at centers in the United States have been diagnosed with sinusitis (3).
Nearly 40 million Americans are affected by sinusitis in the year, and each year about 33 million cases of chronic sinusitis are reported to CDC (Center for Disease Control) (4).
When sinusitis was associated with common diseases such as allergic rhinitis, asthma, chronic bronchitis it affected more than 90 million people (about one third) of Americans (5). And based on its socio-economic impact, sinusitis treatment costs raised more than 8.5 million dollars (6).
When the bacterial growth causing acute sinusitis, it is the most common organisms of Streptococcus pneumoniae, Haemophilus influenzae and Moraxella catarrhalis (9). In addition to these organisms in chronic sinusitis, Staphylococcus aureus, coagulase-negative Staphylococcus species, and anaerobic bacteria could be the involved organisms. Organisms which have been isolated from the patients with chronic sinusitis have had antibiotic resistance. In fact, the resistance of peniciline for Strentocoke pneumonia is more than 44 percent in the United States (10). These resistant organisms are common in patients that have received more than 2 antibiotics.
Investigation of the effect of electromagnetic therapy in the treatment of chronic sinusitis in children 6 to 12 years old compared with antibiotic therapy in 50 children 6 to 12 years old , in Ardebil Sabalan Hospital in 2012-2013.
- To evaluate the effect of electromagnetic therapy in children with chronic sinusitis
- Compare the treatment of chronic sinusitis in children with antibiotic treatment
- Identify the number of people treated with electromagnetic therapy hand have recovery, in comparison with the number of people who were cured with antibiotic therapy only.
- Determination of the effects of electromagnetic therapy in different age groups.
Hypothesis
- Antibiotic therapy is effective in treating chronic sinusitis.
- Electromagnetic therapy with antibiotic therapy of chronic sinusitis is more effective than antibiotics alone .
- The effects of electromagnetic therapy in the treatment of sinusitis among boys were higher than girls.
- The effects of electromagnetic therapy in younger children in comparison with older are less.
Materials and testing methods
The population and sample size
The population of the study includes 52 patients who were admitted to a private clinic in order to treat their sinusitis. In this study, all patients were divided into two groups (treated with electromagnetic therapy with antibiotic treatment) and control group (treated with antibiotics alone) accidentally.
Data Collection method
The patients were randomly divided into two groups and for groups, electromagnetic treatment with antibiotic treatment, and for the control group, only antibiotic treatment, was started. The improvement of symptoms, side effects (drug or treatment from electromagnetic), recurrence and clinical situation of the patients were evaluated during one month.
Children age
As can be seen in terms of age distribution, the patients in the experimental group and control group are different from each other, so that the age of control group with 53.1% in 10-12 years age group; and the of experimental age group with 45% in 9-8 years of age are the most population. It can be declared that the age distribution of patients in the two groups are not identical. (Figure 1-4)
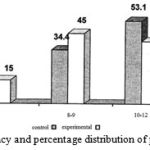 |
Figure 1: Frequency and percentage distribution of patients by age |
Children genders
As can be seen, in terms of gender distribution of patients, they are different in control group and experimental group. In the control group 53.1% are male and 46.9% are female; and in the experimental group 39.3% are male and 28.8% are female respectively. As can declared that the number of male and female patients in the control group is higher fro the same number of cases in another group. (Figure 2 )
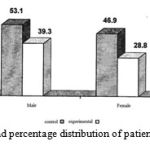 |
Figure 2: Frequency and percentage distribution of patients according to gender |
PND
As can be seen, in terms of the distribution of the symptoms of PND patients, both groups (control and experimental) are observed. It can be declared that the above symptom is common at the first visit of the children with chronic sinusitis. And from this point of view there is no difference in them. (Figure 3-4 )
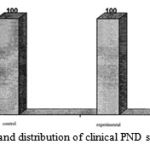 |
Figure 3: Frequency and distribution of clinical PND symptoms in patients |
Night time cough
As can be seen, in terms of the distribution of cough in patients, 65.6% of the control group and 65% of experimental group have had above symptom; so it can be concluded that there is no different between both groups in terms of cough symptoms in children patients at the first visit. (Figure 4)
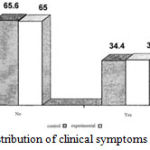 |
Figure 4: The frequency and distribution of clinical symptoms in patients with nocturnal cough |
Halitosis
As can be seen, the distribution of the symptoms of bad breath in patients, 78.1% of the control group and 75% of the experimental group have had the above clinical symptom; so it can be concluded that clinical signs of halitosis children at their first visit are not different between both groups. (Figure 5)
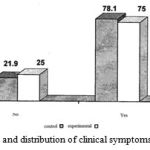 |
Figure 5: The frequency and distribution of clinical symptoms in patients with halitosis |
Stuffy nose
As can be seen, the distribution of stuffy nose symptoms in patients, 84.4% of the control group and 95% of the experimental group have had no above symptom, so it can be mentioned that due to nonobservance of clinical symptoms of nasal stuffy among the children at their first visit, there is no significant difference between both groups. (Figure 6)
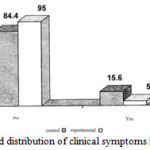 |
Figure 6: The frequency and distribution of clinical symptoms in patients with nasal stuffy |
Pus discharge from the nose
The distribution of nasal discharge symptoms among the patients has not been reported for 65.6% of the control group and 10% of the experimental group; so it can be mentioned that due to the lack of clinical symptoms of nasal discharge in patients at their first visit, there was no significant difference between both groups. (Figure 7)
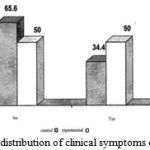 |
Figure 7: The frequency and distribution of clinical symptoms of nasal discharge patients |
Morning sickness
As can be seen, in terms of the distribution of morning sickness symptoms in patients, 81.3% of control group and 85% of the experimental group have has above symptoms, so it can be mentioned that due to the lack of clinical symptoms of morning sickness among Children, there was no significant difference between both groups. (Figure 8)
 |
Figure 8: The frequency and distribution of morning sickness symptoms in patients |
Frontal Pain
As can be seen, in terms of the distribution of pain in frontal, 62.5% of the control group and 60% of experimental group have had the above clinical symptom, so it can be concluded that the clinical symptoms of pain in the forehead in children at their first visit, there was no significant difference between both two groups. (Figure 9)
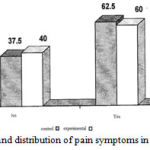 |
Figure 9: The frequency and distribution of pain symptoms in patients with frontal pain |
Maxillary pain
As can be seen, in terms of the distribution of maxillary pain symptoms, 75% of control group and 75% of the experimental group have not had these symptoms, so it is concluded that because of nonobservance of clinical symptoms of Maxillary among the children at their first visit, there was no significant difference between both two groups. (Figure 10)
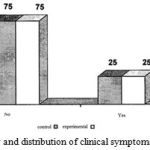 |
Figure 10: The frequency and distribution of clinical symptoms of Maxillary in patients |
Fever
As can be seen, in terms of the distribution of fever among the children, 84.4% of the control group and 75% of the experimental group have had no above symptoms, so it can be mentioned that due to the nonobservance of fever among children, at their first visit, there was no significant difference between both groups. (Figure 11)
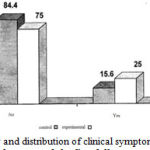 |
Figure 11: the frequency and distribution of clinical symptoms in patients with fever |
The number of symptoms in the control group and the first follow-up
The results show that in the first follow-up, there is no significant differences between the control group and experimental group in terms of symptoms. So that 65.6% of the control group and 65 % of experimental group did not show any symptoms; and 34.4% of the control group showed only a symptom and 5% of experimental group showed only two symptoms and 30 % of experimental group showed one symptom.
Table 1: The number of symptoms in the control group and experimental group at the first follow-up by Chi-Square test
|
|
the number of symptoms | the number of data | ||||
| 0 | 1 | 2 | ||||
| Group | control | observed number | 21 | 11 | 0 | 32 |
| expected number | 20.9 | 5.1 | 6 | 32 | ||
| percent of control group | 65.6 | 34.2 | 0 | 100 | ||
| experimental | observed number | 13 | 6 | 1 | 20 | |
| expected number | 13.1 | 6.5 | 4 | 20 | ||
| percent of experimental group | 65 | 30 | 5 |
100 |
||
Chi-Square Tests
| Value | df | significant level of test | |
| Pearson Chi-Square | 1.673a | 2 | 0.233 |
| N of Valid Cases | 52 |
The number of symptoms in the control group and experimental group at the second follow-up
The results show that in the second follow-up there is a significant difference between both groups in terms of symptoms, so that 28.1% of control group did not show any of the symptoms while 75% of the experimental group did not show any symptoms. In addition, 15.6 % of the control group showed two symptoms; and 56.2% showed one symptom, while 25% of experimental group only showed one symptom.
Table 2: The number of symptoms in the control group and experimental group at the second follow-up by Chi-Square test
| the number of symptoms | the number of data | |||||
| 0 | 1 | 2 | ||||
| Group | control | observed number | 9 | 18 | 5 | 32 |
| expected number | 14.8 | 14.2 | 3.1 | 32 | ||
| percent of control group | 28.1 | 56.2 | 15.6 | 100 | ||
| experimental | observed number | 15 | 5 | 0 | 20 | |
| expected number | 9.3 | 0.8 | 1.9 | 20 | ||
| percent of experimental group | 75 | 25 | 0 | 100 | ||
Chi-Square Tests
| Value | df | significant level of test | |
| Pearson Chi-Square | 11.702a | 2 | 0.003 |
| N of Valid Cases | 52 |
Comparison of PND in the control group and experimental group at the first follow-up
The results show that in the first follow-up there is no significant difference between both groups in terms of PND. So that 28.1% of the control group and 15% of experimental group showed PND.
Table 3: Comparison of PND in the control group and experimental group at the first follow-up through Chi-Sqrare Test
| PND at the first follow-up | the number of data | ||||
| 0 | 1 | ||||
| Group | control | observed number | 21 | 11 | 32 |
| expected number | 23.4 | 8.6 | 32 | ||
| percent of control group | 65.6 | 34.4 | 100 | ||
| experimental | observed number | 17 | 3 | 20 | |
| expected number | 14.6 | 5.4 | 20 | ||
| percent of experimental group | 85 | 15 | 100 | ||
Chi-Square Tests
| Value | df | significant level of test | |
| Pearson Chi-Square | 2.348a | 1 | 0.125 |
| N of Valid Cases | 52 |
Comparison of halitosis in the control group and experimental group at the first follow-up
The results show that in the first follow-up, there is no significant difference between both groups in terms of bad breath. So that 3.1% of the control group and 5 % of experimental group have shown bad breath.
Table 5: Comparison of halitosis in the control group and experimental group at the first follow-up by Chi-Sqrare Test
| bad breath at the first follow-up | the number of data | ||||
| 0 | 1 | ||||
| Group | control | observed number | 31 | 1 | 32 |
| expected number | 30.8 | 1.2 | 32 | ||
| percent of control group | 96.9 | 3.1 | 100 | ||
| experimental | observed number | 19 | 1 | 20 | |
| expected number | 19.2 | 0.8 | 20 | ||
| percent of experimental group | 95 | 5 | 100 | ||
Chi-Square Tests
| Value | df | significant level of test | |
| Pearson Chi-Square | 0.117a | 1 | 0.732 |
| N of Valid Cases | 52 |
Comparison of halitosis in the control group and experimental group at the second follow-up
The results show that in the second follow-up, there is no significant difference between both groups in terms of bad breath. However, the significant level of test is very close to 5%, and if the error rate will be considered 10% this difference could be significant. So that 25% of control group and 5% of experimental group have shown bad breath.
Table 6: comparison of bad breath in the control group and experimental group at the second follow-up by Chi-Sqrare Test
| bad breath at the second follow-up | the number of data | ||||
| 0 | 1 | ||||
| Group | control | observed number | 24 | 8 | 32 |
| expected number | 26.5 | 5.5 | 32 | ||
| percent of control group | 75 | 25 | 100 | ||
| experimental | observed number | 19 | 1 | 20 | |
| expected number | 16.5 | 3.5 | 20 | ||
| percent of experimental group | 95 | 5 | 100 | ||
Chi-Square Tests
| Value | df | significant level of test | |
| Pearson Chi-Square | 3.240a | 1 | 0.064 |
| N of Valid Cases | 52 |
Comparison of nasal stuffy in the control group and experimental group at the first follow-up
The results show that in the first follow-up, there is a significant difference between both groups in terms of nasal stuffy. So that 3.1% of the control group and 20 % of experimental group have shown nasal stuffy. And the significant level was under 5%.
Table 7. Comparison of nasal stuffy in the control group and experimental group at the first follow-up by Chi-Sqrare Test
| nasal stuffy at the first follow-up | the number of data | ||||
| 0 | 1 | ||||
| Group | control | observed number | 31 | 1 | 32 |
| expected number | 28.9 | 3.1 | 32 | ||
| percent of control group | 96.9 | 3.1 | 100 | ||
| experimental | observed number | 16 | 4 | 20 | |
| expected number | 18.1 | 1.9 | 20 | ||
| percent of experimental group | 80 | 20 | 100 | ||
Chi-Square Tests
| Value | df | significant level of test | |
| Pearson Chi-Square | 4.033a | 1 | 0.045 |
| N of Valid Cases | 52 |
Comparison of nasal stuffy in the control group and experimental group at the second follow-up
The results show that in the second follow-up, there are no significant differences between both groups in terms of nasal stuffy. So that 3.1% of the control group and 5 % of experimental group have shown the nasal stuffy.
Table 8: Comparison of nasal stuffy in the control group and experimental group at the second follow-up by Chi-Sqrare Test
| nasal stuffy at the first follow-up | the number of data | ||||
| 0 | 1 | ||||
| Group | control | observed number | 31 | 1 | 32 |
| expected number | 30.8 | 1.2 | 32 | ||
| percent of control group | 96.9 | 3.1 | 100 | ||
| experimental | observed number | 19 | 1 | 20 | |
| expected number | 19.2 | 0.8 | 20 | ||
| percent of experimental group | 95 | 5 | 100 | ||
Chi-Square Tests
| Value | df | significant level of test | |
| Pearson Chi-Square | 0.117a | 1 | 0.732 |
| N of Valid Cases | 52 |
Conclusion
The results showed that the impact of electromagnetic therapy combined with antibiotic treatment of chronic sinusitis was effective than antibiotic therapy alone. The results of this study and comparison with other studies showed that electromagnetic therapy is a method with high-performance in the treatment of sinusitis. However, in this study the effectiveness of electromagnetic therapy to prevent the return of symptoms was not observed. After follow-up it was seen that in the first follow-up (two weeks after starting treatment), there was no significant difference between both groups in terms of the number of symptoms. In the second follow-up (one month after starting treatment) there was significant difference in among both groups in terms of the number of symptoms.
Resources
Reference
- Shoseyov, David, et al. “Treatment with hypertonic saline versus normal saline nasal wash of pediatric chronic sinusitis.” Journal of allergy and clinical immunology5 (1998): 602-605.
- Maniglia, Anthony J., et al. “Intracranial abscesses secondary to nasal, sinus, and orbital infections in adults and children.” Archives of Otolaryngology–Head & Neck Surgery12 (1989): 1424-1429.
- Steele, Russell W. “Chronic sinusitis in children.” Clinical pediatrics6 (2005): 465-471.
- Hamilos, Daniel L. “Chronic sinusitis.” Journal of Allergy and Clinical Immunology2 (2000): 213-227.
- Rosenfeld, Richard M., et al. “Clinical practice guideline: adult sinusitis.” Otolaryngology-Head and Neck Surgery3 (2007): S1-S31.
- Garbutt, Jane M., et al. “A randomized, placebo-controlled trial of antimicrobial treatment for children with clinically diagnosed acute sinusitis.” Pediatrics4 (2001): 619-625.
- Meltzer, Eli O., et al. “Added relief in the treatment of acute recurrent sinusitis with adjunctive mometasone furoate nasal spray.” Journal of allergy and clinical immunology4 (2000): 630-637.
- Brook, Itzhak. “Topical Review: Brain Abscess in Children: Microbiology and Management.” Journal of child neurology4 (1995): 283-288.
- Kriss, Timothy C., Vesna Martich Kriss, and Benjamin C. Warf. “Cavernous sinus thrombophlebitis: case report.” Neurosurgery2 (1996): 385-389.
- Wasay, Mohammad, et al. “Cerebral venous sinus thrombosis in children: a multicenter cohort from the United States.” Journal of child neurology1 (2008): 26-31.
- Kristo, Aila, et al. “Cefuroxime axetil versus placebo for children with acute respiratory infection and imaging evidence of sinusitis: a randomized, controlled trial.” Acta Paediatrica9 (2005): 1208-1213.
- Schubert, Mark S., and David W. Goetz. “Evaluation and treatment of allergic fungal sinusitis. I. Demographics and diagnosis.” Journal of Allergy and Clinical Immunology3 (1998): 387-394.
- Kombogiorgas, D., et al. “Suppurative intracranial complications of sinusitis in adolescence. Single institute experience and review of literature.” British journal of neurosurgery6 (2007): 603-609.
- Ong, Yew Kwang, and Henry Kun Kiaang Tan. “Suppurative intracranial complications of sinusitis in children.” International journal of pediatric otorhinolaryngology1 (2002): 49-54.

