
Manuscript accepted on :
Published online on: --
Plagiarism Check: Yes
Khadijeh Falahaty1*, Loke Seng Cheong2, Muhammad Bin Haji Mohd Isa3
1Institute of Gerontology, Faculty of Medicine, Universiti Putra Malaysia, Serdang, Malaysia 2Institute of Gerontology, Faculty of Medicine, Universiti Putra Malaysia, Serdang, Malaysia 3Department of Ophthalmology, Faculty of Medicine, Universiti Putra Malaysia, Serdang, Malaysia
DOI : https://dx.doi.org/10.13005/bpj/897
Abstract
The purpose of this study was to determine factors are associated to visual impairment and assess disability (ADL&IADL) among two welfare home residents. A cross-sectional design was employed to determine the factors that are associated with visual impairment among elderly people. A total of 150 subjects were selected by simple random sampling from two welfare homes (Cheras in Selangor, and Seremban) in Malaysia. The socio-demographic variables (age, gender, ethnicity, income), health behavior (smoking) and self-reported medical condition (diabetic, eye disease, hypertension, heart disease, and stroke) were examined in relationship with visual impairment. Instruments used in this study included eye exam test by Snellen E Chart, activities of daily living (ADL) scales, instrumental activities of daily living (IADL) scales and a list of questions about socio-demographic factors, health behavior and self-reported medical conditions and disease. Data analyzes were carried out using SPSS, 20. Descriptive analysis such as mean, standard deviation (SD) and frequency were utilized to describe the characteristics of the respondents. The mean age of respondents was 69 years (SD = 7.31). A chi-square test (Pd” 0.05) and multiple linear regression (R2=0.64) analyzes were utilized to determine predictors of visual impairment, the effect of visual impairment on disability examined by a bivariate test. It was found that the majority respondents had visual impairment (46%) and blindness (28%) in compare with normal vision (26%).Sociodemographic factors (age,gender,ethnicity,income) health behavior (smoking) and disease (diabetic,eye disease, heart disease, hypertension and stroke) were associated to visual impairment. Visually impaired elderly had more difficulties in ADL and IADL. The results indicated the important role of visual impairment on disability among elderly people. Health care providers are in position to prevent and control of visual impairment. Health care professionals should be trained to asses and be sensitive to disability issues in old age.
Keywords
visual impairment; disability; welfare homes; elderly
Download this article as:| Copy the following to cite this article: Falahaty K, Cheong L. S, Isa M. B. H. M. Disability among Elderly People with Visual Impairment in Two Welfare Homes in Malaysia. Biomed Pharmacol J 2015;8(2) |
| Copy the following to cite this URL: Falahaty K, Cheong L. S, Isa M. B. H. M. Disability among Elderly People with Visual Impairment in Two Welfare Homes in Malaysia. Biomed Pharmacol J 2015;8(2). Available from: http://biomedpharmajournal.org/?p=5951 |
Introduction
The ageing population has become a global phenomenon. World Health Organization revealed that the cohort of 60 years and above is expected to increase globally from 600 million in 2000 to 1.2 billion in 2050 [1]. The strong association between visual impairment and disability , such as self-reported difficulties in activities of daily living (ADL) and instrumental activities of daily living (IADL) has been reported in several resent cross sectional and longitudinal studies [2, 3].Malaysia like many other countries world-wide is experiencing the population aging phenomenon, owing to declining fertility rates combined with increasing life expectancy over the latter half of the 20th century [4]. With increasing life expectancy, it is predicted that the number of people with visual impairment will increase significantly in the near future. World health organization stated globally 285 million people were visually impaired that 39 million were blind and 246 million had low vision. About 90% of the worlds visually impaired lived in developing countries. Globally, uncorrected refractive errors were the main cause of visual impairment. Cataracts remained the leading cause of blindness in middle and low income countries. The number of visually impaired people from infectious diseases had greatly reduced in the last 20 years and 80% of all visual impairments could have been avoided or cured [5]. Despite the rapid ageing of the population and increasing number of visually impaired elderly, there is a little study about visual impairment among elderly people in Malaysia. Consequently, it is necessary to do this research and identify factors which affect the visual impairment among elderly people. Investigating about risk factors that predict visual impairment and disability among elderly can be useful for identifying needs in treatment and rehabilitation services, planning and implementing blindness prevention programs, and determining priorities for aging population. The purpose of this study is to determine the factors that are associated with visual impairment and disability older persons in two welfare homes in Malaysia.
Research Framework
Based on the literature review that examined the visual impairment; risk factors for visual impairment ; disability; measurement of disability; the relationship between visual impairment and disability .The framework classifies three types of risk factors; first, socio-demographic factors, secondly, health behavior factors and thirdly, diseases or impairment. The socio-demographic factors include age, gender, ethnicity and socioeconomic. Health behavior includes smoking. In this framework, diseases are classified as medical conditions such as: Diabetic, eye disease, hypertension, heart disease and stroke. The outcomes in this research framework are visual impairment, disability. Visual impairment is defined as scores of Snellen E Chart and disability is defined as any difficulty in performing activities of daily living and instrumental activities of daily living.
Riskfactors
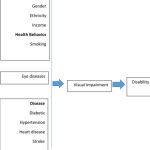 |
Figure 1: Research Frameworks for Visual Impairment and Disability |
Risk factors of visual impairment in old age
Age: Visual acuity (VA) declines and the prevalence of visual impairment increases with increasing age; Visual acuity declines with age and this deterioration is faster in higher age [6]. The prevalence of visual impairment increases from 0–0.6% in persons aged 40–49 years to 3–12% in persons aged 70 years and older and to 6–27% in persons aged 80 years and older [7, 8, 9, 10, 11, 12].
Gender: A meta-analysis of population-based surveys on blindness prevalence in Asia, Africa, and the industrialized countries in 2000 indicated that women bear approximately two-thirds of the burden of blindness in the world [13]. Two large population-based surveys in Africa showed a statistically higher prevalence of blindness (adjusted for age) among women compared to men.
Ethnicity: Many of the differences by race can also be attributed to interactions between race and life expectancy, as well as health disparities, and socioeconomic variables. A study in UK reported that blacks and south Asians had a higher prevalence of visual impairment compared to white people [14]. According to the chronic disease center (CDC) in 2006 year, the prevalence of “vision troubles” among African Americans is 9.4%, but only 8.9% for their white counterparts. According to The Eye Diseases Prevalence Research Group (2004a), the specific pathological causes of blindness and visual impairment differ by race.
Socioeconomic (income): It is not inconceivable that lower income is a contributing factor to worse eye health and poorer access tocorrective lenses. A study in Malaysia reported that the prevalence of visual impairment and blindness varies geographically due to socio-economic factors, availability of health services and awareness of eye diseases among the population. Having a low income and lower Educational attainment were significantly associated with reported vision problems.
Health behavior factors in visual impairment
Smoking is linked to self-reported visual impairment among older adults with age-related eye diseases, particularly cataract and age-related macular degeneration [15]. Smoking is thought to depress antioxidant levels, decrease luteal pigments in the retina, activate the immune system, reduce choroid blood flow, reduce drug detoxification by the retinal pigment epithelium, and potentiate nicotine antigenic activities, all of which have been hypothesized to be involved in the pathogenesis of AMD [16].
Disease and impairments
Eye Disease affecting vision in old age
In addition to normal age related changes in vision, many primary ocular disease as well as systematic disease affect visual functions. Age related macular degeneration (AMD) is an ocular disease that causes damage to the retinal macula, mostly in the older people. AMD is a disease that gradually destroys sharp, central vision ultimately leaving the affected individual with only orienting vision and the peripheral visual field [17].
Central vision is needed for seeing objects clearly and for common daily tasks. AMD occurs in two main forms: wet and dry. Wet AMD occurs when abnormal blood vessels behind the retina start to grow under the macula. These new blood vessels tend to be very fragile and leak blood and fluid .the blood and fluid raise the macula from its normal place.
Damage to the macula and consequently loss of central vision may occur rapidly in days or weeks. Dry AMD occurs when the light sensitive cells in the macula slowly break down gradually blurring central vision [18] normal aging processes can lead to structural and blow flow changes that can predispose patients to AMD, also advanced aged does not inevitably
cause AMD .however age as well as family history smoking and hypertension are considered risk factors for age related macular degeneration [19]. AMD is the leading cause of visual deterioration and legal blindness in patients over 60 years of age in the western world [20].
Cataract is a common cause of visual loss in older population [20]. cataract occurs as the lens become cloudy and yellowish with aging .the normal lens is clear .cataract reduces visual acuity and the loss of transparency in the lens may also contribute to a decrease in the ability to discriminate colours .in addition to advanced age smoking diabetes and exposure to UVB light have consistently been identified as risk factors for cataract development [21]. The prevalence cataract increases significantly with age from 2%in persons under 65to 67%in those aged 85 or older [22].
Glaucoma is considered one of the leading causes of visual impairment in the world .primary open angle glaucoma is the most common form of the disease, representing around 90% of all cases [23]. Risk factors for glaucoma include age (glaucoma is significantly more common after age 45), family history, diabetes, and most notably, race/ethnicity [24]. Anthony et al, reported that Cataracts, diabetes, and glaucoma in particular, were significantly associated with reported vision problem
Visual impairment remains an important public health problem in people with diabetes [14] and insulin use, longer diabetes duration and higher levels of blood glucose are associated with retinopathy in persons with diabetes [25]. Visual impairment adds to the burden of several other microvascular and macrovascular complications in people with diabetes, threatens independence and compromises quality of life [26]. Diabetes is one of the leading causes of visual loss in older people. Diabetic retinopathy is the result of micro vascular retinal changes.
A recent meta-analysis of nine cohort studies failed to demonstrate any significant association between primary open-angle glaucoma and all-cause or cardiovascular mortality [27]. Studies examining the association between retinal vein occlusion (RVO) and mortality have found as much as a two-fold increase in the risk of cardiovascular mortality in persons with RVO [28]. Other systematic disease especially cardiovascular disease, hypertension, thyroid and romatoide disease, may affect the eye [18]. Cataract may be associated with cardiovascular disease, diabetes and hypertension [29]. Cataract has also shown to be associated with increased cancer and cardiovascular mortality risk [30].
Hypertension
Systolic blood pressure was identified as the major correlate of intraocular pressure (IOP) [31]. Hypertension and diabetes were associated to the prevalence of visual impairment [32]. Hypertensive retinopathy refers to retinal micro vascular signs that are related to raise blood pressure [33].
Stroke can lead to a variety of ocular motility disorders including infra nuclear cranial nerve palsies, supra nuclear gaze disorders, intern clear ophthalmoplegia, nystagmus and ocular dysmetria [34]. Visual field loss has many causes but is a well-recognized complication of stroke, with an incidence in acute stroke patients reported as 20% [35].
Disability
Traditionally, the health status of a population has been evaluated with disease prevalence rates and mortality. Although these figures are important, they are not adequate measures to describe the consequences of diseases and impairments on people’s functional capacity. Functional status and assessment of disability are additional approaches for evaluating health. The development of disability may vary considerably even among persons with the same diseases or impairments. Thus, identifying the factors associated with disability or maintaining a good functional ability is crucial. To understand the complex process of disability and to clarify the terminology, various conceptual models have been presented.
Vision and Disability
Disability refers to reported difficulties in or an ability to perform activities of daily living (ADL) and instrumental activities of daily living (IADL) due to a health and physical problem.it is considered as a gap between person’s abilities and environmental demands [36]. It is known that visual impairment is one of the leading causes of self-reported functional disability in old age [37, 38]. Poor vision can affect even the most common and simple tasks. Cross sectional studies have shown that visually impaired persons age 55 and above have limitations in eating going to the toilet washing oneself moving about in own apartment dressing getting in and out of bed and in IADL, such as using the phone, cooking, shopping, laundering, banking four to five times more likely than persons with good visual acuity [3]. Objectively measured visual impairment increases the risk for ADL, IADL and mobility limitation three to five fold and the association between self-reported visual loss and functional limitation is quite similar [3]. Moreover, among older people the presence of visual impairment increases the risk of developing further ADL and IADL limitations [39].
Measurement of Disability
The domains of disability, most often measured with regard to the older population are the activities of daily living (ADL) and the instrumental activities of daily living (IADL)
Activities of daily living (ADL)
Possibly the single most important area of personal functioning concerned with self-care capacity is activities of daily living (ADL), because performance in this area is related to mental and physical health that may also determine social well-being [40]. ADL are capabilities to bathe, dress, toilet, transfer (getting in and out of bed), maintain continence and eat. Katz et al [41] developed the original ADL with an observational dichotomous scale to assess the physical capabilities of older persons in clinical settings. These items are hierarchically ordered with the pattern of recovery from a disabling illness in later life similar to the order of the developmental pattern in children.
Instrumental activities of daily living (IADL)
An expanded version of the Katz Index added another set of activities of daily living, termed instrumental activities of daily living (IADL) developed by Lawton and Brody [42], which are more complex than the basic ADL. IADL evaluate a person’s ability to perform more complex personal care activities needed to support independent living, such as the ability to use the telephone, go shopping, prepare meals, do housekeeping, do laundry, use transportation, manage money, and manage medications. The independence criterion is measured by the ability to perform these activities without assistance.
Reliability and validity of ADL and IADL
A harmonized measure of ADL has been found to be a reliable and valid instrument for comparing disability in older population across countries [43]. Cronbach’s alpha for the ADL measure varied from 0.85 in Spain, 0.83 in Sweden, 0.91 in Finland, and 0.91 in Israel. The IADL scale was originally tested among twelve subjects and inter-rater reliability was established at Cronbach’s alpha 0.85 [44].
Material and Methods
A cross-sectional design, utilizing eye exam and questionnaire was employed in this study. In the first step elderly people 60 years and above were asked to participate in the survey. In the second step those who agreed to participate were written informed consent. The survey was conducted in two welfare homes in Serdang and Seremban states of the Malaysia country.
Every registered elderly who live in welfare homes had a recorded document called personal file in the welfare home center (see table 1).
Table 1: The inclusion and exclusion criteria for the subjects
| Inclusion criteria | Exclusion criteria |
| Age 60 years or above | Patient too ill |
| Patient with written informed consent | No written informed consent |
| No dementia or other mental disease | dementia or other mental disease |
According to inclusion and exclusion criteria and using a complete list of identification number for every older people the simple random sampling (using computer) was used to select every subject for this study. We invited and explained for elderly people in coming to this study and fortunately most of them accepted.
The study adopted face to face interview technique for questionnaires to gather data. It has done from the first day of august 2012 through the first day of November 2012. The cronbachs Alpha for ADL questionnaire was (0.782) and for IADL (0.794) in pilot study (see table 2).
Table 2: The reliability of the scales in the pilot study
| Scale | Cronbach’s Alphe | N of item |
| ADL | 0.782 | 6 |
| IADL | 0.794 | 8 |
Independent variable measurement
Socio-demographic characteristics
Age was used as a continuous variable for descriptive purposes. For the analysis, age was categorized into age groups and coded as 1 = 60 – 69 years, 2 = 70-79 years, 3 = 80 years and above. Gender was dichotomous, dummy coded variable and coded as male = 1 and Female = 2 .Ethnicity was defined as Malay, Chinese, Indian and others (Malay= 0, Chinese = 1, Indian=2 and others=3).Income was a continuous variable and thus was recoded as a two categorical variable: 1= RM 1-49, 2= RM 50-99
Health behaviors
A single item that used to assess health behavior statues was smoking. Cigarette smoking statues was categorized at baseline as those who never smoked ,were former smokers or who currently smoked .those who never smoked were identified according to the question “ have you ever smoked at least 100 cigarettes in your entire life?” Those with a history of smoking were asked “do you smoke cigarettes now?” to distinguish former from current smokers.
The two main outcomes of the study were any visual impairment, disability. The assessment in visual impairment was done by Snellen E Chart and the determination of disability status as measured by ADL and IADL difficulties was based on the respondent’s reported difficulties to perform the six activities of daily living and eight instrumental activities of daily living. Quality of life was based on the respondent’s subjective or perceived overall quality of life.
Eye exam test by Snellen E chart
The assessment of visual acuity was performed by means of the Snellen E Chart, a standardized measure for visual analysis [45]. This assessment is widely used because it can be understood by literate and illiterate individuals, and it is easy-to-use and low-cost [46]. The test is performed with the individual seated six meters from the chart, which is fixed to the wall at eye level of the assessed individual. The individual must state the direction that the letter “E” faces (up, down, right or left).
ADL/IADL disability
The six activities of daily living included were bathing, dressing, toileting, transferring, continence and feeding. Instrumental activities of daily living (IADL) tasks are necessary to maintain an independent living in the community. The IADL included eight instrumental activities of daily living and those were ability to use telephone, shopping, food preparation, housekeeping, laundry, transportation, responsibility for own medications and ability to handle finances.
Statistical analysis
Prior to analyzing data, a new data file that integrates the relevant measures was created. Data were analyzed using the Statistical Package for the Social Sciences (SPSS 20, for Windows). Descriptive statistics including mean, standard deviation, frequency, and percentage were used to describe socio demographic characteristic, health behavior status, and self-reported medical condition, the prevalence of visual impairment and disability. For analyses a p value ≤ 0.05 (two-sided) was considered as significant.
Results
Exploratory Data Analysis (EDA)
According to Tabachnick and Fidell [47], a standardized score with a value greater than the critical value of 3.29 is considered as outlier. Results of the outlier assessment revealed no outlier, the normality of distribution for major variables including disability was evaluated through skewness and kurtosis. According to the rule of thumb, a variable is reasonably close to normal if its skewness falls between -1.0 and +1.0, and kurtosis has value between –2.0 and +2.0 (Peat & Barton, 2005). The values of skewness and kurtosis for ADL (Skewness = 0.398, kurtosis = -.979) and IADL (skewness = -.144, kurtosis = -1.108) revealed a reasonable normal distribution for these variables.
Reliability and validity of scales
Two scales were used for disability in this study. The scales related to disability used in the study are activities of daily living (ADL) and instrumental activities of daily living (IADL). The reliability of these scales is shown in Table 3.
Table 3: Reliability of Scales Used in the Study
| Scales | Cronbach’s α | No of Items |
| ADL | 0.731 | 6 |
| IADL | 0.809 | 8 |
Independent variable
Socio-demographic characteristics
The sample consisted of 150 persons living in the two welfare homes in Malaysia, ranging in age from 60 to 92 ages. Table 4 presents the socio-demographic characteristics of the respondents. The mean age of the sample was 69.39 age (S.D. = 7.31). The majority of the respondents were aged between 60 and 69 age (86%), 47.0% were aged between 70 – 79 age, and about17.0% were aged 80 years and over. Respondents comprised the different ethnic groups in Malaysia; Malays (41.3%), Chinese (25.3%), Indians (24%), and Others slightly more than nine percent (9.3%). More than half of the respondents reported a monthly income less than RM49.00 (67.3%).
Table 4: Percentage distribution of socio-demographic characteristics
| Demographic characteristic | N | % |
| Age group | ||
| 60-69 | 86 | 53.7 |
| 70-79 | 47 | 31.3 |
| 80+ | 17 | 11.3 |
| Age (means ± SD) | 69.39 ±7.31 | |
| Gender | ||
| Male | 69 | 46.0 |
| Female | 81 | 54.0 |
| Ethnicity | ||
| Malay | 62 | 41.3 |
| Chinese | 38 | 25.3 |
| Indian | 36 | 24.0 |
| Others income | 14 | 9.3 |
| Less than RM 49 | 101 | 67.3 |
| RM 50- RM 99 | 49 | 32.7 |
| Income (means ± SD) | 32± 47 |
Health behavior
The health behavioral characteristics of the respondents are presented in Table 5. More than half of the respondents were smoked in former (57.3%), current smoker (15.3) and about twenty seven percent (27.3%) never smoked.
Table 5: Percentage distribution of health behavior characteristics
|
Health behavior characteristics Smoking statues |
n | % |
| Never smoked | 41 | 27.3 |
| Former
Current |
86
23 |
57.3
15.3 |
Self-reported medical condition or disease
Table 6 displays the prevalence of medical conditions or disease reported by the respondents. The most common medical conditions or disease were diabetes mellitus (78.7%), hypertension (76.7%), heart disease (76.0%), eye disease (76.0%), and stroke (56.7)
Table 6: Prevalence of self-reported medical condition or disease
| Medical condition | N | % |
| Diabetic | 118 | 78.7 |
| Eye disease | 114 | 76.0 |
| Heart disease | 114 | 76.0 |
| Hypertension | 115 | 76.7 |
| Stroke | 85 | 56.7 |
Prevalence of visual impairment and blindness
Table 7 shows to the prevalence of visual statues reported by the elderly to snellen E chart. The normal vision (6/6- 6/12) among welfare home residents were about 26%, impaired vision (6/18-6/36) reported 46% and blindness (6/60) 28%.
Table 7: the Prevalence of visual impairment among elderly
| Visual acuity group | n | % |
| Normal (6/6 – 6/12) | 39 | 26.0 |
| Impairment (6/18-6/36) | 69 | 46.0 |
| Blind (6/60) | 42 | 28.0 |
Prevalence of ADL/IADL disability
Table 8 gives the percentage distribution of reported difficulties among elderly in performing the activities of daily living (ADL). Difficulties were stated for bathing 59.3%, feeding 55.3%, continence 54.7%, transferring 47.3%, dressing 41.3% and toileting 31.3%. The prevalence of difficulty in performing instrumental activities of daily living (IADL) is shown in Table 9. Difficulties reported in food preparation 88.0%, housekeeping 66.0%, mode of transportation 60.0%, shopping 58.7%, laundry 58.7%, Responsibility for own medications 54.0%, Ability to handle finances 53.3% and Ability to use telephone 33.3%.
Table 8: Percentage of respondents with difficulties in performing activities of daily living (ADL)
| ADL | n | % |
| Bathing | 89 | 59.3 |
| Dressing | 62 | 41.3 |
| Toileting | 56 | 31.3 |
| Transferring | 71 | 47.3 |
| Continence | 82 | 54.7 |
| Feeding | 83 | 55.3 |
Table 9: Percentage of respondents with difficulties in performing instrumental activities of daily living (IADL)
| IADL | n | % |
| Ability to use telephone | 50 | 33.3 |
| Shopping | 88 | 58.7 |
| Food preparation | 102 | 88.0 |
| Housekeeping | 99 | 66.0 |
| Laundry | 88 | 58.7 |
| Mode of transportation | 90 | 60.0 |
| Responsibility for own medications
Ability to handle finances |
81
80 |
54.0
53.3 |
Prevalence of Blindness, Visual Impairment and Adequate Vision by Selected Socio Demographic Characteristics, Health Behavior (Smoking) And Self-Reported Medical Condition (Disease)
In this study reduced visual acuity was significantly associated with increasing age (Table 10). Blindness increased significantly with age from 5.8% in subjects 60-69 years of age and 25.8% in subjects 70-79 years of age to 67.7% in subjects 80 years old or older. Visual impairment also increased with age ranging from 34.6% in subjects 60-69 years of age to more than 71% in subjects 70-79 years of age. Female subjects (54.5%) were somewhat more like to be visually impaired compared to males (47.6%).Also female subjects (36.9%) more like to be were blind in compared to males (15.2). Although Chinese subjects were more like to be visually impaired (73.7%) but Malay subjects were more to be blind (33.9%) compared to other races. additionally lower level socioeconomic was associated to increasing visual impairment (51.9%).
Table 10: Prevalence of blindness, visual impairment and adequate vision by selected socio demographic characteristics
| Normal (6/6-6/12) | Impairment (6/18-6/36) | Blind (6/60) | Total | χ2 | ||||
| N | % | N | % | N | % | N | ||
| Age group | ||||||||
| 60-69 | 31 | 59.6 | 18 | 34.6 | 3 | 5.8 | 52 | 19.27 |
| 70-79 | 2 | 3.0 | 48 | 71.6 | 17 | 25.8 | 67 | |
| 80+ | 0 | 0.0 | 10 | 32.3 | 21 | 67.7 | 31 | |
| Gender | ||||||||
| Male | 20 | 30.3 | 36 | 47.6 | 10 | 15.2 | 66 | 10.44 |
| Female | 13 | 15.5 | 40 | 54.5 | 31 | 36.9 | 84 | |
| Ethnicity | ||||||||
| Malay | 13 | 21.0 | 28 | 45.2 | 21 | 33.9 | 62 | 16/59 |
| Chinese | 2 | 5.3 | 28 | 73.7 | 8 | 21.1 | 38 | |
| Indian | 13 | 36.1 | 14 | 38.9 | 9 | 25.0 | 36 | |
| Other | 5 | 35.7 | 6 | 42.9 | 3 | 21.4 | 14 | |
| Income | ||||||||
| RM 0-RM49 | 22 | 16.8 | 68 | 51.9 | 41 | 31.3 | 131 | 19.00 |
| RM50-RM99 | 11 | 57.9 | 8 | 42.1 | 0 | 0.0 | 19 | |
P<0.05
Smoking statues was correlated with impaired vision although former smokers had a higher prevalence of visual impairment (36%) and blindness (21.3%) compared to current smokers or subjects who never smoked. Also subjects with diabetic, eye disease, heart disease, hypertension and stroke were significantly more likely to be blind or visually impaired (p<0.01) (see table 11).
Table 11: Prevalence of blindness, visual impairment and adequate vision by selected health behavior (smoking) and self-reported medical condition (disease)
| Normal (6/6-6/12) | Impairment (6/18-6/36) | Blind (6/60) | Total | χ2 | ||||
| N | % | N | % | N | % | N | ||
| Smoking | ||||||||
| Former | 0 | 0.0 | 54 | 62.8 | 32 | 37.2 | 86 | 43.32 |
| Current | 0 | 0.0 | 14 | 60.9 | 9 | 39.1 | 23 | |
| Nonsmoker | 33 | 22.0 | 8 | 5.3 | 0 | 0.0 | 41 | |
| Disease | ||||||||
| Diabetic | 16 | 13.6 | 63 | 53.4 | 39 | 33.1 | 118 | 25.33 |
| Eye disease | 12 | 10.5 | 64 | 56.1 | 38 | 33.1 | 114 | 37.48 |
| Heartdisease | 14 | 12.3 | 62 | 54.4 | 38 | 33.3 | 114 | 27.94 |
| hypertension | 19 | 16.5 | 58 | 50.4 | 38 | 33.0 | 115 | 12.60 |
| Stroke | 15 | 17.6 | 47 | 55.3 | 23 | 27.1 | 85 | 12.52 |
P<0.05
Multiple Regressions Table 12 displays the results of the enter method multiple regression analysis utilizing visual impairment as the dependent variable. The variables which entered the regression model were age, gender, ethnicity, income, smoking, diabetic, eye disease, heart disease, hypertension and stroke in relationship.
Table 12: Result of Multiple Regressions to predict visual impairment of elderly people
| Independent variables | B | SE | B | Sig | Tolerance | VIF |
| (Constant) | -71.319 | 9.362 | .000 | |||
| Age | 1.11 | .13 | .51 | .000 | . 65 | 1.53 |
| Gender | 6.28 | 2.05 | .16 | .003 | .87 | 1.14 |
| Ethnicity
Income |
1.84 | .98 | -.04 | .039 | .92 | 1.08 |
| 2.83 | 3.50 | -.05 | .042 | .67 | 1.47 | |
| Smoking | 6.13 | 2.23 | .15 | .007 | .83 | 1.19 |
| Diabetic | 3.98 | 2.83 | .08 | .016 | .68 | 1.46 |
| Eye disease | 6.04 | 2.65 | .13 | .024 | .71 | 1.39 |
| Hypertension | 3.85 | 2.53 | .08 | .013 | .79 | 1.25 |
| Heart disease | 3.39 | 2.66 | .07 | .020 | .70 | 1.41 |
| Stroke | 1.36 | 2.06 | .03 | .050 | .88 | 1.13 |
| Relationship
F(10,140)=24,752 R2=0.64 P≤ 0.05 |
According to the results generated by the SPSS, the coefficient of determination(R-squred) of model was .64.This means that 64% of visual impairment was explained by the independent variables. The independent variables for this study and in regression model are including: age, gender, ethnicity, income, smoking, diabetic, eye disease, heart disease, hypertension and stroke. The finding of regression model showed that there is a significant association between age, gender, ethnicity, income, smoking, diabetic, eye disease, heart disease, hypertension, stroke and visual impairment.Objective twoPearson correlation showed a negative significant correlation between visual impairment on ADL (r= -.64, p≤ .01) and IADL (r= -.62, p ≤ .01). With decreasing vision, disability is increasing in ADL and IADL. Discussion and Conclusion The first specific objective for this study is: to determine the relationships between socio-demographic factors (age, gender, ethnicity and income), health behavior factors (smoking) and diseases (diabetes mellitus, eye diseases, hypertension, heart disease and stroke) and visual impairment among elderly. This finding showed that with increasing age, vision will be decreased. On the whole, the results of this study was consistent with and support current literature [48, 49] which found that visual impairment increased significantly with increasing age. Other finding from the study showed that sex significantly contributed toward visual impairment. Older women reported higher level of visual problems than men. This results in general replication of past findings that older women had lower levels of vision than male counterparts [50, 51], because women are less likely to express a need for sight due to fear of being seen as a burden, and some household heads seem to be more inclined to support surgery for elderly men than elderly women [52].Also ethnicity statues did appear to be an important predictor of visual impairment among elderly. Consistent with previous reports [14, 53], ethnicity has an important role in visual impairment. Another result showed that socioeconomic statues did appear to be another important predictor of visual impairment among elderly people. This finding is consistent with some previous studies which found income to be a significant impact on visual impairment. Other findings from this study showed that smoking significantly contribute in visual impairment. Smoker group reported higher level of visual impairment than nonsmokers [15; 54]. In this study, diabetic, eye disease, heart disease, hypertension and stroke were found to be a predictor of visual impairment in the regression model. Diabetic had significant relationship with visual impairment and most studies have shown that persons with higher level of diabetes are more probably to report visual impairment [14, 26]. The association between eye diseases and visual impairment is another result of regression model. This result is parallel with other studies about eye disease and visual impairment [17, 20]. Also heart disease had a significant association with visual impairment .the relationship between heart disease and visual impairment reported in some studies [27, 28]. Moreover hypertension had a significant association with visual impairment in regression model. Some studies reported that persons with increasing blood pressure are more probably to report visual impairment [31] and finally stroke had a significant association with visual impairment in regression model. The results of some studies confirmed the relationship between stroke and visual impairment [34, 55]. The second specific objective in this study is: to examine the effect of visual impairment on disability (ADL, IADL) among elderly people. With decreasing vision, disability is increasing in ADL and IADL. Most studies have shown people with higher level of visual impairment are more probably to report disability in ADL and IADL [3, 56, 57]. In general older people with impaired vision reported a significantly lower level of activities daily living (ADL)(bathing, dressing, toileting, transporting, continence , feeding) and activities of instrumental activities of daily living (IADL) (use the telephone, go shopping, prepare meals, do housekeeping, do laundry, use transportation, manage money, manage medications).Welfare home residents had more difficulties in bathing (56%) and in food preparation(88%).Visually impaired elderly were more dependent to others for ADL and IADL. Burmedi [58] in 2002 year, reported that elderly people with impaired vision were approximately twice as likely to have difficulty in daily living activities, in comparison to sighted peers [58]. Vision loss has a profound impact on daily functioning and is regarded as an important contributor to disability. Visually impaired persons experience many restrictions in daily life due to vision loss. Vision loss may not only lead todifficulties in performing activities but also to a loss of activities [37] and consequently poses a severe threat to the independence of visually impaired persons [59].In this cross sectional study, predictors of visual impairment in elderly people in Malaysia were examined. 150 older people were selected by simple random sampling in two welfare homes (Cheras in Selongor and Seremban). Instrument used in this study included the eye exam by Snellen E Chart, ADL scale, IADL scale and other questionnaire about socio demographic factors, health behavior and self-reported medical conditions. Data analyses were carried out using SPSS, 20. The mean age was 69.39 age (S.D. = 7.31). Malay respondents were more (41.3%), in compare to Chinese (25.3%), Indians (24%), and Other races (9.3%).Female gender were (54%) more than male (46%). More than half of the respondents reported a monthly income less than RM49.00 (67.3%).it was found that former smoking (54% )and older people with diabetic (78%) were more in compare to other disease in this study. the majority respondents had visual impairment (46%) and blindness (28%) in compare with normal vision (26%).Disability was measured using difficulties in activities of daily living (ADL), bathing, dressing, toileting, transferring, continence and feeding; and instrumental activities of daily living (IADL), ability to use telephone, shopping, food preparation, housekeeping, laundry, transportation and responsibility for own medication among elderly people. Older people had difficulties in bathing (54.3%) in compare to other activities daily living. Also in instrumental activities daily living, welfare home residents had more problem in food preparation (88%).A chi-square test showed that visual impairment increased with age ranging from 34.6% in subjects 60-69 years of age to more than 71% in subjects 70-79 years of age. Female subjects (54.5%) were somewhat more like to be visually impaired compared to males (47.6%). Although Chinese subjects were more like to be visually impaired (73.7%) but Malay subjects were more to be blind (33.9%) compared to other races. additionally lower level socioeconomic was associated to increasing visual impairment (51.9%). analysis of multiple linear regression showed that age, gender, race, income, smoking statues, diabetes, eye disease, heart disease, hypertension and stroke associated to visual impairment. A bivariate test examined the effect of visual impairment on disability. With decreasing visual impairment disability in (ADL) and (IADL) is increasing. The present study found that increasing age, female gender, Chinese race, lower income, smoking statues, diabetes, eye disease, heart disease, hypertension and stroke are associated with decreased visual impairment.
Reference
- World Health Organization the world is aging fast have we noticed? (2006). Accessed on September 17, 2010 at: http//www.who.int/features/qa/42/en/index.ht
- Sloan, F.A., Picone, G., Brown, D., Lee, P.P. longitudinal analysis of the relationship between regular eye examinations and changes in visual and functional status. J Am Geriatr Soc, 2005; 53(11): 1867-1874.
- Laitinen, A., Sainio, P., Koskinen, S., Rudanko, S.L., Laatikainen, L., Arroma, A. The association between visual acuity and functional limitations: findings from a nationally representative population survey. Ophthalmic Epidemiology, 2007; 14(6): 333-342.
- Ong, F. S. Aging in Malaysia: Areview of national policies and programmes. In D. R. Philips & C. M. Chan (Eds), Ageing and long -term care: National policies in the Asia Pacific (pp. 107-149). 2002
- WHO, Fact Sheet N°282, Oct. Visual impairment and blindness. 2011.
- Klein, B.E., Klein, R., Knudtson, M.D. Frailty and age-related cataract. Ophtalmology, 2006; 113(12): 2209-2212.
- Häkkinen, L. vision in the elderly and its use in the social environment. Scand J Soc Med Suppl, 1984; 35: 5-60.
- Tielsch, J. M., Sommer, A., Witt, K., Katz, J., & Royall, R. M. Blindness and visual impairment in an American urban population. The Baltimore eye survey. Archives of Ophthalmology, 1990; 108(2): 286-290.
- Ponte, F., Giuffre, G., and Giammanco, R. prevalence and causes of blindness and low vision in the casteldaccia eye study. Graefes Arch Clin Exp Ophthalmol, 1994; 232(8): 469-472
- Hirvelä, H., and Laatikainen, L. visual acuity in a population aged 70 years or older; prevalence and causes of visual impairment. Acta Ophthalmol Scand, 1995; 73(2): 99-104.
- Taylor, H.R., Livingston, P.M., Stanislavsky, Y.L., McCarty, C.A. Visual impairment in Australia: Distance visual acuity, near vision, and visual field findings of the Melbourne Visual Impairment Project. American Journal Of Ophthalmology, 1997; 123(3): 328-337.
- Cedrone, C., Nucci, C., Scuderi, G., Ricci, F., Cerulli, A., & Culasso, F. prevalence of blindness and low vision in an Italian population: a comparison with other European studies. Eye 2006; 20(6): 661-667.
- Abou-Gareeb I, L. S., Bassett, K., & Courtright, P. Gender and Blindness: A Meta-Analysis of Population-Based Prevalence Surveys. Ophthalmic Epidemiol, 2001; 8(1): 39–56.
- Sivaprasad, S., Gupta, B., Crosby-Nwaobi, R., & Evans, J. Prevalence of diabetic retinopathy in various ethnic groups: a worldwide perspective. Survey of ophthalmology, 2012; 57(4), 347-370.
- Xinzhi Zhang, M., PhD; Jennifer Kahende, PhD; Amy Z. Fan, MD, PhD; Lawrence Barker, PhD; , & Theodore J. Thompson, M. A. H. M., PhD; Yan Li, MD, MPH; Jinan B. Saaddine, MD, M. P.H. Smoking and Visual Impairment among Older Adults with Age-Related Eye Diseases. 2011.
- Suner, I. J., Espinosa-Heidmann, D. G., Marin-Castano, M. E., Hernandez, E. P., Pereira-Simon, S., & Cousins, S. W. Nicotine increases size and severity of experimental choroidal neovascularization. Investigative ophthalmology & visual science, 2004; 45(1), 311-317.
- Binder, S., & Falkner-Radler, C. I. Age-related macular degeneration I: Types and future directions. In Age-Related Changes of the Human Eye(pp. 239-256). Humana Press. 2008.
- Saari KM.2001.Silmatautioppi. Helsinki: K and idaattikustannus Oy.
- Ting, A. Y., Lee, T. K., & MacDonald, I. M. Genetics of age-related macular degeneration. Current opinion in ophthalmology, 2009; 20(5), 369-376.
- Congdon N, O’Colmain B, Klaver CC, Klein R, Muñoz B, Friedman DS, Kempen J, Taylor HR, Mitchell P; Eye Diseases Prevalence Research Group. Causes and prevalence of visual impairment among adults in the United States. Arch Ophthalmol, 2004; 122(4):477-85.
- Abraham, A. G., Condon, N. G., & Gower, E. W. The new epidemiology of cataract. Ophthalmol Clin North Am, 2006; 19(4), 415-425.
- Laitinen, A., Laatikainen, L., Härkänen, T., Koskinen, S., Reunanen, A., & Aromaa, A. Prevalence of major eye diseases and causes of visual impairment in the adult Finnish population: a nationwide population‐based survey. Acta ophthalmologica, 2010; 88(4), 463-471.
- Gupta, D. Glaucoma diagnosis and management. Philadelphia: Lippincott Williams & Wilkins. 2005.
- Ryskulova, A., Turczyn, K., Makuc, D. M., Cotch, M. F., Klein, R. J., & Janiszewski, R. Self-reported age-related eye diseases and visual impairment in the United States: results of the 2002 national health interview survey. American Journal of Public Health, 2008; 98(3), 454.
- Bertelsen, G., Peto, T., Lindekleiv, H., Schirmer, H., Solbu, M. D., Toft, I., et al. Tromsø eye study: prevalence and risk factors of diabetic retinopathy. Acta ophthalmologica, 2013; 91(8), 716-721.
- Hirai, F. E., Tielsch, J. M., Klein, B. E., & Klein, R. Ten-year change in vision-related quality of life in type 1 diabetes: Wisconsin epidemiologic study of diabetic retinopathy. Ophthalmology, 2011; 118(2), 353-358.
- Ophthalmology, A. A. o. Comprehensive adult medical eye evaluation—October 2010. 2011.
- Cugati S, W. J., Knudtson MD, et al. Retinal vein occlusion and vascular mortality: pooled data analysis of 2 population-based cohorts. Ophthalmology, 2007; 114(3), 520-524.
- Borger, P. H., van Leeuwen, R., Hulsman, C. A., Wolfs, R. C., van der Kuip, D. A., Hofman, A., & de Jong, P. T. Is there a direct association between age-related eye diseases and mortality? The Rotterdam Study. Ophthalmology, 2003; 110(7), 1292-1296.
- Thiagarajan, M., Evans, J. R., Smeeth, L., Wormald, R. P., & Fletcher, A. E. Cause-specific visual impairment and mortality: results from a population-based study of older people in the United Kingdom. Archives of ophthalmology, 2005; 123(10), 1397-1403.
- Foster, P. J., Broadway, D. C., Garway-Heath, D. F., Yip, J. L., Luben, R., Hayat, S., et al. Intraocular pressure and corneal biomechanics in an adult British population: the EPIC-Norfolk eye study. Investigative ophthalmology & visual science, 2011; 52(11), 8179-8185.
- Ploubidis, G. B., Mathenge, W., De Stavola, B., Grundy, E., Foster, A., & Kuper, H. Socioeconomic position and later life prevalence of hypertension, diabetes and visual impairment in Nakuru, Kenya. Int J Public Health, 2013; 58(1), 133-141.
- Wong, T. Y., Klein, R., Klein, B. E., Tielsch, J. M., Hubbard, L., & Nieto, F. J. Retinal microvascular abnormalities and their relationship with hypertension, cardiovascular disease, and mortality. Survey of ophthalmology, 2001; 46(1), 59-80.
- MacIntosh, C. Review articles-Stroke re-visited: Visual problems following stroke and their effect on rehabilitation. Br Orthopt J, 2003; (60): 10-14.
- Allen, C. M. C., Harrison, M. J., & Wade, D. T. The management of acute stroke. Johns Hopkins University Press. 1988.
- Verbrugge, L.M., & Jette, A. M. The disablement process. Social Science & Medicine, 1994; 38 (1), 1-14.
- Rovner, B.W., & Ganguli, M. Depression and disability associated with impaired vision: the movies project. J Am Geriatr Soc, 1998; 46(5): 617-619.
- Reuben, D.B., Mui, S., Damesyn, M., Moore, A.A., & Greendale, G.A. the prognostic value of sensory impairment in older persons. J Am Geriatr Soc 1999; 47(8): 930-935.
- Dunlop, D.D., Manheim, L.M., Sohn, M.W., Liu, X., & Chang R.W. Incidence of functional limitation in older adults: the impact of gender, race, and chronic conditions. Arch Phys Med Rehabil, 2002; 83(7): 964-971.
- Fillenbaum, G. The well-being of the elderly: Approaches to multidimensional assessment. WHO Offset Publication No. 84. Geneva: World Health Organization.1984.
- Katz, S., Ford, A. B., Moskowitz, R. W., Jackson, B. A., & Jaffe, M. W. Studies of illness in the aged: the index of ADL: a standardized measure of biological and psychosocial function. Journal of American Medical Association, 1963; 185(12): 914-919.
- Lawton, M. P., & Brody, E. M. Assessment of older people: Self-maintaining and instrumental activities of daily living. The Gerontologist, 1969; 9 (3): 179 – 186.
- Pluijm, S.M.F., Bardage, C., Nikula, S., Blumstein, T., Jylhä, M., Minicuci, N., et al. A harmonized measure of activities of daily living was a reliable and valid instrument for comparing disability in older people across countries. Journal of Clinical Epidemiology, 2005; 58(10): 1015-1023
- Graf, C. The Lawton Instrumental Activities of Daily Living (IADL) Scale. Retrieved September 4, 2008, from http://wwwGeroNurseOnline.org.
- Henson, D. B. Optometric instrumentation. London: Butterworths. 1983.
- Lee HK, S. R. Comparison of balance in older people with and without visual impairment. Age Ageing, 2003; 32(6), 643-649.
- Tabachnick, B. G. F., L. S. Using Multivariate Statistics (4th Ed.). Boston: MA. Allyn & Bacon.2001.
- Broman, A. T., Munoz, B., Rodriguez, J., et al. The impact of visual impairment and eye disease on vision-related quality of life in a Mexican American population: Proyecto VER. Investi-gative Ophthalmology & Visual Science, 2002; 43(11), 3393–3398.
- Sjöstrand, J., Laatikainen, L., Hirvela, H., Popovic, Z., & Jonsson, R. The decline in visual acuity in elderly people with healthy eyes or eyes with early age-related maculopathy in two Scandinavian population samples. Acta Ophthalmol, 2011; 89(2): 116-123.
- Kyari, F., Gudlavalleti, M. V., Sivsubramaniam, S., Gilbert, C. E., Abdull, M. M., Entekume, G., & Foster, A. Prevalence of blindness and visual impairment in Nigeria: The national blindness and visual impairment survey. Investigative ophthalmology & visual science, 2009; 50(5), 2033-2039.
- Herrieth Mganga, S. L., & Paul Courtright. Overcoming Gender Inequity in Journal of Advanced Nursing Prevention of Blindness and Visual Impairment in Africa. Middle East Afr J Ophthalmol, 2011; 18(2): 98–101.
- Geneau R, L. S., Bronsard A, Paul I, & Courtright P. The social and family dynamics behind the uptake of cataract surgery: Findings from Kilimanjaro Region, Tanzania. Br J Ophthalmol, 2005; 89(11): 1399–1402.
- Varma, R., Chung, J., Foong, A. W., Torres, M., Choudhury, F., Azen, S. P., & Los Angeles Latino Eye Study Group. Four-year incidence and progression of visual impairment in Latinos: the Los Angeles Latino Eye Study. American journal of ophthalmology, 2010; 149(5): 713-727.
- Tan JS, W. J., Younan C, Cumming RG, Rochtchina, & E, M. P. Smoking and the long-term incidence of cataract: the Blue Mountains Eye Study. Ophthalmic Epidemiol, 2008; 15(3): 155-161.
- Simon, J.E, M. S., Pexman J.H.W., & Buchan, A.M. CT assess-ment of conjugate eye deviation in acute stroke. Neurology, 2003; 60(1): 135–137.
- Haymes, S. A., Johnston, A. W., & Heyes, A. D. Relationship between vision impairment and ability to perform activities of daily living. Ophthalmic and Physiological Optics, 2002; 22(2): 79-91.
- Swanson, M., & McGwin, G. Visual impairment and functional status from the 1995 National Health Interview Survey on Disability. Ophthalmic epidemiology, 2004; 11(3): 227-239.
- Burmedi, D., Becker, S., Heyl, V., Wahl, H. W., & Himmelsbach, I. Behavioral consequences of age-related low vision. Visual Impairment Research, 2002; 4(1): 15-45.
- Wang, J. J., Mitchell, P., Simpson, J. M., dimming, R.G., & Smith, W. Visual impairment, age related cataract, and mortality. Archives of Ophthalmology, 2001; 119(8): 1186-1190.

