
Manuscript accepted on :
Published online on: 12-01-2016
Plagiarism Check: Yes
Alexey ValerievichIlyin, Arkadiy Pavlovich Kuleshov, Anastasia Valerievna Poteryakhina and Alexey Petrovich Zaretsky
Moscow Institute of Physics and Technology (State University) 9, Institutskiy per., Dolgoprudny, Moscow Region, 141700, Russian Federation Department of Radio Engineering and Cybernetics
DOI : https://dx.doi.org/10.13005/bpj/806
Abstract
Algorithm of ST-interval selection of electrocardiographic signal was developeed that allows for dynamic evaluation of the heart performance and identifies critical states for the detection of coronary artery disease and preinfarction condition. R-wave is calculated in examinations according to the algorithm without setting fixed numerical thresholds, as well as use of rate increase and decrease of the amplitude conditioning. Algorithm is implemented with the software environment LabView. Simultaneously, identification of the isoline Z is performed and with its help determining S and T points.
Keywords
algorithms for medical signal processing; selection of R-wave; ST-interval estimation; allocation of isoline; coronary heart disease; myocardial infarction; daily monitoring; evaluation of critical states
Download this article as:| Copy the following to cite this article: Ilyin A. V, Kuleshov A. P, Poteryakhina A. V, Poteryakhina A. V. Algorithm of ST-Interval Selection at Daily Monitoring to Assess Coronary Heart Disease and Preinfarction Condition. Biomed Pharmacol J 2015;8(2) |
| Copy the following to cite this URL: Ilyin A. V, Kuleshov A. P, Poteryakhina A. V, Poteryakhina A. V. Algorithm of ST-Interval Selection at Daily Monitoring to Assess Coronary Heart Disease and Preinfarction Condition. Biomed Pharmacol J 2015;8(2). Available from: http://biomedpharmajournal.org/?p=3914 |
Introduction
Today, as before, the problems of the cardiovascular system take the top spot in the list of causes of death. Ischemic diseases play a special role. It is worth mentioning, that the coronary vessels lesion can lead to myocardial infarction, and coronary heart disease (CHD) is a leading cause of sudden cardiac death, which is usually caused by coronary atherosclerosis. Due to a lot of factors, the vessel walls in atherosclerosis are filled with lipids, which cause atherosclerotic changes reducing the vascular lumen, thereby reducing nutrition of the myocardium. Moreover, arterial atherosclerosis induces such pathological processes as spasm, diastolic dysfunction, and formation of blood clots. The second cause of CHD is hypertension, which is continuing to extent in the last decades.
Constriction of the coronary vessels leads to thoracic and retrosternal pain. In the early stages, the pain occurs only during intense physical activity, but at development of the pathogenesis the pain is felt at rest, however, pathological changes should be identified at the earliest stages to increase the effectiveness of subsequent treatment. At constriction of the coronary bed lumen, processes associated with tissue necrosis develop in myocardium, resulting in myocardial infarction. When the coronary arteries lumen is preserved, angina occurs due to myocardial hypoxia.
Statistics
Analysis of the data, which are sent by the researchers from the University of Lausanne to the World Health Organization since 1972, describing the statistics of heart disease in 34 countries, showed that Russia has the highest mortality rate. Performed analysis of statistical data on Russia demonstrated that from myocardial infarction annually die about 500 people out of 100 thousand, and from stroke – 350 people. Among the total mortality rate in Russia, mortality from cardiovascular disease makes 57%. Annually in Russia 1.3 million people die from cardiovascular diseases [1], while most of the causes of deaths include coronary heart disease and hypertension [2, 3, 4].
Diagnostics
Assessment of patient’s complaints in terms of character and localization of pain, its frequency, conditions of development is considered when detecting the coronary heart disease. After the initial examination, electrocardiography, stress tests, pharmacological tests, ultrasound, selective coronary angiography, myocardial scintigraphy, computed tomography (to exclude cardiac anomalies and aneurysms), determination of serum cholesterol and lipoprotein are conducted. It should be noted that in some cases of myocardial ischemia can often be asymptomatic. During continuous ambulatory ECG monitoring (ECG monitoring by Holter) in most patients with the typical chronic stable angina with the appearance of chest pain occurring during daily physical activity, revealed objective evidence of myocardial ischemia (ST-segment displacement). It should be noted that the signs of myocardial ischemia in patients are identified as frequently in the absence of angina attack, but there is a sample of patients with severe atherosclerotic changes in coronary arteries, in which ST segment displacement in daily physical activity always occurs asymptomatically. By using stress tests, identification of pathologies is possible in patients with asymptomatic forms of diseases characterized by pathological changes of the coronary arteries. Statistical data analysis showed that in patients with asymptomatic myocardial ischemia during exercise increases the risk of cardiovascular complications (sudden death, myocardial infarction, angina emergence). In addition, patients, in which disease continues to be asymptomatic after myocardial infarction, have a higher risk of recurrent coronary complications compared with the general population. Patients with asymptomatic ischemia should be carefully examined with the help of non-invasive techniques, including stress tests with registration of ECG and radionuclide scintigraphy. Treatment of patients with asymptomatic ischemia should be conducted individually. At the same time, doctor must pay attention to the following moments: 1) severity of the changes during exercise, the load stage at which occurrence of ECG signs of myocardial ischemia is observed [2, 14, 15]; 2) what ECG leads reveal signs of ischemia, given that changes in the anterior precordial leads prognostically are less favorable than changes in the inferior leads; 3) the age of the patient and his profession. Of course, in relatively healthy subjects, who has painless ST-segment depression registered during exercise in leads V1-V4 on a 4mm, coronary angiography is indicated, while in the elderly examinee over 60 years, leading a sedentary lifestyle, who has at maximum physical load ST-segment depression of 1 mm in leads II and III, there is no need for coronary angiography. However, the majority of patients, in contrast to the extreme cases described above, it is difficult to decide on the appropriateness of coronary angiography. In patients, who have revealed signs of severe myocardial ischemia at noninvasive studies, coronary angiography should be performed, and then, depending on its results, the appropriateness of revascularization should be considered. For example, patients with asymptomatic coronary artery disease, who have coronary lesions in the three major coronary arteries and left ventricular dysfunction, and patients with asymptomatic coronary heart disease and lesion in the main trunk of the left coronary artery should be considered suitable candidates for percutaneous transluminal coronary angioplasty (PTCA). Despite the fact that application of adrenoblockers and calcium antagonists reduces the frequency of asymptomatic myocardial ischemia occurrence, it is still uncertain whether these drugs should be assigned to patients without myocardial infarction. However, it is known that treatment with adrenoblockers initiated from the 7th day and till the 35th day after acute myocardial infarction significantly improves patients’ life expectancy. In such patients with asymptomatic coronary artery disease it is recommended to prescribe prolonged treatment with adrenoblockers, as long as there is no contraindication to it, such as heart failure, bradycardia, heart block, bronchial asthma. Moreover, it should be noted that constant daily monitoring of heart rate variability is required during the drug therapy.
Daily Monitoring
Holter ECG monitoring involves ECG recording performed throughout the day and identification of periodically appearing violations in the electrophysiology of the heart. Portable device (Holter monitor) is used for examination, and the diary of introspection, in which the patient hourly notes actions and the changes in health. Obtained during the monitoring data is processed on a computer. ECG monitoring allows us not only to identify manifestations of coronary heart disease, but also the causes and conditions of their origin, which is especially important in the diagnosis of angina. Therefore, it is necessary to carry out daily monitoring of ECG, which allows to:
- assess the heart rhythm and disturbances during sleep and wakefulness [10];
- reveal ischemic changes (violations of myocardial trophicity) [11,12,13];
- assess exercise tolerance [6, 14, 15, 16];
- compare changes in the electrocardiogram with patient’s sensations;
- determine indicators that reflect the likelihood of life-threatening arrhythmias.
Carrying out a monitoring with ECG stress tests specify the reaction of the cardiovascular system to exercise. Electrocardiogram is continuously recorded in patient before, during and after exercises, blood pressure is measured periodically.
Analysis of the modern means of recording and processing of ECS under conditions of free motor activity
Diagnostic devices and systems have different functional properties. According to the type of the research, for which modern devices are designed, they can be classified as follows:
- for professional medical and scientific research, such as Poly Spectrum Radio,
- sports medicine and consumer sector.
The main disadvantage of diagnostic devices for standard users includes low accuracy of registration and evaluation of electrocardiosignal (ECS). When using devices under conditions of free motor activity, it is recommended to conduct a continuous signal recording, similar to the implementation of devices for Holter monitoring. Large volume of data leads to the minimization of error in the analysis of the ECG. Using a single-channel 30-second ECG (AliveCor Device) assessment of the cardiorespiratory system is difficult.
Analysis of the market of medical devices for consumer purposes has shown that currently the most available product for a wide use is eMotionECG system produced by the Finnish company Mega Electronics [5]. This system is able of diagnostics in real time under conditions of free motor activity of patient, however, considering the cost of the basic version and expensive support, it is possible to conclude that such a device would have a limited distribution in the Russian market.
Professional devices for monitoring and control of the cardiovascular system such as “Astrokard – telemetry 3G” are designed primarily for the medical staff use and ambulance conditions that impede access to quality monitoring and research. Currently, there are no completely autonomous systems and devices for recording signs of morphological change of ST-segment and ST-interval in real time under conditions of free motion activity. In addition, daily monitoring gives a lot of false results.
Professional devices for monitoring and control of the cardiovascular system such as “Astrokard – telemetry 3G” are designed primarily for the medical staff use and ambulance conditions that impede access to quality monitoring and research. Analysis of the currently available devices in the medical market have shown that there are no completely autonomous systems and devices for recording signs of SCD in real time under conditions of free motion activity.
Monitoring Conduction
Daily monitoring was tested on ADS1298ECG board of Texas Instruments [6]. Data were recorded with 10 electrodes that provided 12-channel diversion. Data from microcontroller in blocks were sent to the PC, where the calculation was made using LabView Software [7,8,9].
To obtain the signal electrodes are fixed by the standard method. Before fixation of electrodes on the examinee antiseptic treatment of the skin was performed, as well as application of the gel for better contact with the skin of the recording area (because of the abundant hair of the subject, who was an employee of the laboratory).
The recorded signal contains pronounced high frequency interference, while the results of spectral analysis reveal the presence of high-amplitude interference with a frequency of 50 Hz. It should be noted that low-frequency interference does not apparently affect the signal. It is important to emphasize that the signal spectrum contains network of 50 Hz, 100 Hz, 150 Hz interferences to be deleted from the signal. To realize the abovementioned goals the low pass filters (LPF) of the 5th generation with a cutoff frequency of 120 Hz, and band-stop filter (BSF) of the second generation are designed, to suppress the network interference of 50 Hz. Designed filters are implemented on the input paths of the board. The LabView programming environment has dealt primarily with precordial leads, in particular, V2, V3 and V4.
Algorithm of ECG analysis to identify crucial points
The algorithm for selection of ST-interval is suggested, which allows to assess the predisposition or the presence of coronary artery disease. Daily monitoring reveals symptomatic abnormalities at various time points, with variable changes, therefore thirty second ECG examination the is not informative enough. Algorithm includes ECG recording under conditions of free motor activity and appropriate signal processing by the microcontroller. Microcontroller involved in pre-treatment described above. Main manipulation of signal occur in the LabVeiw Software.
Structurally, the algorithm consists of several blocks:
- Procedure of isoline selection and location of points of its intersection with the graphic signal;
- Procedure for finding the maximum value of the amplitude and slew rate and amplitude decay;
- Procedure of R-wave, and S and Q points selection;
- Isolation of T-wave;
- Calculation of the ST and R-wave length;
- Controlling the R-wave length.
Let us analyze the performance of each block separately. Block No. 1 provides allocation of the isoline using the new method, characterized by the possibility of dynamic processing compared to the standard location of the average value of the ECG signal amplitude [19,20]. In addition, existing methods are oriented to establish thresholds for the interpretation of the relevant artifact, taking into account the value of the amplitude of the isoline. In contrast to the analogues, presented in the article method of isolines signal allocation allows dynamic processing. Purpose of isoline location is in determining points of intersection with the main signal. To determine the isoline, a band-pass filter with a given set of frequencies of supression and slice is used (Figure 1). ECG file with the filtered signal is transmitted to a PC using a microcontroller, is processed in the LabView Software Environment; reception of test cycle of sampling frequency, selection and calculation of the maximum amplitude of the isoline Z starts automatically. Calculation of the maximum amplitude is performed for the area of 30 seconds, while duration of the ECG recording is 10 minutes or more, including registration of the sample value and assign MAX variable in finding to the amplitude of the next sample if it is greater than the current.
Isoline detection block (Filter Bandpass) is used to compare the values of the isoline with the original signal to find the intersections. Difficulty of the algorithm is in the fact that there might be no obvious intersection point, i.e. it may be between samples. For this reason, additional conditions of above and below the main signal amplitude with respect to isoline of 2 samples should be followed. Values of the intersections are recorded in an array n. Figure 2 visually demonstrates performance of this procedure, which ends at the initial conditions. Upon completion of the cycle of passage for each value of the file at the procerdure output values of the points of intersection with the isoline signal and the maximum value for the first 30 seconds are recorded.
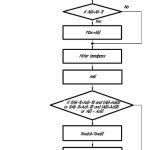 |
Figure 1: Flowchart of procedure No. 1 |
Figure 2 visually demonstrate the performacnce of procedure No. 1 using as example several cardiac cycles. It should be noted that electrocardiosignal (ECS) is filtered by band-stop filter, after which there is an allocation of further processed isoline scheme (shown in yellow). Points of intersection with the signal isoline visualized in red. Sampling frequency in this case is 125 Hz. It should be noted that the values of isoline are unstable and vary harmonically. The intersection occurs only in the beginning and end points of P, R and T-waves. Another feature of the intersection points, characteristic of the algorithm can be seen in the R-wave. Because of the high rate of increase and decline of the amplitude points of intersection of the true values are displaced. A more accurate calculation involves the use of a greater sampling rate to increase the number of samples. At the 4 second interval allocated the maximum amplitude of the signal shown in the graph by a gray line.
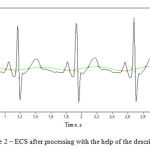 |
Figure 2: ECS after processing with the help of the described algorithm |
When performing procedures of the block No. 2 (Figure 3) the maximum value of amplitude increase and decline rate are calculated. Maximum values in the present study reflect the information on rate of increase of the amplitude (MAH1, MAH2) and of the amplitude itself (MAX).
Of course, you cannot reliably say that the isolated peak is the R-wave (in some cases, this condition corresponds to the T-wave), but this observation is not critical to the optimal algorithm. A distinctive feature of the R-wave is that at any lead the rate of increase and decline of its amplitude are greater in comparison with the rest of ECS. Since the rate of increase is defined as the difference between the amplitudes of two adjacent samples, associated with the time difference, it is impossible to determine the exact rate of increase of the R-wave amplitude. The value of rate of increase will depend on the sampling frequency. From a practical standpoint the rate of increase of R-wave as compared with the others differs greatly. For use of the described conditions for 30 seconds the rate of increase and decline is determined, for which the thresholds for R-wave detection will be given with respect to in the subsequent blocks of the algorithm. Registered rate values are analyzed by time intervals obtained from the array n of intersection points. Application of conditions for the maximal peak is used in the formula for determining the rate of increase (1):
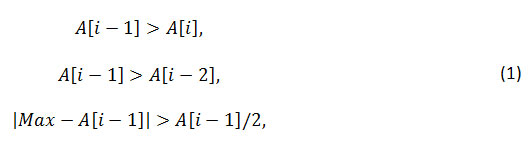
Time locations of the found maximal values peaks were analyzed to identify the inclusion in the time interval of two adjacent intersection points of the array n (2):
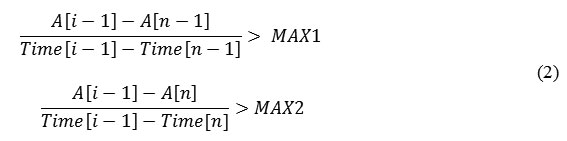
When the peak is within the interval n – (n+1), calculation of the rate of the amplitude increase is made. The result is calculated as the difference between the amplitude of the peak and the point n, ascribed to the difference in their times. Rate of decline is calculated as module of difference between the peak amplitude and the point n+1, ascribed to the difference of their times [17,18]. When values exceeding the previous maximum are found, they are assigned as corresponding maximal values. Performance of this procedure provides recording of the array of rate
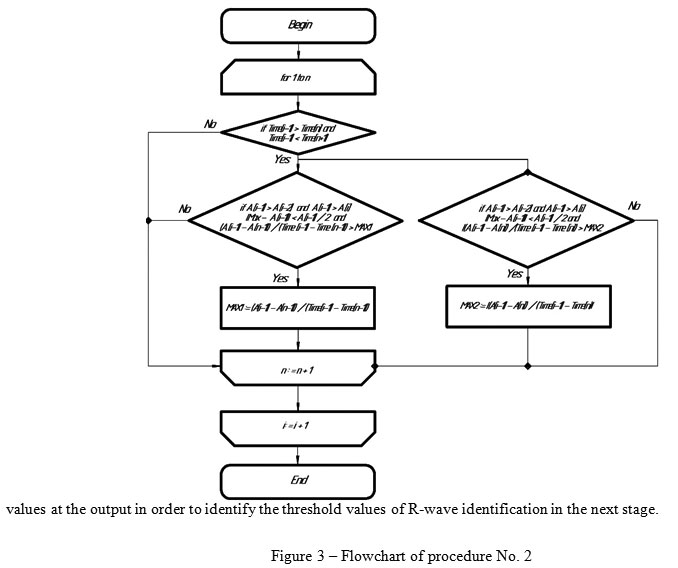 |
Figure 3: Flowchart of procedure No. 2 |
Procedure No. 3 (Figure 4) describes position of the R-wave and allocation of the other waves (P and Т). Operating principle is based on performing the algorithm of procedure No. 2 and differs by the detection of R-wave registration threshold. Algorithm is based on the allocation of the threshold of the rate of increase and decline of the amplitude of the maximum value of 0.7. Additionally, other components of the ECG are detected by the condition (2).
Implementation of conditions for finding R-wave is characterized by a record in the data array of temporal localization of R, and the points n and (n+1) are recorded as Q and S. Implementation of the additional condition is predisposed by the record in the data array on the other waves location (their classification does not occur at the current stage). Output data of the R-wave are recorded in array g, whereas the information about the remaining waves, which were found in the array is recorded in an array y.
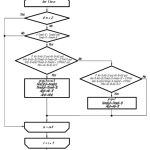 |
Figure 4: Flowchart of procedure No. 3 |
Output data on the found R-wave is used to calculate the RR-interval and heart rate (Figure 5). RR-intervals are accordingly calculated by subtracting the time localization of two adjacent R-waves from the array g.=
 |
Figure 5: Flowchart of RR-interval search and calculation of heart rate in 3 cycles |
The next cycle begins its work in the presence of a sufficient number of RR-intervals. Heart rate is calculated in three intervals. For this purpose, the counter J is turned on. If the value of the counter is three, MK arithmetically calculates the average value of the RR-interval. After that, the data of the counter is reset and the following data packet is expected. In the course of the described block work, the cyclic obtaining of the information on heart rate is performed, on the basis of which it is possible to analyze the heart rate variability.
Procedure No. 4 continues the work of the previous block (Figure 6). Data obtained on waves not included in the array of R waves are tested for the condition (3):
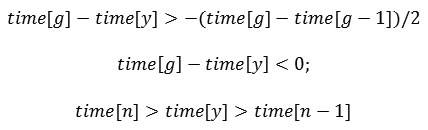
where g – array of R-waves, n – array of other waves, (time [g] – time [g-1]) / 2 – half of the current RR-interval.
It should be noted that in case of temporal localization of the wave to the right (before) of the current R-wave at a distance of less than half of the RR-interval, it is interpreted as P wave. At the described condition with localization to the left (after) of the searched position, it is interpreted as Т wave. It should be noted that data on the beginning and end of the wave is already calculated in earlier blocks. Data on starting time of T-wave is recorded in the array X. As a result of all these algorithms, all data are obtained to determine the duration of the ST-interval (see Figure 6).
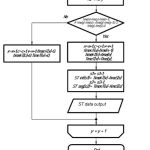 |
Figure 6: Flowchart of algorithm of ST-interval length detection |
Figures 7 and 8 demonstrate ECS under normal sinus rhythm without following the procedure of finding pathology of ST-segment and ST-interval. Points S, beginning and end of the T-wave are marked by a vertical line (Figure 7, 8). All other calculated intervals are not visualized to provide better visibility. Data on ST in the area of 4 seconds are displayed in the right window in the form of a table.
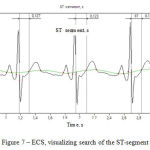 |
Figure 7: ECS, visualizing search of the ST-segment |
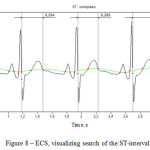 |
Figure 8: ECS, visualizing search of the ST-interval |
Frequency range of the band-stop filter for isoline
Selecting the frequency has some limitations when choosing:
- The frequency band should not exceed the value of the least low-frequency of the main components. This means that the frequency of more than 5 Hz not being used.
- Practical researches have shown that the frequency range of band-stop filter (BSF) should not exceed 1 Hz.
The most acceptable range of the BSF frequencies of 1 to 1.5 Hz was obtained empirically.
Approbation of the algorithm
The abovementioned blocks of the allocation algorithm for ST- segment and ST-interval at daily monitoring are implemented in the LabView Software. Screenshot of the visually informative part is shown in Figure 9. The signal obtained by the wi-fi channel, is filtered, then the program receives already prepared for processing signal. Since recorded data contains 12 leads, the processing in the main lead was used as the fourth precordial lead (V4). Calculation of the R-wave is visualized by the vertical line passing through the peak. Calculated parameters of ST-interval are shown in the upper right corner. Presented ECS fragment demonstrates normal sinus rhythm without arrhythmias and distinct pathologies.
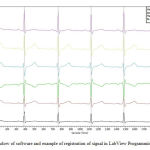 |
Figure 9: Window of software and example of registration of signal in LabView Programming Environment |
Sampling frequency in this study was 500 Hz, accordingly processing of the large number of samples negatively influenced the duration of time of the power supply circuit. Data of the accelerometer are not visualized in the software, as are requested in case of a critical state. When registering deviation, visualization of the conventional area of interest appears in the red line.
Analysis of performance of the main components of ECS search algorithm showed a small percentage of false-positive and false-negative results (3.2±1.6 and 4.3±1.3, respectively, figure 10). It should be noted that registering errors can occur at leading the mains interference of high amplitude and frequency, because of the influence of artifacts or the wrong choice of parameters of isolines allocation.
The algorithm was tested on signals received from a mobile device, the main element of which is MK ADS1298ECG produced by the company Texas Instruments (Table 1), as well as signals from the database of Physionet.org (Table 2). Results of the data analysis of thirty signals (30 signals received via developing mobile device and 30 signals received from the database Physionet.org), were averaged and compared to the actual average values of the amplitude in mV. Registration of signals was performed at rest.
Table 1: Comparative results of application of software on the ECS with a normal sinus rhythm
| Normal signals obtained from ten healthy volunteers | Calculated mean value of ST-segment, ms
|
Actual average value of ST-segment, ms | Delta of the ST-segment, % | Calculated mean value of ST-interval, ms | Actual average value of ST-interval, ms | Delta of the ST-interval, % |
| Average heart rate of signals 66 beats per minute | 120 | 115 | 4,1 | 300 | 320 | 6,25 |
Table 2: Comparative results of software application on ECS in patients with coronary artery disease, taken from the base Physionet.org
| Normal signal obtained from the database Physionet.ru
Lead V2 |
Calculated mean value of ST-segment, ms
|
Actual average value of ST-segment, ms | Delta of the ST-segment, % | Calculated mean value of ST-interval, ms | Actual average value of ST-interval, ms | Delta of the ST-interval, % |
| Average heart rate of signals 60 beats per minute | 240 | 247 | 2,8 | 365 | 357 | 1,9 |
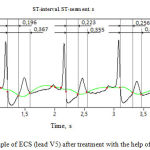 |
Figure 10: Example of ECS (lead V5) after treatment with the help of the developed algorithm |
Interpretation of the data should take into account the statistics of previous studies for the different ranges of heart rate, for example, sources [9, 10, 12, 13]. It should be noted that to obtain more diagnostically relevant information one should assess not only the length of ST-segment and ST-interval, but also the relationship between them. Research data are not sufficient to display the patterns. Subjective assessment for the state of rest (heart rate = 60±8.9) in patients without CHD ratio of ST to ST interval of less than 1/2, and in CHD is more than 2/3.
Conclusions
An analysis of current data allows to conclude that the registration and processing of ECS in a free motor activity has certain characteristics, due to an increased level of interference and artifacts of signal, instability of electrodes fixation and a number of other factors. Diagnosis of coronary artery disease is particularly important and effective under conditions of free motor activity when the examinee may not yet feel the acute symptoms of the disease and maintain normal or even increased physical activity. However, existing portable systems for recording and analyzing ECS in free motor activity do not allow determining the signs of coronary artery disease.
This paper proposes an algorithm for estimating ST-segment and ST-interval on ECG, which contain information about coronary artery disease in patient. The study shows an example of obtaining the ECG signal, visualized in the LabVeiw Software. Investigations on 2 signal groups: normal and pathological, were conducted. The main feature is the insufficient database of recorded signals, but using the current database search algorithm of R-wave, and points S and T-wave parameters is realized with an error of the second kind which is not more than 7%. Further improvement of the algorithm can occur in allocation of other ECG parameters, taking into account the nature of the pathology.
In conclusion, it is worth mentioning that the daily monitoring of ECG is one of few ways to obtain maximal information on the state of electrophysiological parameters of cardiac performance. This condition should improve the quality of recording and processing of information received from portable devices. Improvement of processing algorithms is one of the main priorities of the chosen direction.
Gratitude
This study was supported by grant of the Ministry of Education of the Russian Federation unique project id. RFMEFI57814X0052.
References
- Bokeria L. A. (2010).Modern non-invasive diagnostic tool in cardiac surgery: a rational approach – a brief way to diagnosis. Federal guide. Reducing mortality caused by socially significant diseases. Annals of arrhythmology. Moscow, Russian Federation.
- Gilliam, F.R. (2011). Real world evaluation of dual-zone ICD and CRT-D programming compared to single-zone programming: the ALTITUDE REDUCES study. J. Cardiovasc. Electrophysiol. 22(9), 1023-1029. DOI:10.3791/3750
- European Resuscitation Council Guidelines for Resuscitation 2010 (2010, #80, 1219–1276) Retrieved July 27, 2015 from www.elsevier.com/locate/resuscitation
- Klug D. et al. (2014). Risk factors related to infections of implanted pacemakers and cardioverter-defibrillators: Results of a large prospective study. J. Cardiovasc. Electrophysiol. 25(7). 763-770. DOI: 10.1111/jce.12716.
- Heart-vascular prevention. National recommendations, 2011. Heart-vascular therapy and prevention. Retrieved July 27, 2015 from scardio.ru
- Yu C.M., Wang L., Chau E. et al. (2005). Intrathoracic impedance monitoring in patients with heart failure: correlation with fluid status and feasibility of early warning preceding hospitalization. Circulation, 2005, 112, 841-848. DOI: 10.1161/109.192199
- ADS1298ECG-FE/ADS1198ECG-FE ECG Front-End Performance Demonstration Kit – User’s Guide (2015, July 2007). Retrieved July 27, 2015 from http://www.ti.com/lit/ug/sbau171c/sbau171c.pdf
- Danchin N., Marzilli M., Parkhomenko A., Pibeiro J.P. (2011). Efficacy comparison of trimetazidin with therapeutic alternatives instable angine pectoris: A network Meta-Analysis. Cardiology. 120, 59—72. DOI: 10.1159/000332369
- European Guidelines on cardiovascular diseases prevention in clinical practice. The Task Force for the management of the European Society of Cardiology (ESC) and Other Societies on Cardiovascular diseases (2012, 38, 1635—1701). Retrieved July 27, 2015 from http://eurheartj.oxfordjournals.org/content/ehj/33/13/1635.full.pdf
- Luov S.Yu., Muyakshin S.I., Sharkov V.V. LabVeiw I examples and tasks // Educational materials for the training program “Education Technology of National Instruments». Nizhniy Novgorod, 2007.
- Fadin V. S. (2011).Algorithms of QRS-complex differentiation in ECG // Retrieved July 27, 2015 from http://ilab. xmedtest.net/?q=node/126 (Date of reference: 03.12.2011).
- Bogachev M., Mamontov O., Konradi A., Uljanitski Y., Kantelhardt J., Schlyakhto E. (2009).Analysis of blood pressure–heart rate feedback regulation under non-stationary conditions: beyond baroreflex sensitivity. Physiol. Meas. 30, 631–645. DOI:10.1088/0967-3334/30/7/008
- Bogachev M. I., Bunde A. (2009). On the occurrence and predictability of overloads in telecommunication networks. Europhys. Let. 86, 66002 (1–6). DOI: 10.1209/0295-5075/86/66002
- Penzel T., Kantelhardt J.W., Grote L. et al. (2009). Comparison of detrended fluctuation analysis and spectral analysis for heart rate variability in sleep and sleep apnea (pp. 1143-1156). IEEE Trans. Biomed. Eng.
- Schmitt D. Т., Ivanov P. Ch. (2007). Fractal scale-invariant and nonlinear properties of cardiac dynamics remain stable with advanced age: a new mechanism picture of cardiac control in healthy elderly. Am. J. Physiol. Regul. Integr. Comp. Physiol. 293, 1923. DOI: 10.1152/ajpregu.00372.2007
- Ashkenazy Y., Lewkowicz M., Levitan J. et al. (2001). Scale specific and scale independent measures of heart rate variability as risk indicators. Europhys. Lett. 53, 709-721. DOI: 10.1209/epl/i2001-00208-x
- Monteleone P., Martiadis V., Maj M. (2011). Circadian rhythms and treatment implications in depression. Progress in Neuro-Psychopharmacology and Biological Psychiatry. 35(7), 1569–1574. DOI: 10.1016/j.pnpbp.2010.07.028.
- Katinas G.S., Dementyev M.V., Halberg F., Grambsch P., Sorokin A.V., Cornelissen G. (2011). Evaluating the form of nonsinusoidal variations. World Heart Journal. 3(2), 135-149.
- Bartsch R., Kantelhardt J., Penzel T., Havlin S. Experimental Evidence for Phase Synchronization Transitions in the Human Cardiorespiratory System. Phys. Rev. Lett. 98, 054102. DOI:10.1103/PhysRevLett.98.054102
- Koudryavtcev S.A., Lazarev V.M. Validation of the BPLab 24-hour blood pressure monitoring system according to the European standard BS EN1060-4:2004 and British Hypertension Society Protocol (2011). Medical Devices: Evidence and Research. 4, 193-196. DOI: http://dx.doi.org/10.2147/MDER.S25800

