
Manuscript accepted on :
Published online on: 18-11-2015
Plagiarism Check: Yes
Fatemehsadat Mir Mohammad-Makki1, Parisa Ziarati2*
1Department of Food Sciences and Technology, Faculty of Advanced Sciences and Technology, Pharmaceutical Sciences Branch, Islamic Azad University, Tehran - Iran (IAUPS)
2Departments of Medicinal Chemistry, Faculty of Pharmacy, Pharmaceutical Sciences Branch, Islamic Azad University, Tehran - Iran (IAUPS)
DOI : https://dx.doi.org/10.13005/bpj/589
Abstract
In recent years, an increasing interest concerning determination of nitrate levels in food products has been observed, essentially due to the potential reduction of nitrate to nitrite, which is known to cause adverse effects on human and animal health. The main goal of this study was measuring nitrite and nitrate contents of tomato derived products samples commercially available in Iran market in comparison on fresh tomato. Taking fresh and untreated samples was done by going to the chosen areas of recognized farms in Khuzestan, Kerman and South of Tehran provinces, and a total of 456 samples of 8 varieties of tomato products during 5 consecutive months of 2014 - 2015 were taken and analyzed. In order to conduct a comparison between the content of nitrate and nitrite in the samples studied, dry matter content was determined according to the association of office analytical chemists (AOAC, 2000). A fifty gram sample of the prepared tomato was blended with 50ml distilled water in a home blender. The mixture was filtered and was passed through a glass 39 column fitted with a tape and filled with activated alumina, in order to separate the color of Chlorophyll and get a transparent solution. The eluted solution by water filtered using 0.45um filter paper in order to eliminate the turbidity and get a clear solution. Nitrite concentration in tomato samples were determined by spectrophotometric methods at a wavelength of 538 nm, and nitrate concentration was determined after reducing nitrate to nitrite by using cadmium column. The different agricultural areas in the different provinces in this research show a significant effect on the nitrate and nitrite contents in tomato samples tested (p<0.003) as nitrate and nitrite content in Tehran farmlands were significantly higher. The highest level of nitrate was found in ketchup by range of: 15.01-167.54 and mean content of 65.73±0.007 (mg/kg FW ±SE). This concentration is significantly higher that other tomato products while in ketchup and pizza sauce the lowest nitrite content was found: 0.10±0.001 and 0.11±0.001 ( mg/kg FW ±SE) respectively and tomato juice packaged samples have the highest level of nitrite
Keywords
Nitrate; Nitrite; Fresh tomato; Tomato processed products
Download this article as:| Copy the following to cite this article: Mohammad-Makki F. M, Ziarati P. Nitrate and Nitrite in Fresh Tomato and Tomato derived Products. Biomed Pharmacol J 2015;8(1) |
| Copy the following to cite this URL: Mohammad-Makki F. M, Ziarati P. Nitrate and Nitrite in Fresh Tomato and Tomato derived Products. Biomed Pharmacol J 2015;8(1). Available from: http://biomedpharmajournal.org/?p=861 |
Introduction
In recent years, an increasing remarkable concerning determination of nitrate levels in food products has been observed, essentially due to the potential reduction of nitrate to nitrite, which is known to cause adverse effects on human and animal health. Therefore, the screening and monitoring in surveillance of the quality of vegetal products need to be strengthening (1). Tomatoes are unique fruit vegetables composed of varied types of tissues and have key role in human diet and play a critical role in the perception of texture (2).
Tomatoes and their products provide an essential source of vitamin C, potassium, and antioxidants (primarily lycopene) present at high concentrations in tomatoes and tomato products, has attracted considerable attention because of epidemiological evidence that suggests this compound may provide protection against cancer and other degenerative diseases (3).
Nitrates and nitrites seem to be among the chemicals that may cause pollution. Many studies have shown these compounds can threaten the environment and living health (4). Nitrates and nitrites may accumulate in plants tissues and are very dangerous substances for human health, leading health disturbances (methemoglobinemia). Some epidemiological studies linking intake of nitrate and nitrite with gastric cancer in humans indicated a positive correlation (5). Exposure to higher levels of nitrates or nitrites has been associated with increased incidence of cancer in adults, and possible increased incidence of brain tumors, leukemia, and nasopharyngeal (nose and throat) tumors in children in some studies but not others. The U.S. EPA concluded that there was conflicting evidence in the literature as to whether exposures to nitrate or nitrites are associated with cancer in adults and in children (6). Almost 80 % of the earth’s atmosphere consists of nitrogen as the most abundant chemical element. Nitrogen is also a key component of essential biomolecules such as amino acids, vitamins, hormones, enzymes, and nucleotides. In living tissues, nitrogen is ranked quantitatively as the fourth most common element behind carbon, oxygen and hydrogen and is an integral part of the nitrogen cycle, which continuously interchanges nitrogen between organisms and the environment (7). Nitrite (NO2) and nitrate (NO3) are soluble in water and are composed of nitrogen and oxygen atoms. When N-NH3 or other forms of nitrogen present in water are aerated, they produce nitrate. The presence of nitrate and nitrite in food is related to vegetable consumption (8). The concentration and amount of nitrates levels in plants will vary depending on the type of vegetable, the temperature that it is grown at, the sunlight exposure, soil moisture levels and the level of natural nitrogen in the soil (5). The Scientific Committee for Food reviewed the toxicological effects of nitrate and nitrite and established an Acceptable Daily Intake (ADI) of 0-3.7 mg/kg b.w. for nitrate in 1990 (8) , retained the ADI in 1995 and derived an ADI of 0-0.06 mg/kg for nitrite (9). The JECFA completed its most recent review in 2002 and reconfirmed an ADI of 0-3.7 mg/kg b.w. for nitrate and set an ADI of 0-0.07 mg/kg b.w. for nitrite (7, 10, 11). The tomato has an increasing consumption in recent years as an important part of the low-energy foods. The Global tomato production (fresh and processing) has increased 291 percent since 1961, reaching 108 million metric tons in 2002 (12). Vegetables form the major daily intake source of nitrates in humans supplying about 70-90 % of the total Intake. This intake depends on the type of vegetables consumed, nitrate vegetable levels and the amount of vegetables actually consumed. When large amounts of vegetables are consumed, which have accumulated high amounts of nitrates, a need thus arises for the systematic control of the dietary intake of nitrogenous compounds (13). Because of the potential health hazards as a result of high intake of nitrate and nitrite, the determination of these ions content in vegetables has been considered and measured in many countries (1). In Iran the harvest of greenhouse products including cucumber and tomato is done traditionally and by hand in most of provinces such as Kerman and Khuzestan. More than half of the vegetable’s area under cultivation in the country of Iran is in seven provinces of Khuzestan, Fars, Hormozgan, Kerman, Hamedan, Zanjan, Golestan (14,15) . Among them, Khuzestan has 71077 hectares and 12.73% of the total cultivated area and the first rank devote to it for produced amount and cultivated area (14, 15, 16) .Greenhouse products are harvested gradually and in several harvests. The number of harvesting these products is different in terms of weather conditions in various seasons. The products are quickly carried to market in four seasons after harvesting and there is no special storage at any stage of marketing. The transport of greenhouse products is done by private car and van to vegetable field and by truck for long distances. The main buyers of the product include provincial buyers, wholesalers and shop owners (16).
The main goal of this study was measuring nitrite and nitrate contents of tomato derived products samples (fruit juice, ketchup, pizza and tomato sauce) commercially available in Iran market in comparison on fresh tomato. Taking fresh and untreated samples was done by going to the chosen areas of recognized farms in Khuzestan, Kerman and South of Tehran.
Study Area:
In Iran tomatoes could be cultivated on open farms in the whole of a year because of very different climate exist from north to south of country in the same season, such as, on a winter day in some Northern cities the temperature is by day –5°C and by night –20°C, meantime, in southern cities is +8°C to +25°C. But the winter crop in south of Iran is not suitable to produce paste and peeled tomato because of its poor color, so 95% are consumed fresh, but in summer crop because of ideal climate for tomato cultivation: fully and enough sunny days and large difference between day and night-time temperature tomatoes are produced in good color which results good color quality paste (14, 17). Tomato (Lycopersicum esculentum L.) is one of the warm season fruits which are sensitive to cold. It is being cultivated in about 17000 ha of Jiroft and Kahnooj areas and an annually production of 450,000 tons, ranking the 3rd tomato producer of the country, after Fars and Khorasan provinces (18). In this study 30% of samples were collected from Jiroft area located in N: 27o 30′ and E: 57o 25′, 6259 m height above sea level in Kerman province. The 40 other percent of samples were purchased from 4 major tomato-growing areas of Khuzestan province in southwest of Iran, including: 1) Behbahan, 2) Dezfoul, 3) Andimeshk and 4) Ahwaz. Province of Khuzestan is located in the Southwest of the country, bordering Iraq and the Persian Gulf. Its capital is Ahwaz and it covers an area of 63,238 km (19, 20) and the remaining 30% collected from south farmlands of Tehran province.
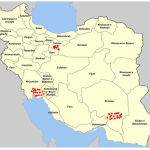 |
Figure 1: The map of sampling localities, including the studied provinces |
Sampling Method
A descriptive – analytical and cross-sectional study was conducted for determination nitrate and nitrite in fresh tomato crops in Tehran, Khuzestan and Kerman recognized farmlands and also fruit juice, ketchup, pizza and tomato sauce products commercially available in Iran market.
456 samples of 8 varieties of tomato products during 5 consecutive months of 2014 and 2015 collected in the 8 important agricultural areas in the south of Iran: Khuzestan and Kerman provinces and Tehran greenhouse farmlands and also derived tomato products were collected. Sampling was replicated twice within each month at intervals of two weeks. To evaluate variability of nitrate and nitrite content within sub-samples, five plants or bundles of sub-samples (2280 sub-samples) on the whole were analyzed separately by two ways: fresh weight and dried weight methods. In order to be sure about the accuracy of the results 150 samples were analyzed for nitrate and nitrite content by ion chromatography and colorimetric method too. A half of each sub-sample was taken for nitrate determination and another half was used for moisture measurement. Moisture content was determined by the difference between weights before and after heating at 60 – 700 c for 48 hr. 128 tomato processed derived samples ( ketchup, pizza sauce, tomato juice and tomato paste samples were analyzed at the same time too.
Quantitative Determination
Quantitative determination of nitrate
For nitrate analysis, sub-samples were chapped and mixed with a food processor. Fifty to seventy grams of sub-sample were weighed and placed into a mixer. Deionized water was added to the samples (nine times than exact the sample weight) and the water and sub-sample were homogenized for 15 minutes (21-24). A 30 gram sample of homogenate was placed in a centrifuge tube, and 0.5 ml of H2O2 was added and the tube was capped and shaked well by the hand after adding H2O2. All samples were centrifuged at 3500 rpm for 3 min. The supernatant was then separated and filtered with filter paper wattman ≠ 1 and nitrate concentration in the filtrate was determined calorimetrically by a flow injection analysis system (25-27). Nitrate content was expressed as mg nitrate per kg on a fresh weight basis (mg NO3/kg FW) unless otherwise stated. Nitrate concentration in celery was calculated from nitrate content in leaves and petioles separately on the weight of each part.
Quantitative Determination of nitrite
with the AOAC official Methods 973/31. A portion of solution containing nitrite was transferred into a 25 mL volumetric flask. Then 2.5 mL sulfonamide were added, followed by addition of 2.5 mL NAD (N−(1−naphthyl) ethylenediamin.2HCl).The volume was complete with water and left 15 minutes in order to give time for color development. The absorbance was measured at 545 nm against a blank solution. The nitrite concentration was determined using the calibration curve solutions of 0.2, 0.4, 0.6, and 0.8 ppm NaNO2. The absorbance values were measured at 545 nm. The calibration curve was constructed by plotting the absorbance vs. the concentration (22).
Statistical Analysis
Values were expressed as the mean (g/kg) ± standard deviation (SD). Seasonal differences on the basis of the type of vegetables and crops were determined by student t-test. Seasonal changes were calculated by one way ANOVA and for analysis of the role of multiple factors univariate analysis was used by SPSS 20 .Probability values of <0.05 were considered significant.
Results
The different agricultural areas in the different provinces of Tehran-Kerman and Khuzestan in this research show a significant effect on the nitrate and nitrite contents in tomato samples tested (p≤0.003) as nitrate and nitrite content in Tehran farmlands were significantly higher (figures 1and 2). Nitrate and nitrite mean content and their ranges in fresh fruit and processed products were determined as fresh weight and shown in Table1 and 2 respectively.
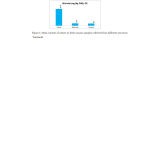 |
Figure 2: Mean content of nitrate in fresh tomato samples collected from different provinces ´farmlands |
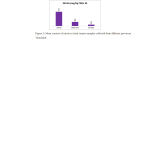 |
Figure 3: Mean content of nitrite in fresh tomato samples collected from different provinces ´farmlands |
Table 1: Average nitrate (NO3) content (mg/kg FW) in the fresh tomato and tomato products available commercially in Iran market in 2014- 2015
| Crops | No. of
Samples |
Mean(NO3) mg/kg ±S.E* | Range (mg/kg FW) |
| Tomato Fruit | 120 | 12.55±0.002 | 0.93 – 66.54 |
| Tomato paste | 34 | 18.98±0.003 | 1.78- 98.44 |
| pizza sauce
|
30 | 40.04±0.005 | 10.23-82.11 |
| Tomato Juice | 32 | 6.77±0.002 | 2.01-16.0 |
| ketchup | 40 | 65.73±0.007 | 15.01-167.54 |
| * S.E : standard error of the mean | |||
Table 2: Average nitrite (NO2) content (mg/kg FW) in the fresh tomato and tomato products available commercially in Iran market in 2014- 2015.
| Crops | No. of
Samples |
Mean(NO2) mg/kg ±S.E* | Range (mg/kg FW) |
| Tomato Fruit | 120 | 0.21±0.001 | ND – 1.33 |
| Tomato paste | 34 | 0.12±0.001 | ND – 0.22 |
| pizza sauce
|
30 | 0.11±0.001 | ND – 1.12 |
| Tomato Juice | 32 | 0.28±0.001 | 0.09 – 0.67 |
| ketchup | 40 | 0.10±0.001 | ND – 0.22 |
| * S.E: standard error of the mean, ND: Not Detected. | |||
The results concerning nitrate contents in tomatoes and derived products are shown in table 1 and reveals that nitrate level in analyzed fresh tomato fruits ranges between 0.93 – 66.54 with an average of 12.55±0.002 (mg/kg FW ±SE). The highest nitrate content was found in Shaheray in the south of Tehran province (Farmland 3): 66.54 and the lowest was in Jiroft (Farmland 2): 0.93 (mg/kg FW ±SE). For tomato juice, the nitrate level ranges 2.01-16.0, with an average of 68.65 mg/kg. All the values are lower than those for corresponding tomatoes. For tomato sauce, the nitrate level ranges between 2.01-16.0 with an average of 6.77±0.002 (mg/kg FW ±SE) . The nitrate levels in tomato sauce are higher than those for corresponding tomatoes due to the concentration process that takes place during tomato processing into sauce and the mean level was found: 40.04±0.005 (mg/kg FW ±SE). The highest level of nitrate was found in ketchup by range of: 15.01-167.54 and mean content of 65.73±0.007 (mg/kg FW ±SE). This concentration is significantly higher that other tomato products. The results of nitrite in studied samples shows different trend as in tomato juice the highest level has been found by the range of 0.09 – 0.67 and the mean of 0.28±0.001 (mg/kg FW ±SE) while in ketchup and pizza sauce the lowest nitrite content was found(0.10±0.001 and 0.11±0.001 mg/kg FW ±SE) respectively. It is clear that the result of our study shows a variation in the nitrate and nitrite levels in the different processed samples.
Discussion
In humans, dietary nitrate is rapidly absorbed via the stomach and the proximal intestine into the plasma and at least 25% is transported into the saliva. The salivary nitrate concentration is approximately 10-fold that of plasma due to bio-concentration. On the surface of the tongue, commensal bacteria reduce approximately 20% of the secreted nitrate into nitrite) which is then swallowed along with the unconverted nitrate. Healthy adults have a salivary conversion of nitrate to nitrite of normally 5-7% of the total nitrate intake, whereas infants and patients with gastroenteritis who have a higher gastric pH can have a considerably greater conversion rate (28-30). The accumulation of nitrates in vegetables depends on many factors; genetic, agricultural (e.g. type of soil, the dose and chemical forms of nitrogen, availability of other nutrients, herbicide application etc.) and those environmental such as air humidity. Further differences in nitrate accumulation may arise from the time of harvest, vegetation season and storage time. Finding from this research reveals that for the processed tomato products, by arranging the results of mean content of nitrate level, the following order : tomato juice < tomato fruit < tomato paste < pizza sauce < ketchup is remarkable.
According with WHO legislation (31) all the analyzed fresh tomatoes and derived products present nitrate levels lower than those imposed by legislation. In conclusion, they meet the safe limits for toxic elements specified by the food standards and are safe to be marketed and consummated.
The difference amount of nitrate and nitrite in fresh tomato collected from the studied provinces could be related to their ecology conditions as growing conditions like temperature stress (drought), hot or dry winds affect the nitrate accumulation in plants (32), it has been found that vegetables grown in winter, the time of year with low temperature and less sunlight, has a higher nitrate content (33, 34).
The nitrite contents of tomato have been investigated in several countries. For instance, in China, the study of the center for food safety in Hong Kong in 2012 shows average concentration of 0.5 mg/kg in Hong Kong (35). In 2008 in Iran; Ardabil Province, the concentration ranges between ND – 0.76 mg/kg (36). In Romania, the study of Simion et al, in 2008 shows nitrite concentration less than 1 mg/kg ( 37) .In Turkey, nitrite average concentration was 0.36 mg/kgin 2007 (38). In Syria in 2013, the amounts of nitrate were within satisfactory limits and even lower than those recorded in numbers of international studies (39). Despite the fact that presence of nitrate and nitrite in tomato vegetable fruit are in low concentration (<200 mg kg−1 FW) (40), it can be suggested that the consumption of these products does not pose a health risk for the consumers as the values obtained are below the FAO/WHO limits, but the tomato and its derived products is not alone source of dietary nitrate and nitrite. Therefore, certain group of consumer such as vegetarians, young children and elderly with cardiovascular problems and kidney deficiency who may intake these food items for long term should be extra cautions as they are more susceptible to toxicities.
Conclusion
In spite of the overuse of fertilizer practiced by the farmers especially in Tehran-the capital city of Iran , the accumulation of both nitrate and nitrite content in samples of different cultivated crops shows that tomato fruits contain the low nitrate content, while in ketchup and pizza sauce nitrate content shows a significantly higher nitrate levels( p<0.001 ). On the contrary although tomato juice has the lowest content of nitrate, this product has the significantly highest nitrite content among tomato derived products (p<0.003). In addition the result proved that the tomato product contains high nitrate content than the pulp. The result also shows high nitrate content in ketchup than other products and high nitrite content in Tomato Juice samples.
Acknowledgement
This research work was supported by Pharmaceutical sciences branch, Islamic Azad University.
Reference
- Simion V, Campeanu G.H, Vasile G, Artimon, M, Catana, L, Negoita M. Nitrate and Nitrite Accumulation in Tomatoes and Drive Products . Roumanian Biotechnological Letters. 2008;13(4):3785-3790.
- Barrett D. M,Garcia E,Wayne J.E. Textural Modification of Processing Tomatoes .Critical Reviews in Food Science and Nutrition . 1998; 38(3): 173–258.
- Bhowmik D. Sampath Kumar K.P, Paswan S, Srivastava Tomato- A Natural Medicine and Its Health Benefits. Journal of Pharmacognosy and Phytochemistry .2012; 1(1): 33-44. Available on line : www.phytojournal.com.
- Ziarati P.Comparison of Nitrate Content in Soils of Vegetable Farms in Tehran. JAASP 2012; 1(1): 53-57.
- Andrei C, Beceanu D. The Studies on The Dynamics Content of Nitrates and Nitrites From Tomatoes and Products Resulting From Technological Flow of Obtaining Tomato Juice. seria Agronomie .2012; 55: 147-150.
- U.S. Environmental Protection Agency. 2006. (External Review Draft).http://cfpub.epa.gov/ncea/cfm/recordisplay.cfm?deid=56747
- Scientific Opinion of The Panel on Contaminants in The Food Chain. Nitrate in vegetables. The EFSA Journal. 2008; 689: 1-79.
- EC (European Commission. Opinion on Nitrate and Nitrite. Reports of the Scientific Committee for Food (SCF).1992. 26th Series, 21-28. Available at URL: http://ec.europa.eu/food/fs/sc/scf/reports/scf_reports_26.pdf.
- EC (European Commission). Opinion on Nitrate and Nitrite. Reports of the Scientific Committee for Food (SCF) .1997.38th Series, 1-33. Available at URL: http://ec.europa.eu/food/fs/sc/scf/reports/scf_reports_38.pdf.
- FAO/WHO (Food and Agriculture Organisation of the United Nations/World Health Organization). Nitrate (and potential endogenous formation of N-nitroso compounds). 2003a .WHO Food Additive series 50, Geneva: World Health Organisation. Available at URL: http://www.inchem.org/documents/jecfa/jecmono/v50je06.htm.
- FAO/WHO (Food and Agriculture Organisation of the United Nations/World Health Organization). Nitrite (and Potential Endogenous Formation of N-nitroso Compounds). 2003b, WHO Food Additive series 50, Geneva: World Health Organisation. Available at URL: http://www.inchem.org/documents/jecfa/jecmono/v50je05.htm.
- Pirsaheb M, Ahmadian M, Reshadat S, Poormohammadi A. The Measurement of Nitrite and Nitrate Contents of Tomato from the Vast Plain of Kermanshah State of Iran.International Journal of Agriculture and Crop Sciences .2014; 5: 1553-1559.
- Foreign Agricultural Service-United States Department of Agriculture (FAS/USDA), Processed Tomato Products Outlook and Situation Selected Countries. 2003. Available at: fas.usda.gov .Mirmohammad-Makki F, Ziarati P. Determination of Histamine and Heavy Metal Concentrations in Tomato Pastes and Fresh Tomato (Solanum lycopersicum) in Iran . BBRA 2014; 11: 537-544.Available on site: http://www.biotech-asia.org/dnload/F-Mirmohammad-Makki-and-Parisa-Ziarati-/BBRAV11I02P537-544.pdf.
- Statistics of Agriculture. Office of Statistics and Information Technology, Department of Planning and Economy. 2011. Ministry of Agriculture Jihad.
- Hassanpour B, Hassanshahi M, Younesi Economic Analysis of Marketing Margin For Greenhouse Cucumbers and Tomatoes in Kohgiluyeh-va-Boyerahhmad Province , Iran . Annals of Biological Research. 2013; 4 :146-153.
- Raczuk J, Wadas W, Głozak Nitrate and Nitrites in Selected Vegetables Purchased at Supermarket in Siedlce, Poland .Rocz Panstw Zakl Hig. 2014; 65: 15-20.
- Afshari M,Afsharmanesh G.H. R, Yousefi K. The Effect of Enriched Organic Fertilizer and Methanol Spray on the Greenhouse-Tomato Yield. Journal of Agricultural Science. 2014; 6 ( 11):14. Available on Line: file:///C:/Users/Pars/Downloads/35744-139206-1-PB.pdf.
- Ommani A.R. Determining Social, Economical and Farming Characteristics of Wheat Farmers in Khuzestan Province of Iran Regarding Adoption of low Input Sustainable Agriculture (LISA). (Thesis). 2001. Tarbiat Modarres University, (Persian).
- Ommani A. R. Productivity of Energy Consumption in Agricultural Productions: A Case Study of Corn Farmers of Ahwaz Township, Iran. African Journal of Agricultural Research 2011;6: 1-6. Available online at: http://www.academicjournals.org/AJAR
- Ziarati p. Companion Pelargonium Roseum and Rosmarinus Officinalis in Cleaning Up Contaminated Soil by Phytoextraction Technique the Role of Companion Plants in Boosting Phytoremediation Potential. International Journal of Plant, Animal and Environmental Sciences .2014;4: 46-52.
- Ziarati P, Arbabi-Bidgoli S , Evaluation of the Nitrate Content in Leafy Vegetables of Southern Parts of Tehran: A Four Seasonal Study. OMICS, Open Access Scientific Reports , 2012;1 ( 2) . Available online: http://dx.doi.org/10.4172/scientificreports.165
- Ziarati P. Assessing the Health Risk of Nitrate Content in Vegetables to the General Population in Tehran-Iran.OMICS, Open access Scientific Reports 2012; 1 (4). Available in site: http://dx.doi.org/10.4172/scientificreports.241.
- Ziarati P. Comparison of Nitrate Content in Soils of Vegetable farms in Tehran .JAASP.2012;1: 53-57. Available in Site: http://asspjournal.org.
- Seifi F, Ziarati P, Arbabi-Bidgoli S. Seasonal Fluctuation of Heavy Metal and Nitrate Pollution in Ground Water of Farmlands in Talesh, Gilan,Iran. Intl J Farm & Alli Sci. 2013; 2 : 836-841. Available in Site: http://ijfas.com/wp-content/uploads/2013/10/836-841.pdf.
- Mohammadiamini Z, Mansori Y, Zaki-Dizaji H. Feasibility Study of Cultivation of Vegetables Using a Native Planter in Khuzestan. International Journal of Advanced Biological and Biomedical Research .2014; 2: 2891-2897.
- Association of Analytical Communities (AOAC), Official methods of analysis, Washington DC, USA.1, 2000.
- Hu Z.W, Wang M. Nitrate and Nitrite in Vegetables From North Cina: Content and Intake.Taylor and Francis. 2002; 19(12) :1125-1129.
- EFSA (European Food Safety Authority). Guidance of the Scientific Committee on a request from EFSA related to Uncertainties in Dietary Exposure Assessment. 2006. EFSA Journal. 438, 1-54. Available at URL:http://www.efsa.europa.eu/EFSA/Scientific_Opinion/sc_op_uncertainty%20exp_en,5.pdf.
- EFSA (European Food Safety Authority). Risk-benefit analyis of foods. Methods and approaches. 2007. EFSA scientific colloquium summary report.13-14 July 2006. Parma. Available at URL:http://www.efsa.europa.eu/EFSA/Scientific_Document/comm_colloque_6_en,0.pdf
- EFSA (European Food Safety Authority). 2008. EFSA Concise Food Consumption Database. Available at URL:http://www.efsa.europa.eu/EFSA/ScientificPanels/DATEX/efsa_locale- 1178620753812_ConciseEuropeanConsumptionDatabase.htm .
- WHO. 1978. Nitrates, Nitrites and N-NitrozoCompounds. Genva, Environmental Health Criteria.) the safe nitrate level in tomatoes grown is maximum 300 mg/kg of fresh weight (WHO, 1978).
- WHO. 1995. Available in Site:www.agric.gov.al.ca/department/deptdocs.nsf/all/agdex851?opendocument .
- European Commission. 1998. Available in site:www.inchem.org/documents/jecfo/jecmona/v50je07.html .
- Available in site: www.positivehealth.com/permit/Article/Regular/safron23.html.
- 35. Hong Kong – Centre for Food Safety (CFS), Nitrate and nitrite in vegetables available in Hong Kong, food and environmental hygiene department, the government of the Hong Kong special administrative region, 2012.
- Ebadi A, Davari M, Razmjoo J. Nitrate and nitrite accumulation in tomato and potato in Ardabil province, International meeting on soil fertility land management and agroclimatology. International meeting on soil fertility land management and agroclimatology, Turkey. 2008; 389-392.
- Simion V, Campeanu G.H,Vasile G, Artimon M, Catana L, Negoitan M. Nitrate and Nitrite Accumulation in Tomatoes and Derived Products, ,Romanian Biotechnological Letters . Romanian Biotechnological Letters. 2008; 13(4): 3785-3790.
- Ayaz A,Topcu A, Yurttagul M. Determining Nitrate and Nitrite Content in Beverages, Fruits, Vegetables, and Stews Marketed in Arak, Iran. Journal of Food Technology. 2007; 5: 177-179.
- Amer-Zamrik M. Determination of Nitrate and Nitrite Contents in Tomato and Processed Tomato Products in Syrian Market. International Journal of Pharmaceutical Sciences Review and Research. 2013; 19: 1-5. Available online at : www.globalresearchonline.net.
- 40. Santamaria, P. Nitrate in vegetables: toxicity, content, intake and EC regulation. J. Sci. Food Agric. 2006; 86: 10-17

