
Manuscript accepted on :
Published online on: --
Plagiarism Check: Yes
A. Nithya, R. Kayalvizhi
Dept. of E and I , Annamalai University , Tamil Nadu, India.
DOI : https://dx.doi.org/10.13005/bpj/621
Abstract
Atherosclerosis is a generalized disease causes thickening of arterial wall which leads to cardio-vascular disease. Automatic algorithm for measurement of Intima Media Thickness (IMT) in B-mode in ultrasound video frames is developed. Different types of despeckling filters are used to reduce granular noise and evaluated. As well as textural features are extracted from original and despeckled image which provide information about spatial properties and image elements. Modified Otsu thresholding method is proposed to measure the Upper and Lower Intima Media Thickness range and to identify the presence of disease. The results will help the doctors and radiologist for further diagnosis.
Keywords
Intima Media Thickness; ultrasound video frames; Despeckling filters; textural analysis; Modified otsu thresholding
Download this article as:| Copy the following to cite this article: Nithya A, Kayalvizhi R. Measurement of Lower and Upper IMT from Ultrasound Video Frames. Biomed Pharmacol J 2015;8(1) |
| Copy the following to cite this URL: Nithya A, Kayalvizhi R. Measurement of Lower and Upper IMT from Ultrasound Video Frames. Biomed Pharmacol J 2015;8(1). Available from: http://biomedpharmajournal.org/?p=211 |
Introduction
Ultrasound scanning exposes the inspected part of the body to sound waves which have high frequency as well as it shows the movement and shape of internal parts of the body organ. It is a non –invasive test. Doppler ultrasound is also used to diagnose carotid arteries. Ultra sound scanning modes are A-mode, B-mode and M-mode. A-mode scanning represents the amplitude mode here this strength of echo signal is measured and displayed in directional continuous signal. It is used for ophthalmology. B-mode scanning represents the brightness mode; here the strength of the echo signal is viewed as 2D gray scale image. M- mode scanning refers to A-mode with time and used for cardiology. Doppler carotid ultrasound Image is used for radiologist to evaluate tumors blood flow in blood vessels, abnormalities in lymph nodes and lymphatic vessels. Atherosclerosis is a disease which due to accumulation of cholesterol, protein and lipid arterial wall causes thickening. Thickening leads to narrowing of vessels (caused by plaque) and blocks the blood flow (clots).
Blockage or narrowing carotid arteries increase the risk of having a heart disease or stroke. Measurement of 2 innermost layers of arterial wall is called IMT otherwise measurement of Atherosclerosis, Which gives the distance of borders between lumen-intima and media-adventitia.
Many works have been carried out for the measurement of IMT like:VanderMeer et al [1] proposed that thickening of arterial wall layers like intima and medial leads to cardiovascular disease. Bianchini et al [2] present a method for arterial stiffness evaluation. By measuring the thickness change in heart with local pulse pressure and compared that value with femoral pulse wave velocity for arterial stiffness evaluation.Destrempes et al.[3] proposed a model based on properties of carotid arteries tissue like elastogram are modelled by Nakagami distribution and Expectation Maximization algorithm is used to compute the posterior estimation of it. An automatic system was developed by Linguri et al [4] which depends on a analytical approach for measurement of carotid intima media thickness and to determine the intrinsic accuracy of the system. Improved active contour technique by a multiresolution analysis is presented for measuring lumen diameter and IMT [5]. This automatic technique and manual segmentation technique for blood vessel are compared based on the parameters like co-efficient of variability and correlation. This improved active contour technique produces a best result. In this paper IMT measurement is based on unsupervised computer aided detection (CAD) algorithm [6].
The Intima Media Complex (IMC)[7] is best visualized in longitudinal sections of the common carotid artery. It is composed of two quasi-parallel lines that represent the Lumen Intima (LI) and the media adventitia (MA) interfaces. The thickening of the intima and medial layers is caused by inflammatory-fibro proliferative responses to various forms of insult. It involves lipid accumulation and the migration and proliferation of many cells in the subintimal and medial layers, which result in the formation of plaques. It is the rupture of such plaques that causes myocardial infarcts (heart attacks), cerebrovascular events (strokes), peripheral vascular disease (gangrene), and kidney infarcts. The Rotterdam study [8] indicates that the risk of myocardial infarction increases 43% per standard deviation increase (0.163 mm) in common carotid IMT [8].
Atherosclerotic disease occurs when IMT is higher than 0.9 to 1.0 mm. indicates a potential atherosclerotic disease. Hence, the robust segmentation and measurement of the IMT has a considerable impact in the early diagnosis of atherosclerosis, prognosis prediction, and in the monitoring of responses to lifestyle and prescribed pharmacological treatments. The accuracy of the manual tracing process was analyzed in “Associations of edge-detected and manual-traced common carotid Intima-media thickness measurements [9]. Disadvantages of the existing system are that they do not take into consideration the speckle noise or the image normalization in the ultrasound image. They require manual correction after automatic tracing. This increases the computational time and the error probability associated with the identification of the IMC in video data. In the existing we had used watershed segmentation algorithm.
Materials and Methods
In this paper, an algorithm to segment the carotid artery in the ultrasound video or in the first frame of the video sequence is developed completely by unsupervised and includes the following computational steps: automatic Region of Interest (ROI) detection by using adaptive thresholding, and binarization by using Otsu’s thresholding. The segmented carotid artery region consists of multiple noises. Among them the content of the speckle noise will be high. So in order to remove the noise we can use filters like lee, kuan, wavelet denoising and SRAD (Speckle Reduction Anisotrophic Diffusion).
This process is Despeckling. After applying binarization technique and by performing morphological operations the carotid artery region in the image will be in enhanced form, such as it is easy for us to measure the Intima Media Thickness (IMT). Finally the Upper and Lower Intima Media Thickness range will be measured. Figure 2.1 shows the overall proposed block diagram.
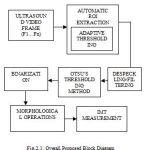 |
Figure 1 : Overall Proposed Block Diagram |
Image Acquisition
Image acquisition process generates large ultrasound image sequences that are interpreted using either manual annotation procedures or histological validated semi-automatic image-processing environments. The Ultrasound image sequences of longitudinal sections of the Common Carotid Artery (CCA) of some patients are captured. The captured image which is in color format is converted into gray
Scale image. Figure 2.2 shows the ultrasound frame in color image and Figure 2.3 shows the converted gray scale image.
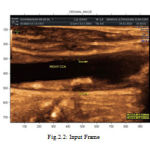 |
Figure 2 : Input Frame |
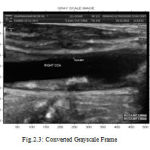 |
Figure 3 : Converted Grayscale Frame |
ROI Extraction
Region of interest (ROI) detection is one of the steps used in segmenting the Intima Media Complex (IMC) in the image sequence which is completely unsupervised. The main principle behind the proposed approach is to identify the location of the far wall interface using a suite of image processing steps that combine the information contained in the intensity domain with knowledge relating to the anatomical structure of the carotid artery. From the input image, the required portion is cropped and that cropped image is used for further processing. Figure 2.4 shows the ROI selected from the input image. Figure 2.5 and Figure 2.6 shows the cropped upper and lower part for the measurement of intima media thickness respectively.
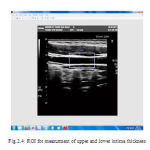 |
Figure 4 : ROI for measurment of upper and lower intima thickness |
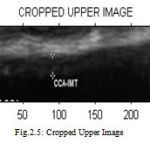 |
Figure 5 : Cropped Upper Image |
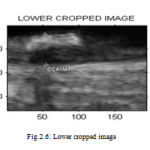 |
Figure 6 : Lower cropped image |
Despeckling/Preprocessing
Speckle in ultrasound scan are granular in structure which occurs due to coherent interferences of back scattered echos from the scatters that are smaller than spatial resolution of ultrasound system. It is a multiplicative noise. Speckle pattern depends on many parameters of image and tissues in medical image. Speckle affects the contrast and resolution of the image. Speckle pattern are classified into fully formed speckle, Non randomly distributed with long range order and Non randomly distributed with short range order classes.
Main purpose in despeckling are :
- Clear boundaries will be obtained which improves human interpretation.
- Improves speed and accuracy in automatic segmentation and registrarion of medical images.
Filters used for Despeckling are discussed below:
Lee Filter
Lee Filter is based on multiplicative speckle model and it can use local statistics to effectively preserve edges. This filter is based on the approach that if the variance over an area is low or constant, then smoothing will not be performed, otherwise smoothing will be performed if variance is high(near edges). In higher contrast region lee filter produces an output value close to input and for uniform region output value will be close to local mean.
Img(i,j)=Im+W∗(Cp−Im) (1)
Where Img is the pixel Value at indices i, j after filtering, Im is mean intensity of the filter window, Cp is the center pixel and W is a filter window given by:

Where, is the variance of the pixel values within the filter window and is calculated as:

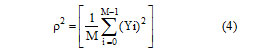
Here, N is the size of the filter window and Xj is the pixel value within the filter window at indices j. The parameter ρ is the additive noise variance of the image given in following equation, where M is the size of the image and Yj is the value of each pixel in the image.
If there is no smoothening, the filter will output only the mean intensity value (Im) of the filter window. Otherwise, the difference between Cp and Im is calculated and multiplied with W and then summed with Im. The main drawback of Lee filter is that it tends to ignore speckle noise near edges.
Kuan Filter
Kuan filter is a local linear minimum square error filter based on multiplicative order it does not make approximation on the noise variance within the filter window like lee filter it models the multiplicative model of speckle noise into an additive linear form. The weighting function W is computed as follows:
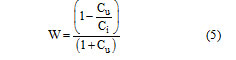
The weighting function is computed from the estimated noise variation coefficient of the image, Cu, Ci computed as follows:
![]()
Where S is the standard deviation in filter window and Im is mean intensity value within the window. The only limitation with Kuan filter is that the ENL parameter is needed for computation.
Wavelet Denoising
There are two thresholding functions frequently used i.e. Hard Threshold, Soft threshold. Hard-Thresholding function keeps the input if it is larger than the threshold ; otherwise, it is set to zero. Soft-thresholding function takes the argument and shrinks it toward zero by the threshold. Soft-thresholding rule is chosen over hard-thresholding, for the soft-thresholding method yields more visually pleasant images over hard thresholding. A result may still be noisy. Large threshold alternatively, produces signal with large number of zero coefficients. This leads to a smooth signal. So much attention must be paid to select optimal threshold. This paper suggested speckle reduction through wavelet transform based on Bayesian approach by means of the statistical models of both noise and signal.
Speckle Reducing Anisotropic Diffusion (SRAD) Filter
SRAD is a Partial Differential Equation (PDE) approach to spackle removal in images. The PDE-based speckle removal approach allows the generation of an image scale space (a set of filtered images that vary from fine to course) without bias due to filter window size and shape.Basic theory: SRAD is an anisotropic diffusion method for smoothing speckled imagery. Given an intensity image Io(x,y) having finite power and no zero values over the image support Ω, the output image I(x, y; t) is evolved according to the following PDE:
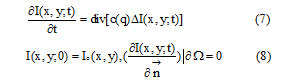
Where denotes the border of Ω, is the outer normal to the , and
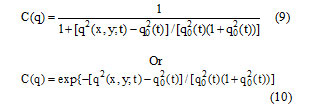
In above equations q(x, y; t) is the instantaneous coefficient of variation is determined by
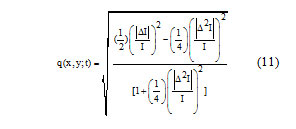
And qo(t) is the speckle scale function. In the SRAD, the instantaneous coefficient of variation q(x, y; t) serves as the edge detector in spackled imagery. The function exhibits high values at edge or on high-contrast features and produces low values in homogenous regions. The modification reflects encouraging isotropic diffusion in homogenous regions of the image where q(x, y; t) fluctuates around qo(t). The speckle scale function qo(t) effectively controls the amount of smoothing applied to the image by SRAD and it is estimated using.

Where var[z(t)] and are the intensity variance and mean over a homogenous area at t, respectively
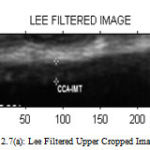 |
Figure 7(a) : Lee Filtered Upper Cropped Image |
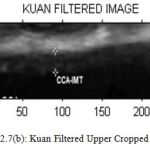 |
Figure 7(b) : Kuan Filtered Upper Cropped Image |
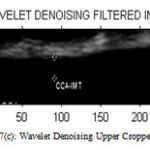 |
Figure 7(c) : Wavelet Denoising Upper Cropped Image |
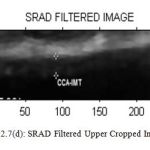 |
Figure7(d): SRAD Filtered Upper Cropped Image |
Table 1: Performance of Filters for Upper Cropped Image
| LEE | KUAN | WAVELET | SRAD | |
| PSNR | 37.5366 | 38.3387 | 12.4837 | 47.8396 |
| MSE | 11.4661 | 9.5326 | 3.6704 | 1.0693 |
| NCC | 0.9877 | 0.9858 | 0.0015 | 0.1617 |
| NAE | 0.0265 | 0.0394 | 0.999 | 0.8572 |
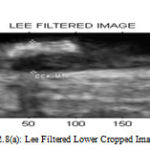 |
Figure 8(a): Lee Filtered Lower Cropped Image |
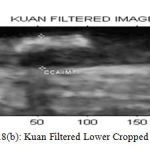 |
Figure 8(b) : Kuan Filtered Lower Cropped Image |
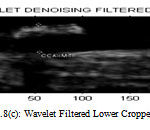 |
Figure 8(c) : Wavelet Filtered Lower Cropped Image |
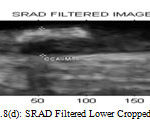 |
Figure 8(d) : SRAD Filtered Lower Cropped Image |
Table2 : Perfomance of Filters for Upper Cropped Image
| LEE | KUAN | WAVELETT | SRAD | |
| PSNR | 39.147 | 6.1347 | 9.0979 | 47.5224 |
| MSE | 7.9129 | 15.8345 | 8.0036 | 1.1504 |
| NCC | 0.9958 | 0.992 | 0.0013 | 0.2345 |
| NAE | 0.0146 | 0.0336 | 0.999 | 0.7798 |
When compared to other filters SRAD filter have high Peak Signal to Noise Ratio so image has high quality and Mean Squared Error (MSE) is also reduced. Normalized Cross Correlation (NCC) score value ranges from -1 to 1. If the value is close to 1 then it is perfect match if the value is close to -1 then it is anti-correlated. Normalized Absolute error (NAE) is low which means image quality is good.
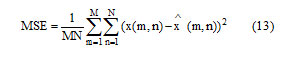
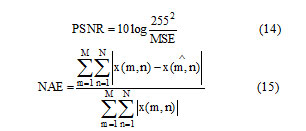
Quality Measurement Formula
X(m,n) denotes the samples of original image, denotes the samples of compressed image. Where M and N denotes the number of pixels in the row and coloumn.
Thresholding
Thresholding is the simplest method of image segmentation. Thresholding classifies the pixel of an image into object and background of two classes for bi-level thresholding. For complex multilevel thresholding method pixel in an image are segmented into several distinct groups in which the pixels of the same group have gray levels within specific range.
Modified Otsu Thresholding algorithm is given below:
- Input Image I(x,y).
- Obtain the histogram values (h) of the image I(x,y).
- Set the initial Threshold value: Tin = ∑(h*total shades)/∑h
- Segment using Tin value. This will produce two groups of pixels P1 and P2.
- Repeat step-3 to obtain the new threshold values for each class (TP1 &TP2).
- Compute the new threshold value: Tnew = Tp1 + Tp2 / 2
- Repeat the steps 3-6 until the difference in Tnew successive iterations is not tends to zero.
- Now apply the Otsu method for the obtained threshold value for further segmentation process
Operations on Binary Images
Binary image operations are used to improve segmentation which is imperfect, object selection and analysis of connectivity of components. Operations on binary images are thinning, thickening, dilating, finding branch points and endpoints, removing isolated pixels, shifting and breaking connections based on structuring element. Since the pixels can only have two values, the morphological operations are erosion (any unset pixels within the structuring element cause the pixel to be unset) and dilation (any set pixels within the structuring element cause the pixel to be set). Important operations are morphological opening and morphological closing which consist of erosion followed by dilation and dilation followed by erosion, respectively, using the same structuring element. Opening tends to enlarge small holes, remove small objects, and separate objects. Closing retains small objects, removes holes, and joins objects. Figure 2.9 and 2.10 shows the existing upper and lower binarized image.
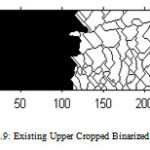 |
Figure 9: Existing Upper Cropped Binarized Image |
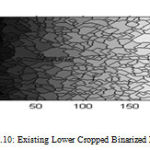 |
Figure 10 : Existing Lower Cropped Binarized Image |
Existing Upper Intima Media Thickness Is 2.037289 mm
Existing Lower Intima Media Thickness Is 0.582083 mm
After converting the image into binarized image, remove all the pixels smaller than 600 by using morphological operations. In the morphological processed image, remove the holes occurred between two lines
Feature extraction
In feature extraction module different texture and shape features are extracted from the dataset plaque images like
- First order statistical features
First order features used are mean, median, standard deviation, skewness, kurtosis, entrophy, energy.
- Spatial Gray Level Dependence Matrix(SGLDM)
Image grey levels for all pair of combinations of joint probabilities are estimated.The distance between pixels (d=1) and the orientation ( θ=0,45,90,135) are the two parameters used in calculating these probabilities. For each variation following texture features are computed:Autocorrelation, Cluster Prominence, Cluster Shade, Dissimilarity, Energy, Sum of squares, Variance, Sum average ,Sum variance ,Sum entropy ,Difference variance ,Difference entropy, Information measure of correlation1,Information measure of correlation2, Inverse difference normalized (INN),Inverse difference moment normalized.
- Neighborhood-Gray-Tone Difference Matrix
Extract textural features of a neighbourhood 3×3 that correspond to visual properties of texture like Coarseness, contrast, busyness, complexity and strength.
- Grayscale Median
- Gray Level Co-Occurrence Matrix
Desriptors evaluated using the co-occurrence matrices are Maximum probability, Uniformity, Contrast, Correlation, Homogeneity, Entropy.
Measurement Of Intima Media Thickness (IMT)
Intima-media thickness (IMT), also called intimal medial thickness, is a measurement of the thickness of tunica intima and tunica media the innermost two layers of the arterial wall. Size less than 0.9 mm is not having atherosclerosis disease and above 0.9mm are having disease.
RESULTS AND DISCUSSIONS
After selecting the ROI from the upper cropped image and applying filtering process, otsu’s thresholding convert the image into binarized image then apply morphological operation which removes small holes which is show in Figure 2.13. Then the final image obtained is the carotid artery output image from which the upper intima media thickness is measured. Figure 2.11 and 2.12 shows the proposed upper and lower binarized image.
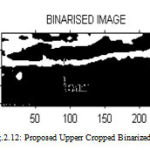 |
Figure 12a : Proposed Upperr Cropped Binarized Image |
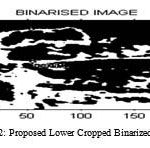 |
Figure 12b : Proposed Lower Cropped Binarized Image |
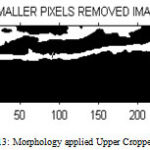 |
Figure 13 : Morphology applied Upper Cropped Image |
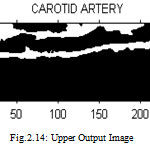 |
Figure 14 : Upper Output Image |
Proposed Upper Intima Media Thickness Is 0.952499 mm
After selecting the ROI from the lower cropped image and applying filtering process, otsu’s thresholding convert the image into binarized image then apply morphological operation which removes small holes which is show in Figure 2.15. Then the final image obtained is the carotid artery output image from which the lower intima media thickness is measured.
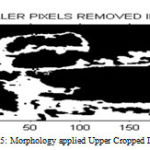 |
Figure 15 : Morphology applied Upper Cropped Image |
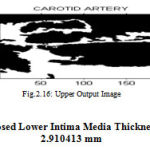 |
Figure 16 : Upper Output Image |
Proposed Lower Intima Media Thickness Is 2.910413 mm
Texture Analysis:
Gray Scale Median =136.500000 mm
Mean = 991327.000000 mm
Standard Deviation = 10386532.956065 Mm
Skewness = Nan Mm
Energy = 4919952.000000 Mm
Entropy =Nan Mm
Kurtosis =Inf Mm
Coarseness =18.672101 Mm
Contrast =0.438573 Mm
Busyness =0.000005 Mm
Complexity =174671.874960 Mm
Strength = 603089.047722 Mm
Conclusion
The computational complexity associated with the segmentation proposed in this paper is low when compared with the others. This technique remains stable when applied to data capture under different imaging conditions. The proposed scheme is robust to patient-dependent changes in the morphological structure of the carotid and to variations in ultrasound image quality. It gives robust edge detection.
Refrences
- I. M. vander Meer, M. L. Bots, A. Hofman, A. I. del Sol, D. A. van der Kuip, and J. C. Witteman. Predictive value of noninvasive measures of atherosclerosis for incident myocardial infarction. Circulation.,2004; pp. 1089–1094.
- E. Bianchini, C. Giannarelli, F. Faita, K. Raimo, V. Gemignani, L. Ghiadoni, and M. Demi . The assessment of local arterial stiffness from ultrasound images. Int. Computers in Cardiology Conf., 2007: pp. 761–764.
- F. Destrempes, J. Meunier, M. F. Giroux, G. Soulez, and G. Cloutier. Segmentation in ultrasonic B-mode images of healthy carotid arteries using mixtures of Nakagami distributions and stochastic optimization. IEEE Trans. Med. Imaging, 2009; pp. 215–229.
- P. Liguori, A. Paolillo, and A. Pietrosanto . An automatic measurement system for the evaluation of carotid intima-media thickness. IEEE Trans. Instrum. Meas.,2001; pp. 1684–1691.
- M. A. Gutierrez, P. E. Pilon, S. G. Lage, L. Kopel, R. T. Carvalho and S. S. Furuie. Automatic measurement of carotid diameter and wall thickness in ultrasound images . Comput. Cardiol., 2002: pp.359–362, 2002.
- D . E. Ilea, P. F. Whelan, C. Brown, and A. Stanton . An automatic 2D CAD algorithm for the segmentation of the IMT in ultrasound carotid artery images . Int. Conf. IEEE Eng.Med. Biol. Soc.: Engineering the Future of Biomedicine, 2009 ; pp.515–519.
- R. Ross. The pathogenesis of atherosclerosis: A perspective for the 1990s. Nature, 1993;pp. 801–809.
- F. Orzan, M. Anselmino, and M. Cannillo. Cardiovascular risk in subjects with carotid pathologies. Atherosclerosis Disease Management. Germany: Springer Science and Business Media, 2011; pp. 37–51.
- Molinari and J. S. Suri . Automated measurement of carotid artery intima-media thickness Ultrasound and Carotid Bifurcation Atherosclerosis. Springer-Verlag, 2012.
- M. Cinthio, A. R. Ahlgren, T. Jansson, A. Eriksson, H. W. Persson, and K. Lindstrom. Evaluation of an ultrasonic echo-tracking method for measurements of arterial wall movements in two dimensions . IEEE Trans. Ultrason. Ferroelectr. Freq. Control.2005; pp. 1300–1311.
- S. Golemati, A. Sassano, M. J. Lever, A. A. Bharath, D. T. Dhanjil, and A. N. Nicolaides . Carotid artery wall motion estimated from B-mode ultrasound using region tracking and block matching. Ultrasound Med. Biol. pp. 387–399.
- M. A. Lubinski, S. Y. Emelianov, and M. O’Donnell, . Speckle tracking methods for ultrasonic elasticity imaging using short-time correlation. IEEE Trans. Ultrason. Ferroelectr. Freq. Control, 1999; pp. 82–96.
- Q . Liang, I. Wendelhag, J. Wikstrand, and T. Gustavsson, “ A multiscale dynamic programming procedure for boundary detection in ultrasonic artery images. IEEE Trans. Med. Imaging. 2000; pp. 127–142.
- J. F. Polak, L. C. Funk, and D. H. O’Leary. Inter-reader differences in common carotid artery intima-media thickness: Implications for cardiovascular risk assessment and vascular age determination. J. Ultrasound Med.2011; pp. 915–920.

