
Manuscript accepted on :
Published online on: 05-11-2015
Plagiarism Check: Yes
M. Jahangiri1*, M. Saghafian1 and M. R. Sadeghi2
1Department of Mechanical Engineering, Isfahan University of Technology, Isfahan, Iran. 2Department of Biomedical Engineering, University of Isfahan, Isfahan, Iran.
DOI : https://dx.doi.org/10.13005/bpj/590
Abstract
Research on the development and incidence of cardiovascular diseases has revealed the importance of vascular wall shear stress. In this paper, the vascular wall shear stress was numerically simulated in an elastic vessel with simple and consecutive Stenosis during a pulsatile laminar non-Newtonian blood flow using ADINA 8.8. The cross-sectional area of the studied stenosis was 70% of the unstenosed vascular cross-sectional area. The results of the simple stenosis were compared with those of the double stenosis. Five non-Newtonian models of Carreau, Carreau-Yasuda, Casson, Power Law, and Generalized Power Law were employed to simulate the non-Newtonian properties of blood. The axial velocity values at the maximum flow rate showed that in both simple and consecutive Stenosis, the highest and lowest axial velocities occur in the Generalized Power Law and Power Law models, respectively. Wall shear stress profiles at the maximum flow rate showed that the Power Law model underestimates the stress values compared to other non-Newtonian models and the Newtonian model. In general, results showed that the Power Law model is not suitable for simulating the non-Newtonian behavior of blood.
Keywords
Adina; FSI; reverse flow; stenosis throat; velocity profile; wall shear stress
Download this article as:| Copy the following to cite this article: Jahangiri M, Saghafian M. J, Sadeghi M. R.Effects of Non-Newtonian Behavior of Blood on Wall Shear Stress in an Elastic Vessel with Simple and Consecutive Stenosis. Biomed. Pharmacol. J.;8(1) |
| Copy the following to cite this URL: Jahangiri M, Saghafian M. J, Sadeghi M. R.Effects of Non-Newtonian Behavior of Blood on Wall Shear Stress in an Elastic Vessel with Simple and Consecutive Stenosis. Biomed Pharmacol J 2015;8(1). Available from: http://biomedpharmajournal.org/?p=169 |
Introduction
If the cardiac arteries or the arteries supplying the brain become atherosclerotic, thrombosis is very likely to develop due to plaque rupture and platelet aggregation in the damaged area which can lead to death. Since experimental methods have their limitations in measuring parameters such as shear stress, and their required equipment is expensive, numerical methods have recently made significant progress in modeling the blood flow in stenosed vessels in the real conditions and have provided practitioners with useful information. These progresses include the use of non-Newtonian models to investigate the blood flow, as well as the consideration of the blood-vessel wall interactions, which enables the researchers to study the factors that have so far been neglected when studying vascular wall and blood flow. All these have allowed for the more accurate prediction of plaque rupture and vessel wall overlap.
Yang et al. 1 examined the blood flow in a flexible stenosed carotid bifurcation using ADINA and a
non-Newtonian model obtained based on the experimental data. They also compared the effects of considering a solid-fluid two-way coupling and only fluid or only solid one-way couplings on the parameters of velocity, Wall Shear Stress (WSS), and pressure.
Chan et al. 2 studied blood flow in a stenosed elastic artery using the Carreau and the Power-law
non-Newtonian models and examined axial velocity, WWS, wall displacement and Global importance factor (IG) of blood.
Zauskova and Medvidova 3 utilized the Carreau-Yasuda and Yeleswarapu non-Newtonian models to mathematically model the flow inside a stenosed elastic artery and compared the WSS and oscillatory shear index (OSI) values with those of the Newtonian model.
Janela et al. 4 mathematically modeled the blood flow in a 3D elastic vessel using the Generalized Newtonian and Carreau-Yasuda non-Newtonian models and compared wall displacement in different times in the Newtonian and non-Newtonian cases.
Decorato et al. 5 studied the pulsatile blood flow in an elastic carotid artery using the Casson
non-Newtonian model. They used Ansys CFX in the simulations, and the parameters of the WSS, OSI, and von Mises stress were examined.
Carreau non-Newtonian model. The parameters of velocity, WSS, and wall displacement were examined.
Kabinejadian and Ghista 7 used the Carreau-Yasuda non-Newtonian model to examine the blood flow in a coronary arterial Mortazavinia et al. 6 used Ansys CFX to investigate the pulsatile blood flow in an elastic aorta using the bypass graft. Ansys CFX was used for simulations. The parameters of axial velocity, OSI and WSS were investigated, and the results of the rigid or elastic walls and Newtonian or
non-Newtonian blood were compared.
Since no research has been carried out on the pulsatile blood flow in an elastic vessel with double stenosis using five different non-Newtonian models, this paper examines the effect of different
non-Newtonian models on WSS, reverse flow region, and axial velocity using ADINA 8.8 software. Physiological pressure and flow rate pulses were used as boundary conditions.
Governing Equations
In ADINA, equations of momentum and continuity equations are as follows 8:
where, t is time, ρ is density, V is the velocity vector, fB is the volume force vector acting on the fluid, and τ is the stress tensor calculated as follows:
Where, p is pressure, I is the unit matrix, and is the fluid viscosity.
Non-Newtonian Models
Five non-Newtonian models and a Newtonian model were used to model the fluid behavior. The formulas and their constants are presented in Table 1 in detail. The constants have been obtained by various researchers through fitting the experimental data of blood 9. In the formulas in Table 1, is the second invariant of the rate of deformation tensor and is equal to √ýýýý / 2. The relationship between viscosity and shear rate for the Newtonian model and the five non-Newtonian models is shown in figure 1.
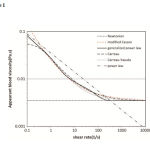 |
Figure 1: Viscosities versus shear rate for five non-Newtonian models |
Numerical Methods
An elastic vessel with a 70% symmetrical simple and double stenosis was studied here. Dimensions are shown in Figures 2a and 2b.
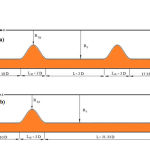 |
Figure 2: Symmetric geometry a) double stenosis b) simple stenosis |
The equation of the stenosed region of the vessel is 10:
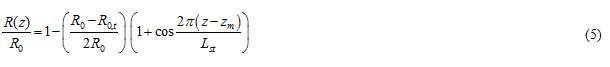
Where, R0 is the healthy vessel radius, R(z) is the vessel radius in the stenosed region, R0,t is the vessel radius at the stenosis throat, zm is the axial coordinates of the stenosis throat with respect to the origin, and Lst is the length of the stenosed region. Fluid and vessel wall properties are listed in Table 2 10.
Table 2
| 0.0005 | Thickness of artery wall (m) |
| 910 | elasticity Modulus of the artery wall (kPa) |
| 1300 | Density of artery wall (Kg/m3) |
| 0.49 | Poisson ratio of artery wall |
| 1050 | Blood Density (Kg/m3) |
| 0.0033 | Blood Viscosity (Pa.s) |
Vessel wall displacement and strain was considered large in the kinematic formulation. At the two ends of the fluid and solid models, axial and radial displacements were constrained. Boundary condition of zero normal stress was imposed on the outer wall of the vessel, assuming that the surrounding tissues do not exert any external or pressure forces on the vessel wall 11.
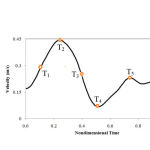 |
Figure 3: Inlet pulsatile velocity profile |
FSI boundary condition was used in the fluid-solid interface. The governing equations for the solid-fluid coupling are 10:
df= d2 : Displacement
n.σf=n.σ2 : Traction
df= d2 : no slip
Where, d, σ and n are displacement vector, stress tensor, and the normal vector, respectively. The governing equation of the solid domain is 10:
![]()
Where, ρs is the wall density, σs i
s the Cauchy stress tensor, fs is the volume force vector, and ds is the wall displacement vector.
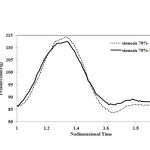 |
Figure 4: blood pressure pulses that used as the output condition |
As shown in Figure 4, when a solid-fluid coupling problem is investigated, the blood pressure pulses that are obtained in vitro must be applied as the output condition 10.
Grid independency of results was examined to obtain grid-independent results. This was carried out to determine the best results and to minimize computer running-time. Three inlet velocity pulses were considered to achieve stable and convergent solutions.
Results
Average inlet pressure for different stenosis percentages in two cases of simple and double stenosis is shown in Figures 5a and 5b. For Stenosis with a severity of up to 70%, a very good agreement was observed between the experimental results 10 and the laminar flow assumption, suggesting a laminar flow in the Stenosis less that 70%. The results of Figures 5a and 5b show that the laminar flow assumption is reasonable for Stenosis with severities of less that 70%.
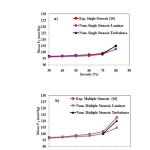 |
Figure 5: Comparisons between the average inlet pressures a) simple stenosis b) double stenosis |
Figure 6a shows the axial velocity profile at the 70% stenosis throat and figures 6b and 6c show the axial velocity profile in the throats of the first and second Stenosis (70%-70%) at the maximum flow rate time for all the models. The maximum and minimum axial velocities belonged to the generalized Power Law and Power Law models, respectively. By comparing Figures 6a and 6b, it can be seen that the second stenosis slightly increases the axial velocity at the first stenosis throat. Another result that can be seen from comparing Figures 6b and 6c is that the blood flow is inclined towards the vessel centerline after passing the first stenosis. As a result, velocity at the vessel centerline at the second stenosis throat increases by about 0.2 m/s, which is due to the opening of the vessel wall in the first stenosis. Results also show that the velocity increase in the second throat, which causes an increased shear rate, causes the Casson model to diverge from the Carreau-Yasuda models and approach the Carreau model, which is reasonable considering the viscosity-shear rate diagram, because at high shear rates (10-1000 s-1), the viscosity-shear rate diagram of the Casson and Carreau models are more similar compared to the Casson and Carreau-Yasuda models. Figures 6a-6c show that by moving from the vessel centerline toward the wall, the difference between the models decreases which can be justified considering that the shear rate is considerably higher at the vicinity of the wall because in high shear rate, viscosity-shear rate diagrams of different models converge to each other. In addition, in the second stenosis throat, due to high shear rate, the difference between the non-Newtonian models decreases more rapidly by moving away from the vessel centerline.
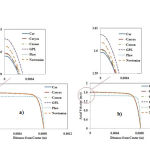 |
Figure 6: Axial velocity profile at throat of a) 70% stenosis b) first throat of 70%-70% stenosis |
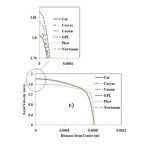 |
Figure 6: Axial velocity profile at throat of c) second throat of 70%-70% stenosis |
Figures 7a-7d show the wall shear stress profiles in the 70% and 70%-70% Stenosis in the Carreau model at the maximum and the minimum flow rates. Since the shear stress contours of other non-Newtonian models and the Newtonian model were highly similar, they are not displayed here, and the maximum shear stress and the reverse flow region length are compared in Tables 3-6. As can be seen in Figures 7a-7d, at the narrowest vessel section, shear stress is suddenly increased and then experiences a severe decrease immediately after the stenosis and even takes negative values. In the reverse flow region, the shear stress then increases at a mild slope, takes positive values, and remains constant until the end of the vessel. The results in Tables 3-6 show that the non-Newtonian models differ in the maximum shear stress and the size of reverse flow region.
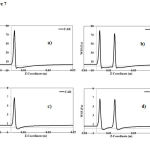 |
Figure 7: WSS profile, Carreau model a) 70% stenosis, T2 b) 70%-70% stenosis, T2 c) 70% stenosis, T4 d) 70%-70% stenosis, T4 |
Table 3: Comparison of Newtonian and non-Newtonian models at T2, 70% stenosis
| Reverse flow length at downstream of stenosis (m) | Min. WSS at downstream of stenosis (Pa.s) | Max. WSS at stenosis throat (Pa.s) | Model |
| 0.01359 | -5.232 | 79.553 | Carreau |
| 0.01329 | -5.292 | 80.520 | Casson |
| 0.01439 | -5.178 | 79.096 | Carreau-Yasuda |
| 0.01469 | -5.156 | 79.192 | Generalized Power-law |
| 0.01603 | -4.601 | 27.665 | Power-law |
| 0.01469 | -5.132 | 78.957 | Newtonian |
Table 4: Comparison of Newtonian and non-Newtonian models at T2, 70%-70% stenosis
|
Reverse flow length at downstream of second stenosis (m) |
Reverse flow length at downstream
of first stenosis (m) |
Min. WSS at downstream of
second stenosis (Pa.s) |
Min. WSS at downstream of
first stenosis (Pa.s) |
Max. WSS at second stenosis
throat (Pa.s) |
Max. WSS at first stenosis
throat (Pa.s) |
Model |
| 0.0148 | 0.00924 | -4.803 | -5.260 | 72.868 | 79.867 | Carreau |
| 0.0142 | 0.00924 | -4.864 | -5.323 | 73.785 | 80.788 | Casson |
| 0.01575 | 0.00924 | -4.754 | -5.214 | 72.318 | 79.413 | Carreau-Yasuda |
| 0.0164 | 0.00924 | -4.718 | -5.179 | 72.324 | 79.470 | Generalized Power-law |
| 0.01745 | 0.00958 | -4.245 | -4.625 | 25.737 | 27.784 | Power-law |
| 0.0164 | 0.00924 | -4.703 | -5.162 | 71.988 | 79.164 | Newtonian |
Table 5: Comparison of Newtonian and non-Newtonian models at T4, 70% stenosis
| Reverse flow length at downstream of stenosis (m) | Min. WSS at downstream of stenosis (Pa.s) | Max. WSS at stenosis throat (Pa.s) | Model |
| 0.00294 | -0.246 | 6.786 | Carreau |
| 0.00267 | -0.233 | 7.034 | Casson |
| 0.00365 | -0.256 | 6.592 | Carreau-Yasuda |
| 0.00365 | -0.266 | 6.480 | Generalized Power-law |
| 0.00241 | -0.198 | 4.085 | Power-law |
| 0.00527 | -0.258 | 6.419 | Newtonian |
Another result seen in Figures 7a-7d and Tables 3 and 4 is that the maximum shear stresses at the simple stenosis throat and the first throat of the double stenosis are almost identical, which means that the second stenosis does not affect the maximum shear stress at the first stenosis. This can be justified considering the similarity of the axial velocity profiles at the 70% stenosis throat and the first throat of the 70%-70% stenosis. It was also observed that the shear stress values were greater in the first throat of the double stenosis than in the second throat of the double stenosis. The reason for this is that according to Figures 6b and 6c, velocity values are greater at the second stenosis, which, considering the constant flow rate, decreases the velocity gradient near the wall, reducing the shear stress.
As can be seen in Tables 3 and 4, in comparison with other non-Newtonian models and the Newtonian model, the power law model predicts much smaller values for shear stress and consequently much larger value for separation region length. This is obvious; because a lower shear stress value means that the fluid is less attached to the wall and tends to separate from it. Shear stress values are underestimated because the Power law model has the least viscosity at high shear rates.
As can be seen in Figures 7a-7d, the difference between the vascular wall shear stress values at maximum and minimum flow rates is very large (almost 14 times), and shear stress on the vessel wall constantly changes at other times of the cardiac cycle. The alternative changes of shear stress on the vascular lumen surface can break down the plaques, which in turn can make the stenosis more severe and lead to formation and development of blood clots in the vessels.
Tables 5 and 6 show that decreased velocity values reduces the maximum axial velocity and the separation region length at the minimum flow rate. At the minimum flow rate, the difference between the maximum axial velocities at the two throats of the double stenosis decreases. This can also be observed in Figure 7d. At small velocity values, by passing through the first stenosis, blood flow is less headed toward the centerline and return to the wall more quickly, increasing the stress on the second stenosis.
Table 6: Comparison of Newtonian and non-Newtonian models at T4, 70%-70% stenosis
|
Reverse flow length at downstream of second stenosis (m) |
Reverse flow length at downstream
of first stenosis (m) |
Min. WSS at downstream of
second stenosis (Pa.s) |
Min. WSS at downstream of
first stenosis (Pa.s) |
Max. WSS at second stenosis
throat (Pa.s) |
Max. WSS at first stenosis throat (Pa.s) |
Model |
| 0.00305 | 0.00298 | -0.229 | 0.222- | 6.549 | 6.687 | Carreau |
| 0.00280 | 0.00271 | -0.216 | -0.208 | 6.811 | 6.933 | Casson |
| 0.00355 | 0.00344 | -0.240 | -0.234 | 6.339 | 6.496 | Carreau-Yasuda |
| 0.00385 | 0.00344 | -0.250 | -0.242 | 6.192 | 6.383 | Generalized Power-law |
| 0.00225 | 0.00217 | -0.177 | -0.168 | 3.932 | 4.041 | Power-law |
| 0.00565 | 0.00507 | -0.242 | -0.237 | 6.147 | 6.324 | Newtonian |
It should be noted that at the maximum flow rate, velocity and consequently, shear rate, is high; therefore, the difference between the non-Newtonian models and the Newtonian model is small. Also, at the minimum flow rate, velocity and consequently, shear rate, is low, which leads to the greater difference between the Newtonian models and the Newtonian model. In other words, at low velocities, the Newtonian model is more sensitive to flow geometry than other models. This can be seen by comparing Tables 3 and 4 with Tables 5 and 6.
Also Tables 3 and 4 show that at the maximum flow rate, the separated flow in the double stenosis has a minimum length of 9.46 times the radius downstream of the second stenosis and 6.16 times the radius downstream of the first stenosis. In the simple stenosis, the separated flow has a minimum length of 8.86 times the radius. As can be seen in Tables 5 and 6, at the minimum flow rate, the separated flow in the double stenosis has a minimum length of 1.50 times the radius downstream of the second stenosis and 1.44 times the radius downstream of the first stenosis. In the simple stenosis, the separated flow has a minimum length of 1.60 times the radius. As an overall conclusion from Tables 3-6, the reverse flow region length, where the endothelial cells are prone to damage, is almost double in the double stenosis compared to the simple stenosis.
Conclusion
In this paper, the effect of stenosis in a vessel with flexible wall in a pulsatile laminar flow was numerically simulated using ADINA and five non-Newtonian models for a 70% stenosis severity. The results of the simple stenosis were compared to that of the double stenosis. The axial velocity diagram at the maximum flow rate showed that the second stenosis does not affect the first stenosis, and the axial velocity increases in the second stenosis. Therefore, shear stress decreases on the peak of the second stenosis, which can also be seen in shear stress diagrams.
References
- Yang, C., Tang, D., Yuan, C., Hatsukami, T.S., Zheng, J., Woodard, P.K., In Vivo/Ex Vivo MRI-Based 3D Non-Newtonian FSI Models for Human Atherosclerotic Plaques Compared with Fluid/Wall-Only Models, Comput. Model. Eng. Sci., 2007; 19(3): 233–246.
- Chan, W.Y., Ding, Y., Tu, J.Y., Modeling of non-Newtonian blood flow through a stenosed artery incorporating fluid-structure interaction, ANZIAM J., 2007; 47: C507-C523.
- Hundertmark-Zauskova, A., Lukacova-Medvidova, M., Numerical study of shear-dependent non-Newtonian fluids in compliant vessels, Comput. Math. Appl., 2010; 60: 572_590.
- Janela, J., Moura, A., Sequeira, A., A 3D non-Newtonian fluid_structure interaction model for blood flow in arteries, J. Comput. Appl. Math., 2010; 234: 2783-2791.
- Decorato, I., Kharboutly, Z., Legallais, C., Salsac, A.V., Numerical study of the influence of wall compliance on the hemodynamics in a patient-specific arteriovenous fistula, 20ème Congrès Français de Mécanique, Besançon, 29 août au 2 septembre 2011.
- Mortazavinia, Z., Goshtasbi Rad, E., Emdad, H., Sharifkazemi, M.B., Zare, A., Mehdizadeh, A.R., Study of Pulsatile Non-Newtonian Blood Flow Through Abdominal Aorta and Renal Arteries Incorporating Fluid- Structure Interaction, J. Biomed. Phys. Eng., 2012; 2(3): 93-102.
- Kabinejadian, F., Ghista, D.N., Compliant model of a coupled sequential coronary arterial bypass graft: Effects of vessel wall elasticity and non-Newtonian rheology on blood flow regime and hemodynamic parameters distribution, Med. Eng. Phys., 2012; 34: 860– 872.
- Theory and Modeling Guide, Volume III: ADINA CFD & FSI, Help of ADINA software, 2011.
- Razavi, A., Shirani, E., Sadeghi, M.R., Numerical simulation of blood pulsatile flow in a stenosed carotid artery using different rheological models, J. Biomech., 2011; 44 (11): 2021–2030.
- Sadeghi, M.R., Shirani, E., Tafazzoli-Shadpour, M., Samaee, M., The effects of stenosis severity on the hemodynamic parameters-assessment of the correlation between stress phase angle and wall shear stress, J. Biomech., 2011; 44 (15): 2614–2626.
- Mower, W.R., Quinonse, W.J., Gambhir, S.S., Effect of intraluminal thrombus on abdominal aortic aneurysm wall stress, J. Vasc. Surg., 1997; 26: 602–608.
- Zeng, D., Boutsianis, E., Ammann, M., Boomsma, K., A Study on the Compliance of a Right Coronary Artery and Its Impact on Wall Shear Stress, J. Biomech. Eng., 2008; 130(4): 041014.

