
Manuscript accepted on :
Published online on: 24-11-2015
Plagiarism Check: Yes
S. Karkuzhali1, D. Manimegalai2 and D. Santhi1
1Department of Information Technology National Engineering College, Kovilpatti, Tamilnadu, India. 2Department of E and I National Engineering College Kovilpatti, Tamilnadu, India.
DOI : https://dx.doi.org/10.13005/bpj/631
Abstract
Human Eye is one of the most sophisticated organ, with cornea ,retinal pigment epithelium, bruch membrane, macula, vitreous body, retina and optic nerve. Retinal image analysis is broadly used for screening the patients affected from sight threatening eye diseases like Diabetic Retinopathy (DR) and glaucoma. Optic disc (OD) margin is the mandatory landmark in establishing a frame of reference of classifying retinal and optic nerve pathology. Trustworthy and efficient OD localization and segmentation are important tasks in automatic eye disease screening. This paper presents a fully automated method for OD segmentation algorithm developed for retinal disease screening. First, preprocessing step used to remove noise by illumination correction and contrast enhancement. Second, a thresholding technique using Atanassov’s intuitionistic fuzzy set (A-IFS) is employed. This approach uses A-IFS histon, an encrustation of the histogram consist of the pixels that belong to the set of similar pixels, in roughness index A-IFS histon & histogram correlated to upper and lower approximations and optimum threshold value is identified which pixel belong to background or to object(OD). This approach is evaluated by means of three publicly available databases DRIVE, MESSIDOR, DIARETDB0, the experimental outcome shows that the overall performance is with 99% correct optic disc localization.
Keywords
Diabetic Retinopathy; Fundus Image; Optic Disc; Segmentation; Retinal image; Atanassov’s intuitionistic fuzzy set
Download this article as:| Copy the following to cite this article: Karkuzhali S, Manimegalai D, Santhi D. Effective Segmentation of Optic Disc in Retinal Images for Diagnosing Eye Diseases that Leads to Blindness. Biomed Pharmacol J 2015;8(1) |
| Copy the following to cite this URL: Karkuzhali S, Manimegalai D, Santhi D. Effective Segmentation of Optic Disc in Retinal Images for Diagnosing Eye Diseases that Leads to Blindness. Biomed Pharmacol J 2015;8(1). Available from: http://biomedpharmajournal.org/?p=1527 |
Introduction
Diabetes is a disorder of metabolism and is a major health care problem in India. It is estimated that by 2030 India will be the country with highest diabetic patient [1].Diabetic Retinopathy is an eye disease, adverse changes in retinal blood vessels that leads to vision loss without any symptoms temporary and later on permanently. DR is potentially considered as the major reason behind blindness in adults of age between 20 and 60 years, where it causes 45% of the legal blindness in patients with Diabetes Mellitus [2].As DR progressive disease, the longer a patient has untreated diabetes, the higher his chance of progress towards blindness. For this reason, early detection as well as the periodic screening of DR potentially helps in reducing the progression of this disease and in preventing the subsequent loss of vision capability [2]. Patient with DR have an increased risk of death from coronary disease and myocardial infarction [3]. The people who are affected by DR have excess risks of systemic vascular complications, including sub clinical and clinical stroke, coronary heart disease and nephropathy [5]. Medical image analysis involves the study of digital images with the objective of providing computational tool which will assist the quantification and visualization of interesting pathology and anatomical structures. Physicians have advanced diagnostic tool to evaluate their patients in order to plan different forms of management and monitor the progress more efficiently than before. However, this is a multidisciplinary task requires comprehensive knowledge in many disciplines such as image processing, soft computing, machine learning, pattern recognition and expert systems [4].Automated analysis algorithm provide accurate and efficient solution to the high demand of screening of DR [6, 12, 13].One of the first requirement of automatic screening system is the localization of anatomical landmarks such as OD, fovea and retinal vasculature. OD is the area of the retina where the retinal vasculature enters and leaves the eye and it marks the exit point of the optic nerve [7].It also characterized by a relatively pale view owing to the nerve tissue underlying it [8].OD detection used to classify left and right eyes in fovea-centered retinal images [9].Any change in structure of OD is a sign of various retinopathies especially for glaucoma [10]. Knowledge about OD position is also required for automating the determination of diagnostic indexes for hypertensive retinopathy, such as the Arteriolar-to-Venular diameter ratio (AVR) [11]. In this paper, we are using the concept of Atanassov’s Intuitionistic Fuzzy Set (A-IFS) histon approach. A-IFS Histon, an encrustation of the histogram, consists of the pixels belong to the set of similar pixels. In the rough set index, A-IFS histon and the histogram can be correlated to upper and lower approximations, respectively .A multithresholding algorithms, using roughness index is then employed to get optimum threshold values for image segmentation. The remainder of the paper is organized as follows: Section 2 involves State-of-Art; Section 3 involves the database used. Section 4 involves the proposed OD segmentation methodology in retinal images. Section 5 presents the experimental results and discussion. Finally, the conclusion of the paper is presented
Materials and Methods
Retinal Database Used
DRIVE (Digital Retinal Images for vessel Extraction) [14] is a publicly available image database. The images were acquired using a Canon CR5 non-mydriatic 3CCD camera with a 45 degree field of view (FOV). Each image was captured using 8 bits per color plane at 768 by 584 pixels. The DIARETDB0 database [15] consists of 130 color fundus images of which 20 are normal and 110 contain signs of the diabetic retinopathy (hard exudates, cotton wool spots, micronaneuyrysms, various hemorrhages like dot, blot and flame shaped and new vessels inside disc or elsewhere). Images were captured with a 50 degree field-of-view digital fundus camera with unknown camera settings. The 1200 eye fundus color numerical images of the posterior pole for the MESSIDOR database [16] were acquired by 3 ophthalmologic departments using a color video 3CCD camera on a Topcon TRC NW6 non-mydriatic retinograph with a 45 degree field of view.
Methodology
In this paper, we proposed OD segmentation based on A-IFS histon in retinal images. The input image is pre-processed using illumination correction and contrast enhancement.
Preprocessing
The input RGB image is pre-processed for noise, illumination correction and contrast enhancement. The RGB image is converted to LAB color space and the luminance channel L is subjected to following steps, 1. Weiner filter of 5X5 to remove noise 2. Illumination correction using low pass filter (median filter) 3.Contrast enhancement by mapping the intensity values from 0 to 255. The processed L channel is then concatenated with channels 1 and 2 .The concatenated LAB image is converted back to RGB image [17]. The LAB image is used for segmentation of OD. The proposed method flow diagram is shown below in fig 1.
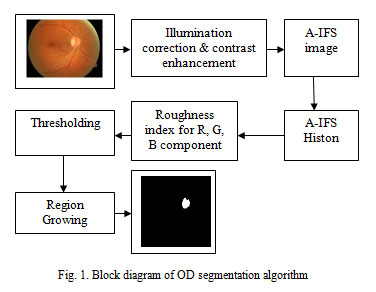 |
Figure 1: Block diagram of OD segmentation algorithm |
Segmentation of OD based on A-IFS histon
Attanassov’s Intuitionistic Fuzzy Sets (A-IFS) described using two characteristic functions expressing the degree of membership and the degree of non membership elements. A-IFS histon, an encrustation of the histogram, consists of pixels that belong to the set of similar pixels. In a rough theoretic sense, A-IFS histon and the histogram can be correlated to upper and lower approximations, respectively. Roughness index is then employed to get optimum threshold values for image segmentation.
The proposed concept of A-IFS histon uses A-IFS image representation to deal with the hesitancy in deciding the nature of pixels. The A-IFS representation of image involves definition of membership and non membership functions to describe the image properties such as brightness. Consider an image I of size MXN pixels, having intensity levels g between 0 and .The A-IFS representation of the image can be given as
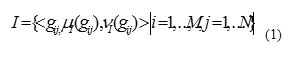
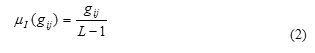
Where (gij) is the intensity level of pixel (i,j). μI (gij) is the degree of membership of (i,j) pixel in the image I. vI (gij) is the degree of non membership of (i,j) pixel in the image I.We consider the membership value at each pixel location to be simply the normalized intensity level as given by
![]()
Where μI (gij) is the membership value at each pixel location. The degree of hesitancy in deciding the pixel value is directly proportional to the absolute degree of membership degree and the average intensity at that location [18]. The average intensity can be calculated using a spatial domain averaging filter by simply taking the average of the pixels contained in the neighbourhood of the pixel mask as given by the following equation
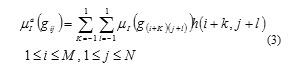
Where h is a filter mask, μI(g(i+k)(j+l)) the degree of membership between neighborhood pixels. The hesitancy degree at each pixel location of image is given by
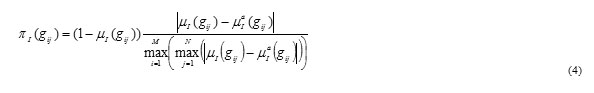
Multiplication with first term ensures that the constraint 0 ≤μI (gij) + πI(gij) ≤1 is always satisfied. Where |μI (gij) – μaI(gij) | is the difference membership degree and the average membership degree of pixels.
The histon is a contour plotted on the top of the existing histograms of the primary color components red, green and blue in such a manner that the collection of all points falling under the similar color sphere of predefined radius called expanse.
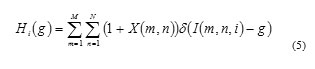
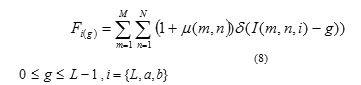
The histon of an image I of size M XN containing L number of gray levels is given by
![]()
Where δ(.) indicates the impulse function and X is a MXN matrix given by
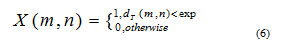
Where dT (m,n) is the distance between the pixel I(m,n) and I(p,q).
X(m,n) = 1, indicates the pixel at location (m, n) of an image I belongs to the similar color sphere. The A-IFS histon can be calculated as follows
Where μ(m,n) is the Gaussian membership function.
![]()
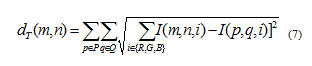
For a PXQ neighbourhood around a pixel I(m,n) the total distance of all the pixels in the neighbourhood of pixel I(p,q) is given by
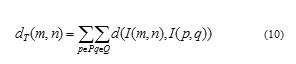
and σ is the standard deviation of the distance matrix dT(m,n). The Euclidean distance between two pixels I(m,n) and I(p,q) in the A-IFS image is given by.
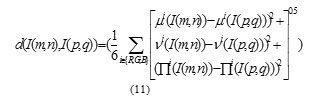
Thus, A-IFS histon gives a more realistic encrustation of histogram which helps in achieving a better segmentation quality compared to that of a histon [18].The histogram and the A-IFS can be correlated with the concept of approximation space in the rough set theory. The roughness index value of A-IFS can be defined as
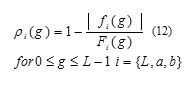
Where a fuzzy histogram of the image is, is the A-IFS histon of the color components R, G, B. The A-IFS histon roughness index is plotted for red, green and blue components of the image. In the roughness index the valley points represent the object boundaries and the region between the two valley points represents the object region between two valley points represents the object region, which is used for selecting the threshold to segment OD. The region growing method is applied to detect OD. The region which has an area greater than 3500 pixels has the maximum value of the ratio area/perimeter^2 and eccentricity greater than 0.8 is considered as OD. The OD segmented successfully and append on original image. Figure 2 and 3 shows step by step procedure for segmenting OD in both DIARETDB0 database and Indian Eye database. Image085 and Image086 belong to DIARETDB0 database. Image 2 belongs to Indian Eye Database.
Results and Discussion
In this section, we demonstrate the segmentation result of the proposed method on retinal images on DRIVE, MESSIDOR, and DIARETDB0.We generates ground truth images with the advice of an ophthalmologist. In the proposed work, segmentation algorithm is evaluated in terms of accuracy, sensitivity and specificity. These terms can best be understood with the standards followed universally with regard to medical images. The test result may be positive and negative indicating the presence of OD and absence of the OD respectively. The term ‘Gold standard’ refers to the exact possibility of presence or absence of the OD. Further, the conditions such as True Positive (TP), False Positive (FP), False Negative (FN) and True Negative (TN) refer to the presence or absence of the OD in the predicted images. The definitions of the above terms are given below.
True Positive (TP)
In this condition, the result of the test outcome is positive and the gold standard condition also is positive.
True Negative (TN)
Both the test outcome and gold standard represent negative.
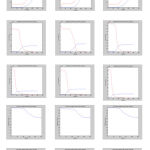 |
Figure 2: (a-c) 1st row-left to right Original Image, 2nd row 3rd row 4th row Histogram and A-FIS histon of RGB component , 5th row 6th row Roughness index of RG component |
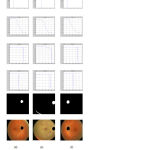 |
Figure 3: (d-f) 1st row-left to right Roughness index of B component, 2nd row 3rd row 4th row Peak value of RGB component, 5th row Segmented output, 6th row Segmented output appended on original image |
False Positive (FP)
The test outcome is positive but the gold standard refers to negative.
False Negative (FN)
The test outcome is negative but the gold standard refers to positive
All the above conditions related to test outcome and gold standards are illustrated in Table 1 shown below.
Table 1: Conditions Showing Tp, Tn, Fp And Fn
| Test Outcome |
Gold standard Condition | |
| Positive | Negative | |
| Positive | True Positive(TP) | False Positive (FP) |
| Negative | False Negative (FN) | True Negative (TN) |
The sensitivity, specificity and accuracy are predicted using the above conditions for the medical images as shown below.
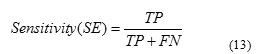
Sensitivity (SE)
It measures the ability of a test to predict the test outcome condition when the gold standard condition is positive as given in Equation (13).
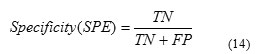
Specificity (SPE)
It measures the ability of a test to predict the test outcome condition as negative when the gold standard condition refers to negative as given in Equation (14)
Accuracy (ACC)
The accuracy is the proportion of true results (both true positives and true negatives) as given in Equation
The performance of the A-IFS histon algorithm in segmenting OD is evaluated using the color fundus images from DRIVE, MESSIDOR, DIARETDB0, Indian Eye database. It is performed against the manually segmented OD from Expert, which is taken as ground truth for OD. The observed values for the performance parameter TP, FP, FN and TN are given in terms of number of pixels. SE, SPE and ACC values are in terms of percentage and the processing time in seconds are given in Table 2.
Table 2: Performance Measure Values For A-Ifs Histon
| S.No | Image ID | Number of pixels | Percentage | Time Sec | |||||
| TP | FP | FN | TN | SE | SPE | ACC | |||
| 1 | 09_test | 315504 | 277 | 9480 | 4699 | 97 | 94 | 97 | 17.35 |
| 2 | 21_training | 323420 | 820 | 1173 | 4546 | 100 | 85 | 99 | 19.82 |
| 3 | 38_training | 325162 | 1640 | 3 | 3155 | 100 | 66 | 100 | 16.78 |
| 4 | 20051019_38557_
0100_PP |
3298017 | 4760 | 288 | 30055 | 100 | 86 | 100 | 148.23 |
| 5 | 20051020_44901_
0100_PP |
3298962 | 3880 | 170 | 30108 | 100 | 89 | 100 | 149.04 |
| 6 | 20051020_44923_
0100_PP |
3295809 | 8032 | 9 | 29270 | 100 | 78 | 100 | 150.08 |
| 7 | 20051020_52801_
0100_PP |
3290634 | 11701 | 5912 | 24873 | 100 | 68 | 99 | 147.94 |
| 8 | 20051020_55701_
0100_PP |
3295994 | 2613 | 1808 | 32705 | 100 | 93 | 100 | 149.37 |
| 9 | 20051020_56791_
0100_PP |
3290520 | 7307 | 70 | 35223 | 100 | 83 | 100 | 150.30 |
| 10 | 20051020_57157_
0100_PP |
3290536 | 8989 | 151 | 33444 | 100 | 79 | 100 | 151.44 |
| 11 | image002 | 1627840 | 0 | 0 | 100160 | 100 | 100 | 100 | 79.58 |
| 12 | image085 | 1496218 | 0 | 0 | 231782 | 100 | 100 | 100 | 82.27 |
| 13 | image086 | 1555225 | 0 | 0 | 172775 | 100 | 100 | 100 | 83.06 |
| 14 | image089 | 1689118 | 0 | 0 | 38882 | 100 | 100 | 100 | 82.26 |
| 15 | image090 | 1699515 | 0 | 0 | 28485 | 100 | 100 | 100 | 84.64 |
| 16 | Image112 | 1561713 | 0 | 0 | 166287 | 100 | 100 | 100 | 80.05 |
From the above performance measure values it is infer that for DRIVE MESSIDOR DIARETDB0 database, the sensitivity value is 99%, 100%, 100%. Specificity value for the three databases are 81%, 82%, 100%. Accuracy value for the above mentioned databases are 98%,99%,100% respectively. Average computation times for three databases are 18 seconds, 150 seconds and 81 seconds respectively
Conclusion
This paper presents an accurate and efficient OD detection and segmentation technique based on an A-IFS histon. Experiments over three public datasets show that an OD detection accuracy of 99% is obtained. In addition, average OD segmentation accuracies of 98%, 99% and 100% are obtained for the DRIVE, MESSIDOR and DIARETDB0 dataset within which many images of pathological retinas cannot be segmented by most state-of-the-art methods properly. Furthermore, the proposed technique needs around 2.5 minutes only for both OD detection and OD segmentation whereas most state-of-the-art methods need 3–4.5 min to perform the OD detection alone.
Acknowledgment
This study is supported by Indian Council of Medical Research, New Delhi (IRIS No.5/4/6/9/Oph/10-NCD-II). The authors thank Dr. Lionel Raj, Ophthalmologist and Mr. Hebar, Research Scientist, Agarwal Eye Hospital, Tirunelveli for providing Indian Retinal images. The authors also grateful to Dr. Akilanabharthy, Ophthalmologist, Brindavan Clinic, Sankarankovil for her guidance and Dr.Anadhi Manonmani, Ophthalmologist and Professor, Government Medical College, Tirunelveli for showing new research directions to our work.
References
- Datta,N.S., Banerjee,R., Dutta,H.S., Mukhopadhyay ,R, Hardware based analysis on automated early detection of Diabetic Retinopathy, Procedia Technology.,2012; 4: 256-4 .
- Saleh,M.D., Eswaran,C., An automated decision-support system for non-proliferative diabetic retinopathy disease based on MAs and HAs detection, COMPUT METH PROG BIO., 2012;108:186-10.
- Masuzawa,A.,Ohno.T.,Takamoto,S.,Motomura,N.Ono,M.,Fujita,H.,Ando,J.,Morito,T.,Hirata,Y.,Nagai,R.,Hirose.A.,Higeeda,T.S.,Kato,S.,Araie,M., In early-stage retinopathy, risk of cardiac events after implantation of sirolimus-eluting stents in higher than after coronary artery bypass surgery, Am J Cardiol.,2009; 53: 86-7.
- Yun,W.L.,Acharya,U.R.,Venkatesh,V.V.,Chee.C.,,Min,L.C.,Ng,E.Y.K.,Identification of different stages of diabetic retinopathy using retinal optical images , INFORM SCIENCES.,2008; 178:106-15.
- Cheung,N., Wong,T.Y., Diabetic Retinopathy and systemic vascular complications , PROG RETIN EYE RES.,2008; 27: 161-15.
- Yu,H., Barriga,E.S., Agurto,C., Echegaray,S., Pattichis,M.S., Bauman,W., Soliz,P., Fast localization and Segmentation of Optic Disc in Retinal images Using Directional Matched Filtering and Level Sets, IEEE Trans Inf Technol Biomed.,2012;16: 644-13.
- Niemeijer,M.,Abràmoff,M.D.,Ginneken,B.V., Fast detection of the optic disc and fovea in color fundus photographs, Med Image Anal,2009;13:859–11.
- Haleim, A. A., Youssif, A.R., Ghalwash, A. Z., Rahman ,A.A.S.A.,Optic Disc Detection From Normalized Digital Fundus Images by Means of a Vessels’ Direction Matched Filter, IEEE Trans. Med. Imag.,2008;27: 11-7.
- Avinash Ramakanth,S., Venkatesh Babu ,R.,Approximate Nearest Neighbour Field bases Optic Disk Detection, Comput Med Imaging Graph., 2014;38:2014, 49-7.
- Hsiao,H.K., Liu,C.C., Yu ,C.Y., Kuo,S.W., Yu ,S.S., A novel optic disc detection scheme on retinal images, Expert Syst Appl.,2012; 39: 10600–6.
- Mendonc,A.M.,Sousa,A., Mendona,L.,Campilho,A., ,Automatic localization of the optic disc by combining vascular and intensity information, Comput Med Imaging Graph.,2013; 37: pp. 409-8.
- Joshi,G., Sivaswamy,J.,Krishnadas,S.R., Depth Discontinuity-Based Cup Segmentation From Multiview Color Retinal Images, IEEE Trans Biomed Eng.,2012;59: 1523-8.
- DuanggateC., ,Uyyanonvaraa,B., Makhanova,S.S., Barmanb,S., Williamsonc,T., Parameter-free optic disc detection, Comput Med Imaging Graph.,2011;35:51–12.
- Staal, J.J., Abramoff,M.D., Niemeijer,M., Viergever,M.A., van Ginneken,B., Ridge based vessel segmentation in color images of the retina, IEEE Transactions on Medical Imaging., 2004;23: 501-8.
- http://www2.it.lut.fi/project/imageret/diaretdb0/
- http://messidor.crihan.fr/index-en.php
- Mookiah,M.R.K.,Rajendre,U.,Acharya,Martis,R.J.,Hua,C.M.C.,Lim,C.M.,Ng,E.Y.K.,Laude,A.Evolutionary algorithm based classifier parameter tuning for automatic diabetic retinopathy grading :A Hybrid Feature extraction approach, KNOWL-BASED SYST.,2013; 39:2013, 9-13.
- Mushrif,M.M., Ray,A.K., A-IFS Histon based Mutithresholding Algorithm for Color Image Segmentation, IEEE Signal Process. Lett., 2009;16: 168- 3.

